
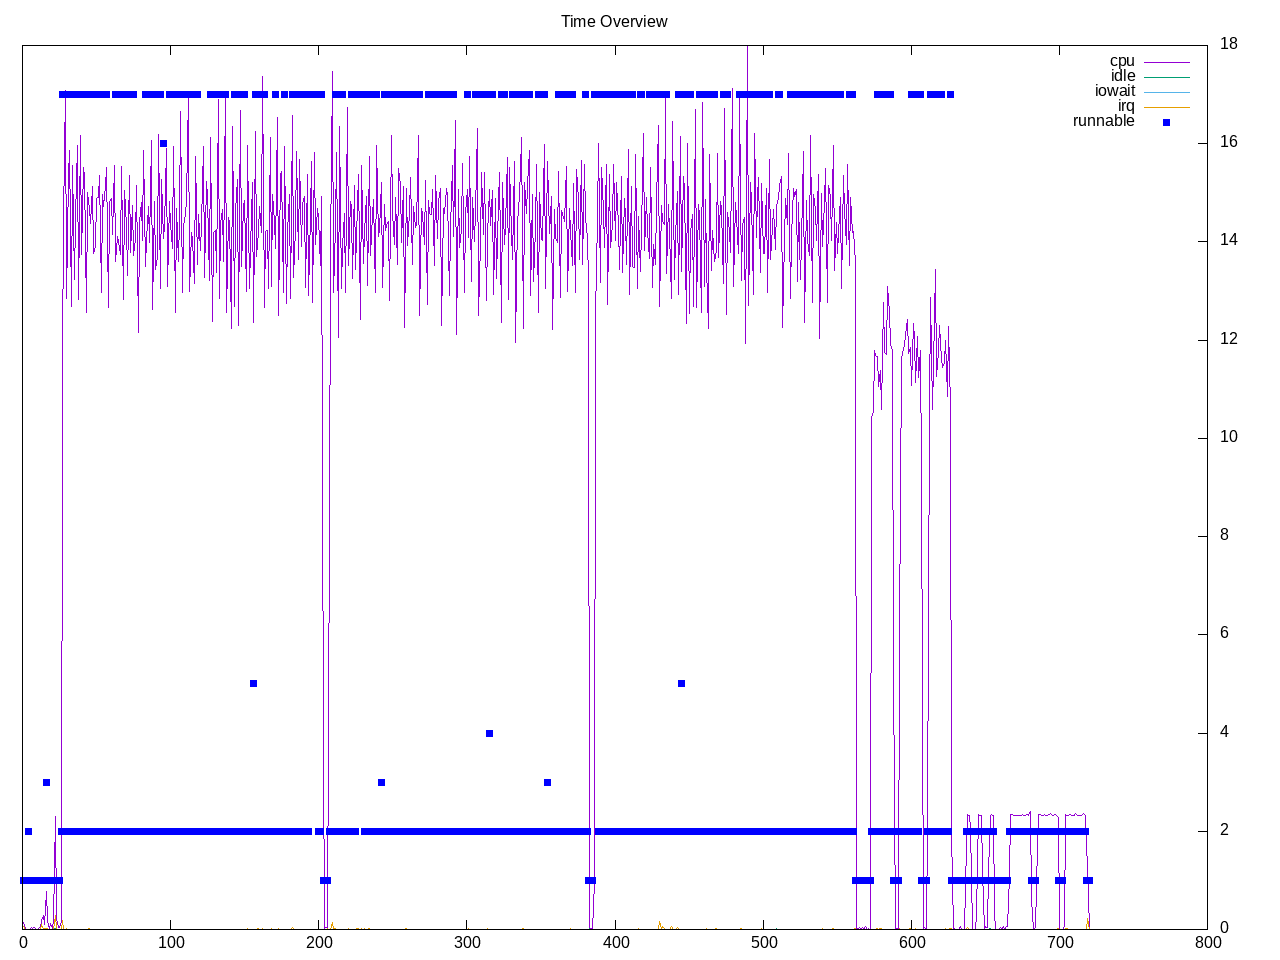
An open source deep learning framework from Tencent. There are four workloads, all on the CPU and for densenet, mobilenet, squeezenet v2 and squeezenet v1.1. The densenet workload runs on all cores and other workloads look single-threaded.
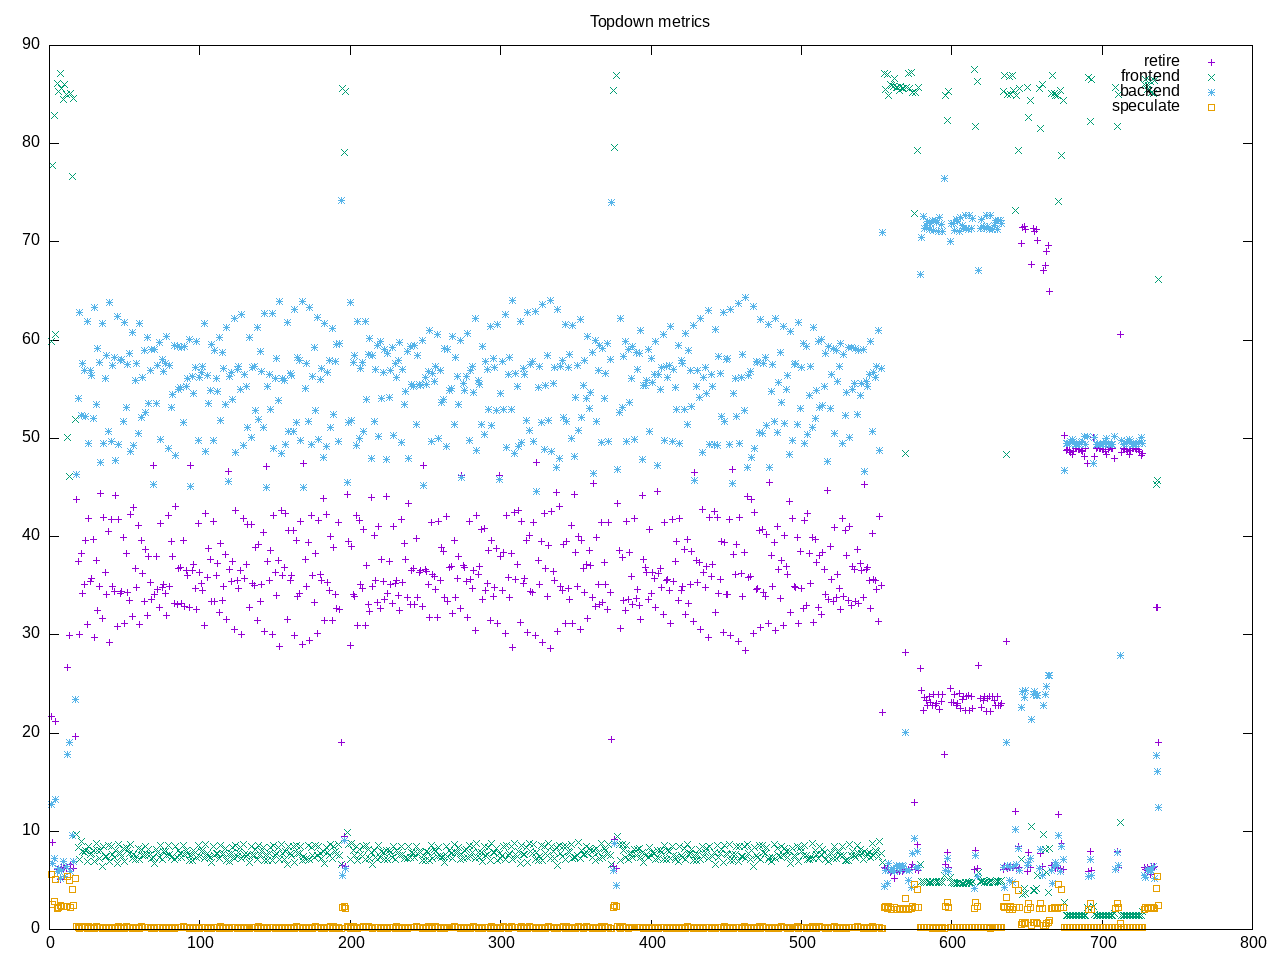
Topdown profile also shows different profiles for the benchmarks. However a general theme of being dominated by backend stalls and having mostly low levels of frontend stalls except for in transition.
AMD metrics show not many floating point and having ~50 L2 access per 1000 instructions.
elapsed              739.513
on_cpu               0.302          # 4.82 / 16 cores
utime                3560.039
stime                7.444
nvcsw                223692         # 87.59%
nivcsw               31706          # 12.41%
inblock              0              # 0.00/sec
onblock              13776          # 18.63/sec
cpu-clock            3564316007029  # 3564.316 seconds
task-clock           3564837738544  # 3564.838 seconds
page faults          228836         # 64.193/sec
context switches     258899         # 72.626/sec
cpu migrations       814            # 0.228/sec
major page faults    3              # 0.001/sec
minor page faults    228833         # 64.192/sec
alignment faults     0              # 0.000/sec
emulation faults     0              # 0.000/sec
branches             4196404420376  # 189.470 branches per 1000 inst
branch misses        3237305237     # 0.08% branch miss
conditional          3022374000895  # 136.462 conditional branches per 1000 inst
indirect             305139741479   # 13.777 indirect branches per 1000 inst
cpu-cycles           14722665973061 # 1.25 GHz
instructions         22146096055369 # 1.50 IPC
slots                29444273560320 #
retiring             7301956221892  # 24.8% (35.8%)
-- ucode             40904035395    #     0.1%
-- fastpath          7261052186497  #    24.7%
frontend             1517745054634  #  5.2% ( 7.4%)
-- latency           419893118628   #     1.4%
-- bandwidth         1097851936006  #     3.7%
backend              11560250031251 # 39.3% (56.6%)
-- cpu               5778461213660  #    19.6%
-- memory            5781788817591  #    19.6%
speculation          39744504863    #  0.1% ( 0.2%) low
-- branch mispredict 36045076797    #     0.1%
-- pipeline restart  3699428066     #     0.0%
smt-contention       9024536450254  # 30.6% ( 0.0%)
cpu-cycles           14721801786379 # 1.24 GHz
instructions         22187875339042 # 1.51 IPC
instructions         7369246766729  # 51.188 l2 access per 1000 inst
l2 hit from l1       234221533537   # 0.97% l2 miss
l2 miss from l1      1817504517     #
l2 hit from l2 pf    141169526887   #
l3 hit from l2 pf    1747943816     #
l3 miss from l2 pf   78990687       #
instructions         7382349757638  # 48.622 float per 1000 inst
float 512            65             # 0.000 AVX-512 per 1000 inst
float 256            770            # 0.000 AVX-256 per 1000 inst
float 128            358941089279   # 48.622 AVX-128 per 1000 inst
float MMX            0              # 0.000 MMX per 1000 inst
float scalar         0              # 0.000 scalar per 1000 inst
Intel metrics
elapsed              957.141
on_cpu               0.418          # 6.68 / 16 cores
utime                6393.282
stime                4.919
nvcsw                205201         # 78.38%
nivcsw               56603          # 21.62%
inblock              328            # 0.34/sec
onblock              2664           # 2.78/sec
cpu-clock            6393687302717  # 6393.687 seconds
task-clock           6393965412585  # 6393.965 seconds
page faults          232344         # 36.338/sec
context switches     266387         # 41.662/sec
cpu migrations       40747          # 6.373/sec
major page faults    2              # 0.000/sec
minor page faults    232342         # 36.338/sec
alignment faults     0              # 0.000/sec
emulation faults     0              # 0.000/sec
branches             5392050354022  # 188.279 branches per 1000 inst
branch misses        5089990262     # 0.09% branch miss
conditional          5392050370150  # 188.279 conditional branches per 1000 inst
indirect             1477539033770  # 51.592 indirect branches per 1000 inst
slots                40379208406658 #
retiring             15114663323800 # 37.4% (37.4%)
-- ucode             1079718189390  #     2.7%
-- fastpath          14034945134410 #    34.8%
frontend             2281353403271  #  5.6% ( 5.6%)
-- latency           1328892806649  #     3.3%
-- bandwidth         952460596622   #     2.4%
backend              22305036556297 # 55.2% (55.2%)
-- cpu               20253897577472 #    50.2%
-- memory            2051138978825  #     5.1%
speculation          428791222988   #  1.1% ( 1.1%)
-- branch mispredict 335441759078   #     0.8%
-- pipeline restart  93349463910    #     0.2%
smt-contention       0              #  0.0% ( 0.0%)
cpu-cycles           16045151722351 # 1.32 GHz
instructions         22585698220732 # 1.41 IPC
l2 access            408311732315   # 30.691 l2 access per 1000 inst
l2 miss              9044196543     # 2.22% l2 miss
Process overview shows almost all of the time in TNNtest
468 processes
	102 TNNTest              56099.20    83.22
	 68 clinfo                  19.17     7.99
	 38 vulkaninfo               1.50     1.33
	  4 vulkani:disk$0           0.15     0.14
	  6 glxinfo:gdrv0            0.15     0.07
	  6 glxinfo:gl0              0.15     0.07
	  6 php                      0.10     0.14
	  2 llvmpipe-0               0.08     0.07
	  2 llvmpipe-1               0.08     0.07
	  2 llvmpipe-10              0.08     0.07
	  2 llvmpipe-11              0.08     0.07
	  2 llvmpipe-12              0.08     0.07
	  2 llvmpipe-13              0.08     0.07
	  2 llvmpipe-14              0.08     0.07
	  2 llvmpipe-15              0.08     0.07
	  2 llvmpipe-2               0.08     0.07
	  2 llvmpipe-3               0.08     0.07
	  2 llvmpipe-4               0.08     0.07
	  2 llvmpipe-5               0.08     0.07
	  2 llvmpipe-6               0.08     0.07
	  2 llvmpipe-7               0.08     0.07
	  2 llvmpipe-8               0.08     0.07
	  2 llvmpipe-9               0.08     0.07
	  2 glxinfo                  0.07     0.03
	  2 glxinfo:cs0              0.07     0.03
	  2 glxinfo:disk$0           0.07     0.03
	  2 glxinfo:sh0              0.07     0.03
	  2 glxinfo:shlo0            0.07     0.03
	  6 clang                    0.06     0.06
	  3 rocminfo                 0.03     0.00
	  1 lspci                    0.00     0.03
	  1 ps                       0.00     0.01
	 88 sh                       0.00     0.00
	 13 gcc                      0.00     0.00
	 12 tnn                      0.00     0.00
	 10 gsettings                0.00     0.00
	  8 stat                     0.00     0.00
	  8 systemd-detect-          0.00     0.00
	  6 llvm-link                0.00     0.00
	  5 phoronix-test-s          0.00     0.00
	  4 gmain                    0.00     0.00
	  2 cc                       0.00     0.00
	  2 dconf worker             0.00     0.00
	  2 lscpu                    0.00     0.00
	  2 uname                    0.00     0.00
	  2 which                    0.00     0.00
	  2 xset                     0.00     0.00
	  1 date                     0.00     0.00
	  1 dirname                  0.00     0.00
	  1 dmesg                    0.00     0.00
	  1 dmidecode                0.00     0.00
	  1 grep                     0.00     0.00
	  1 ifconfig                 0.00     0.00
	  1 ip                       0.00     0.00
	  1 lsmod                    0.00     0.00
	  1 mktemp                   0.00     0.00
	  1 qdbus                    0.00     0.00
	  1 readlink                 0.00     0.00
	  1 realpath                 0.00     0.00
	  1 sed                      0.00     0.00
	  1 sort                     0.00     0.00
	  1 stty                     0.00     0.00
	  1 systemctl                0.00     0.00
	  1 template.sh              0.00     0.00
	  1 wc                       0.00     0.00
	  1 xrandr                   0.00     0.00
0 processes running
47 maximum processes
Computation structures start one thread on each cover, at least for the first workload
     1119747) tnn              cpu=1 start=7.90  finish=183.99
        1119748) TNNTest          cpu=5 start=7.90  finish=183.99
          1119749) TNNTest          cpu=3 start=8.11  finish=183.99
          1119750) TNNTest          cpu=15 start=8.11  finish=183.99
          1119751) TNNTest          cpu=6 start=8.11  finish=183.99
          1119752) TNNTest          cpu=9 start=8.11  finish=183.99
          1119753) TNNTest          cpu=7 start=8.11  finish=183.99
          1119754) TNNTest          cpu=14 start=8.11  finish=183.99
          1119755) TNNTest          cpu=13 start=8.11  finish=183.99
          1119756) TNNTest          cpu=2 start=8.11  finish=183.99
          1119757) TNNTest          cpu=12 start=8.11  finish=183.99
          1119758) TNNTest          cpu=10 start=8.11  finish=183.99
          1119759) TNNTest          cpu=0 start=8.11  finish=183.99
          1119760) TNNTest          cpu=11 start=8.11  finish=183.99
          1119761) TNNTest          cpu=4 start=8.11  finish=183.99
          1119762) TNNTest          cpu=8 start=8.11  finish=183.99
          1119763) TNNTest          cpu=1 start=8.11  finish=183.99