
A cross-platform GPU stress test with OpenGL and Vulkan drivers. There are 160 combinations of drivers, screen sizes and MSAA settings. This test picks 1920×1200 resolution with OpenGL and all MSAA settings. Overall system shows this is now a CPU benchmark and runes with just a few threads.
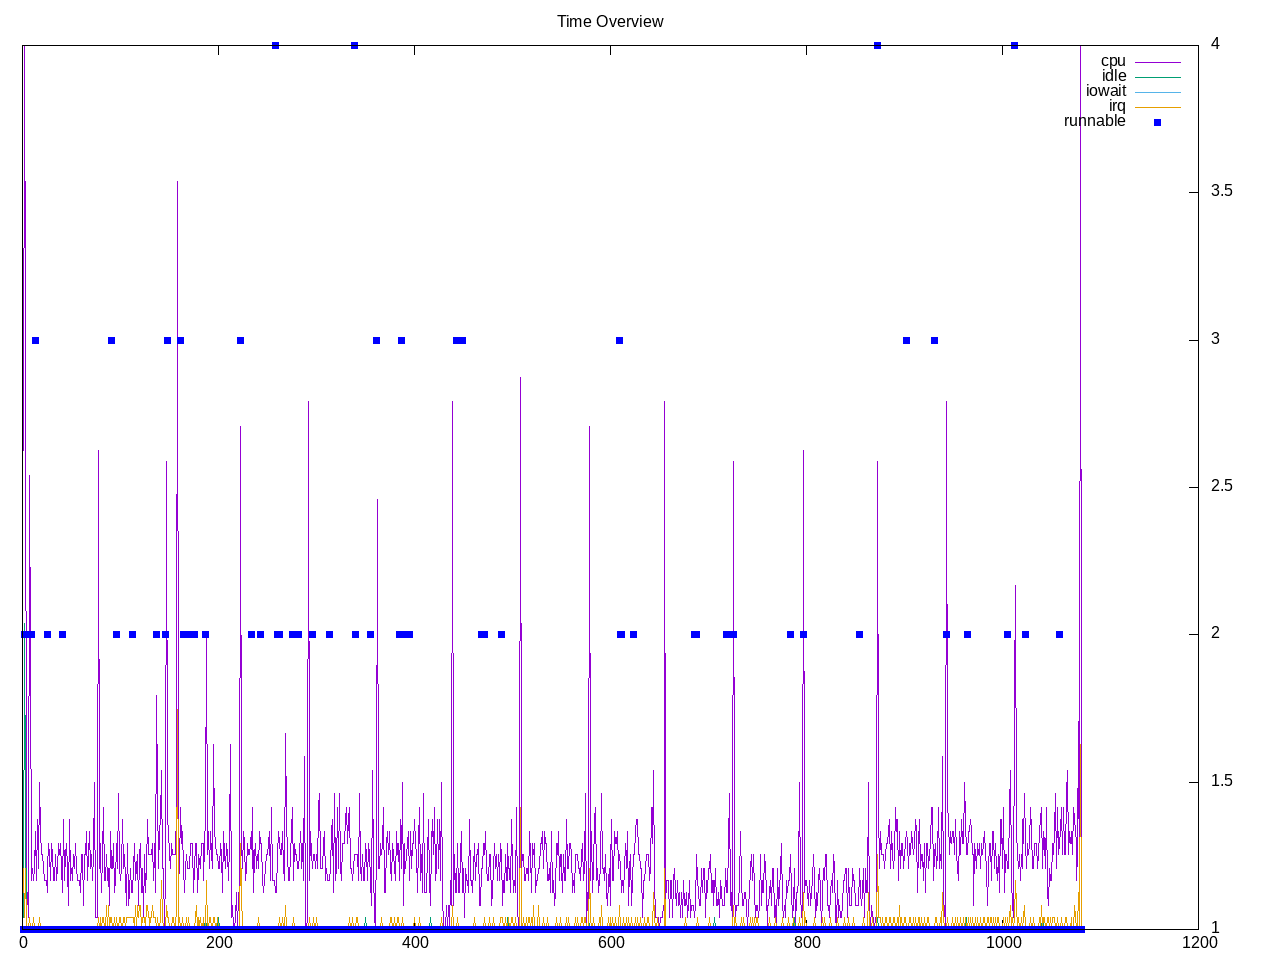
Topdown profile shows the little CPU time is spent in frontend stalls.
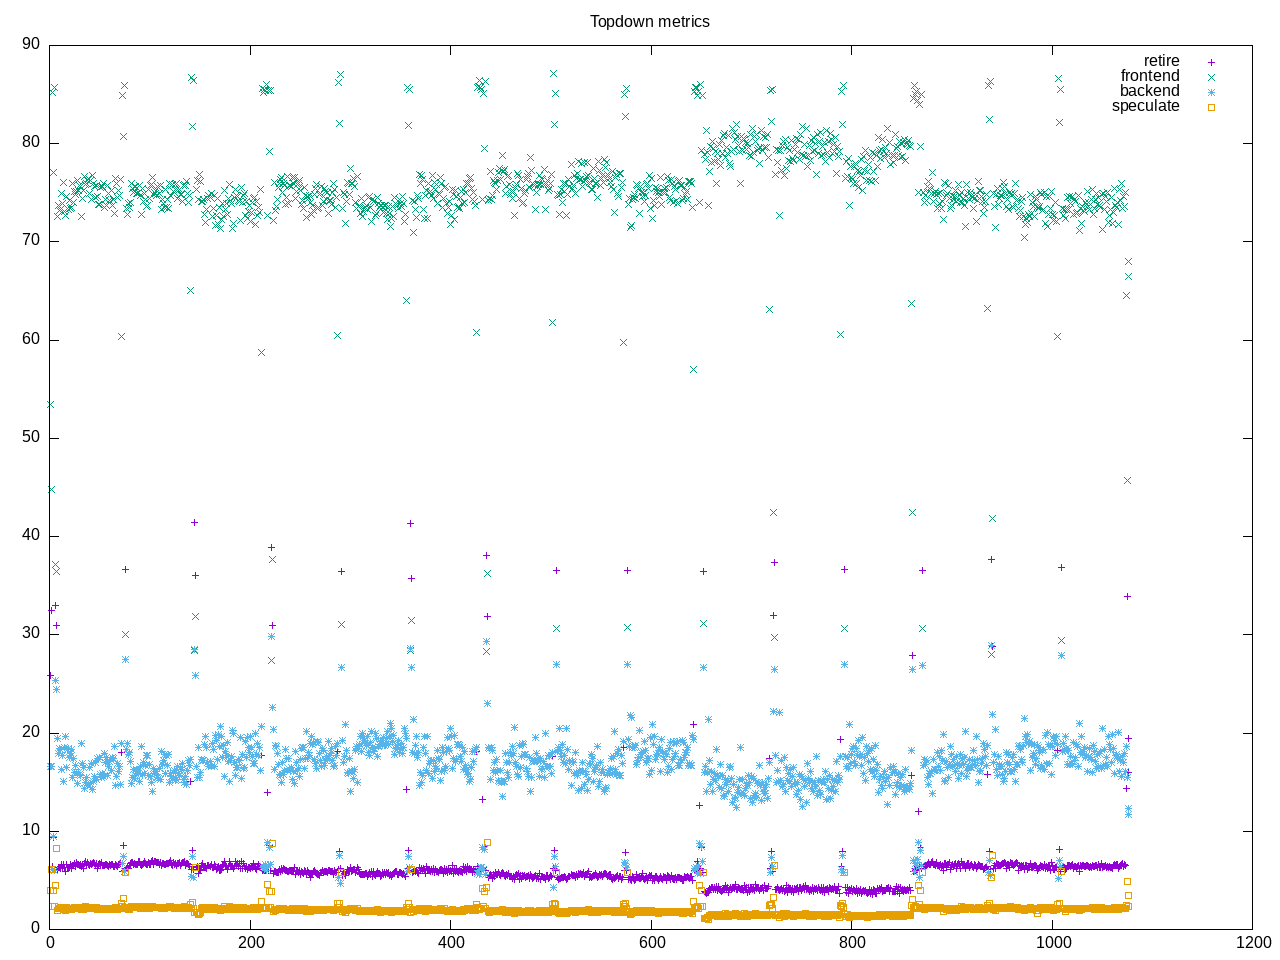
AMD metrics show only 1/30th of a core time spent.
elapsed              1076.862
on_cpu               0.002          # 0.03 / 16 cores
utime                20.084
stime                16.793
nvcsw                162027         # 99.31%
nivcsw               1122           # 0.69%
inblock              8              # 0.01/sec
onblock              13640          # 12.67/sec
cpu-clock            32019749507    # 32.020 seconds
task-clock           32688331876    # 32.688 seconds
page faults          476048         # 14563.239/sec
context switches     168328         # 5149.483/sec
cpu migrations       1007           # 30.806/sec
major page faults    2              # 0.061/sec
minor page faults    476046         # 14563.178/sec
alignment faults     0              # 0.000/sec
emulation faults     0              # 0.000/sec
branches             8777901101     # 159.914 branches per 1000 inst
branch misses        365812203      # 4.17% branch miss
conditional          5205216990     # 94.828 conditional branches per 1000 inst
indirect             507105797      # 9.238 indirect branches per 1000 inst
cpu-cycles           53961154591    # 0.00 GHz
instructions         54738144413    # 1.01 IPC
slots                108780603978   #
retiring             19232090905    # 17.7% (17.7%)
-- ucode             52330631       #     0.0%
-- fastpath          19179760274    #    17.6%
frontend             64353407460    # 59.2% (59.3%) high
-- latency           58838576598    #    54.1%
-- bandwidth         5514830862     #     5.1%
backend              21298430222    # 19.6% (19.6%)
-- cpu               2146489744     #     2.0%
-- memory            19151940478    #    17.6%
speculation          3655643434     #  3.4% ( 3.4%)
-- branch mispredict 3554005285     #     3.3%
-- pipeline restart  101638149      #     0.1%
smt-contention       240343787      #  0.2% ( 0.0%)
cpu-cycles           54536598047    # 0.00 GHz
instructions         54631269920    # 1.00 IPC
instructions         18245618756    # 37.691 l2 access per 1000 inst
l2 hit from l1       615783822      # 43.13% l2 miss
l2 miss from l1      254071074      #
l2 hit from l2 pf    29368657       #
l3 hit from l2 pf    16021795       #
l3 miss from l2 pf   26518276       #
instructions         18197223178    # 62.137 float per 1000 inst
float 512            64             # 0.000 AVX-512 per 1000 inst
float 256            674            # 0.000 AVX-256 per 1000 inst
float 128            1130722912     # 62.137 AVX-128 per 1000 inst
float MMX            0              # 0.000 MMX per 1000 inst
float scalar         0              # 0.000 scalar per 1000 inst
instructions         54655192673    #
opcache              12529239376    # 229.242 opcache per 1000 inst
opcache miss         3057310348     # 24.4% opcache miss rate
l1 dTLB miss         105870486      # 1.937 L1 dTLB per 1000 inst
l2 dTLB miss         24007702       # 0.439 L2 dTLB per 1000 inst
instructions         54611990576    #
icache               7369764703     # 134.948 icache per 1000 inst
icache miss          1623602659     # 22.0% icache miss rate
l1 iTLB miss         39060559       # 0.715 L1 iTLB per 1000 inst
l2 iTLB miss         0              # 0.000 L2 iTLB per 1000 inst
tlb flush            25177          # 0.000 TLB flush per 1000 inst
Intel metrics
elapsed              1083.609
on_cpu               0.002          # 0.03 / 16 cores
utime                15.516
stime                15.960
nvcsw                116053         # 99.64%
nivcsw               423            # 0.36%
inblock              64             # 0.06/sec
onblock              2344           # 2.16/sec
cpu-clock            27100165512    # 27.100 seconds
task-clock           27755281301    # 27.755 seconds
page faults          375809         # 13540.090/sec
context switches     121705         # 4384.931/sec
cpu migrations       1051           # 37.867/sec
major page faults    1              # 0.036/sec
minor page faults    375808         # 13540.054/sec
alignment faults     0              # 0.000/sec
emulation faults     0              # 0.000/sec
branches             6642555358     # 150.585 branches per 1000 inst
branch misses        110237614      # 1.66% branch miss
conditional          6642575742     # 150.585 conditional branches per 1000 inst
indirect             478025670      # 10.837 indirect branches per 1000 inst
slots                195395490248   #
retiring             59217355013    # 30.3% (30.3%)
-- ucode             6707380516     #     3.4%
-- fastpath          52509974497    #    26.9%
frontend             30497378415    # 15.6% (15.6%)
-- latency           17340657935    #     8.9%
-- bandwidth         13156720480    #     6.7%
backend              94477580844    # 48.4% (48.4%)
-- cpu               28046200975    #    14.4%
-- memory            66431379869    #    34.0%
speculation          11809887438    #  6.0% ( 6.0%)
-- branch mispredict 10842411803    #     5.5%
-- pipeline restart  967475635      #     0.5%
smt-contention       0              #  0.0% ( 0.0%)
cpu-cycles           34678455881    # 0.00 GHz
instructions         46157951024    # 1.33 IPC
l2 access            1951534064     # 45.139 l2 access per 1000 inst
l2 miss              1285026344     # 65.85% l2 miss
cpu-cycles           32708750023    # 39.3% memory latency
load stalls          6497272907     #  3.9% l1 bound
l1 miss              5216356433     #  4.1% l2 bound
l2 miss              3877407117     #  2.1% l3 bound
l3 miss              3202485247     #  9.8% dram bound
store_stalls         6343834109     # 19.4% store bound
Overall, this is a GPU test and not a CPU test.