
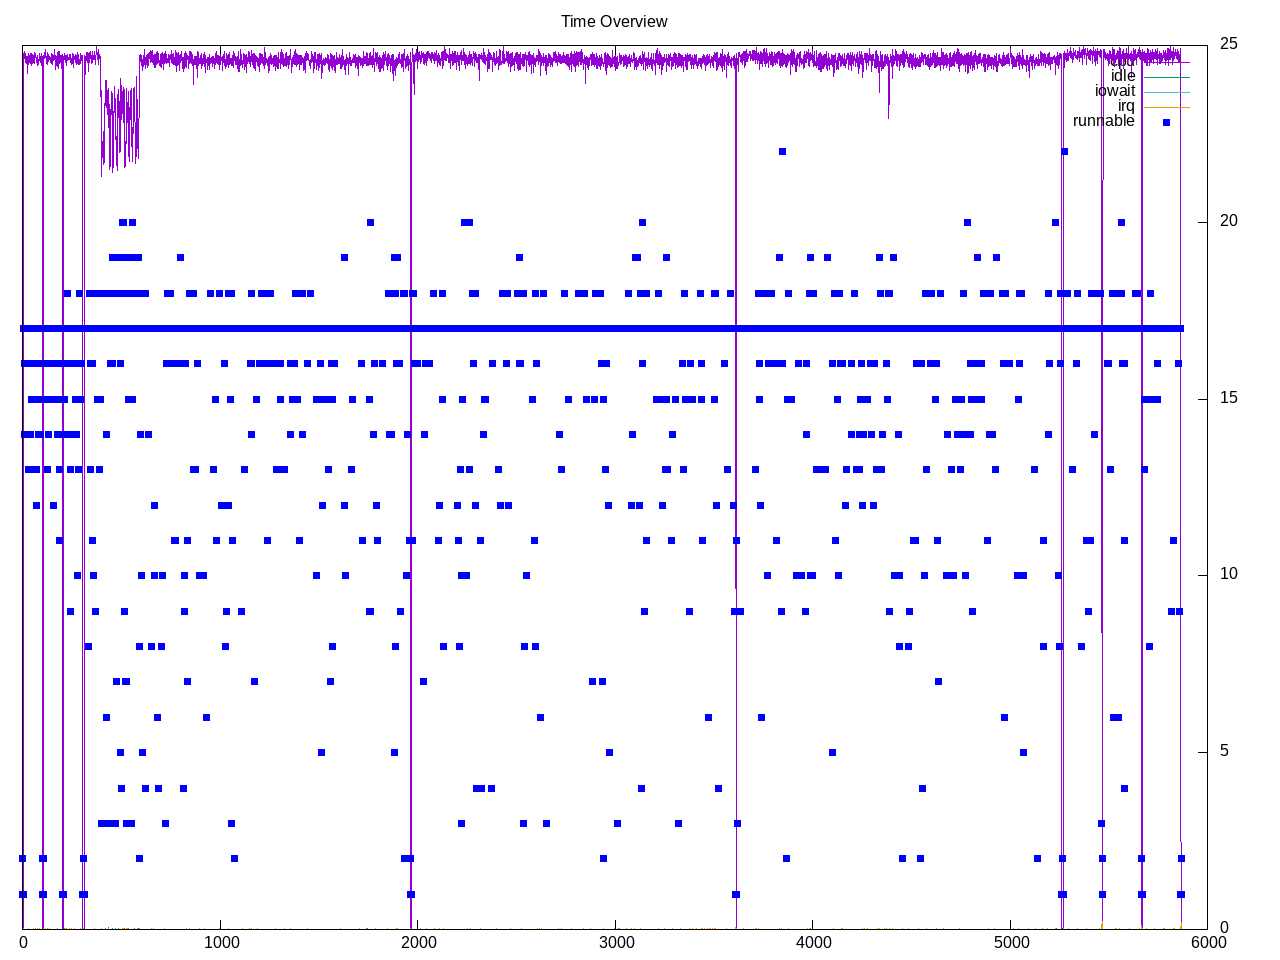
Cloverleaf is a hydrodynamics benchmark with three workloads. Almost all the time is spent in the second workload. The overall profile suggests a runable process on every core.
Topdown metrics show a very memory bound application.with little time in retiring instructions.

AMD metrics show floating point code without many branches. There is a reasonably high L2 miss rate.
elapsed              5873.670
on_cpu               0.972          # 15.56 / 16 cores
utime                91203.508
stime                189.167
nvcsw                3950849        # 83.79%
nivcsw               764581         # 16.21%
inblock              8              # 0.00/sec
onblock              47808          # 8.14/sec
cpu-clock            91496573378200 # 91496.573 seconds
task-clock           91501724220020 # 91501.724 seconds
page faults          11117501       # 121.500/sec
context switches     4744569        # 51.852/sec
cpu migrations       100280         # 1.096/sec
major page faults    55             # 0.001/sec
minor page faults    11117446       # 121.500/sec
alignment faults     0              # 0.000/sec
emulation faults     0              # 0.000/sec
branches             5634504972305  # 52.699 branches per 1000 inst
branch misses        34518004796    # 0.61% branch miss
conditional          4723812723676  # 44.181 conditional branches per 1000 inst
indirect             450208732      # 0.004 indirect branches per 1000 inst
cpu-cycles           416297076847393 # 4.42 GHz
instructions         106923594819988 # 0.26 IPC
slots                832408287294990 #
retiring             36729774536367 #  4.4% ( 4.7%)
-- ucode             16033010471    #     0.0%
-- fastpath          36713741525896 #     4.4%
frontend             19057802930313 #  2.3% ( 2.4%)
-- latency           13207251742008 #     1.6%
-- bandwidth         5850551188305  #     0.7%
backend              733264248976694 # 88.1% (92.9%)
-- cpu               125417997459295 #    15.1%
-- memory            607846251517399 #    73.0%
speculation          665948773067   #  0.1% ( 0.1%)
-- branch mispredict 591782708845   #     0.1%
-- pipeline restart  74166064222    #     0.0%
smt-contention       42689832224123 #  5.1% ( 0.0%)
cpu-cycles           416281856017187 # 4.42 GHz
instructions         106924788382785 # 0.26 IPC
instructions         35640174860193 # 85.328 l2 access per 1000 inst
l2 hit from l1       1723378795510  # 34.64% l2 miss
l2 miss from l1      239934204030   #
l2 hit from l2 pf    504278478852   #
l3 hit from l2 pf    37875169844    #
l3 miss from l2 pf   775570101725   #
instructions         35622630123443 # 271.330 float per 1000 inst
float 512            60             # 0.000 AVX-512 per 1000 inst
float 256            672            # 0.000 AVX-256 per 1000 inst
float 128            9665485999618  # 271.330 AVX-128 per 1000 inst
float MMX            0              # 0.000 MMX per 1000 inst
float scalar         1              # 0.000 scalar per 1000 inst
Intel metrics similarly show missing L2 cache.
elapsed              9195.794
on_cpu               0.893          # 14.28 / 16 cores
utime                131158.728
stime                180.440
nvcsw                4459732        # 79.97%
nivcsw               1117243        # 20.03%
inblock              7232           # 0.79/sec
onblock              53072          # 5.77/sec
cpu-clock            131303755757174 # 131303.756 seconds
task-clock           131309362105649 # 131309.362 seconds
page faults          11289647       # 85.977/sec
context switches     5622700        # 42.820/sec
cpu migrations       690226         # 5.256/sec
major page faults    162            # 0.001/sec
minor page faults    11289485       # 85.976/sec
alignment faults     0              # 0.000/sec
emulation faults     0              # 0.000/sec
branches             6119594162100  # 52.521 branches per 1000 inst
branch misses        32286755507    # 0.53% branch miss
conditional          6119594182260  # 52.521 conditional branches per 1000 inst
indirect             2090955801758  # 17.945 indirect branches per 1000 inst
slots                474390606585344 #
retiring             71789897080078 # 15.1% (15.1%)
-- ucode             13179968617235 #     2.8%
-- fastpath          58609928462843 #    12.4%
frontend             29418725753857 #  6.2% ( 6.2%)
-- latency           18241180851442 #     3.8%
-- bandwidth         11177544902415 #     2.4%
backend              378719773656819 # 79.8% (79.8%)
-- cpu               62995505319387 #    13.3%
-- memory            315724268337432 #    66.6%
speculation          4567039699865  #  1.0% ( 1.0%)
-- branch mispredict 3065558847064  #     0.6%
-- pipeline restart  1501480852801  #     0.3%
smt-contention       0              #  0.0% ( 0.0%)
cpu-cycles           345428388454584 # 2.51 GHz
instructions         122694459382065 # 0.36 IPC
l2 access            3480548081213  # 62.611 l2 access per 1000 inst
l2 miss              1791504627857  # 51.47% l2 miss
Process overview crashed part way through the second workload so we don’t have a full account.
elapsed              9195.794
on_cpu               0.893          # 14.28 / 16 cores
utime                131158.728
stime                180.440
nvcsw                4459732        # 79.97%
nivcsw               1117243        # 20.03%
inblock              7232           # 0.79/sec
onblock              53072          # 5.77/sec
cpu-clock            131303755757174 # 131303.756 seconds
task-clock           131309362105649 # 131309.362 seconds
page faults          11289647       # 85.977/sec
context switches     5622700        # 42.820/sec
cpu migrations       690226         # 5.256/sec
major page faults    162            # 0.001/sec
minor page faults    11289485       # 85.976/sec
alignment faults     0              # 0.000/sec
emulation faults     0              # 0.000/sec
branches             6119594162100  # 52.521 branches per 1000 inst
branch misses        32286755507    # 0.53% branch miss
conditional          6119594182260  # 52.521 conditional branches per 1000 inst
indirect             2090955801758  # 17.945 indirect branches per 1000 inst
slots                474390606585344 #
retiring             71789897080078 # 15.1% (15.1%)
-- ucode             13179968617235 #     2.8%
-- fastpath          58609928462843 #    12.4%
frontend             29418725753857 #  6.2% ( 6.2%)
-- latency           18241180851442 #     3.8%
-- bandwidth         11177544902415 #     2.4%
backend              378719773656819 # 79.8% (79.8%)
-- cpu               62995505319387 #    13.3%
-- memory            315724268337432 #    66.6%
speculation          4567039699865  #  1.0% ( 1.0%)
-- branch mispredict 3065558847064  #     0.6%
-- pipeline restart  1501480852801  #     0.3%
smt-contention       0              #  0.0% ( 0.0%)
cpu-cycles           345428388454584 # 2.51 GHz
instructions         122694459382065 # 0.36 IPC
l2 access            3480548081213  # 62.611 l2 access per 1000 inst
l2 miss              1791504627857  # 51.47% l2 miss