
Benchmarking an open source image manipulation program. You can see four different tests with slightly different profiles.
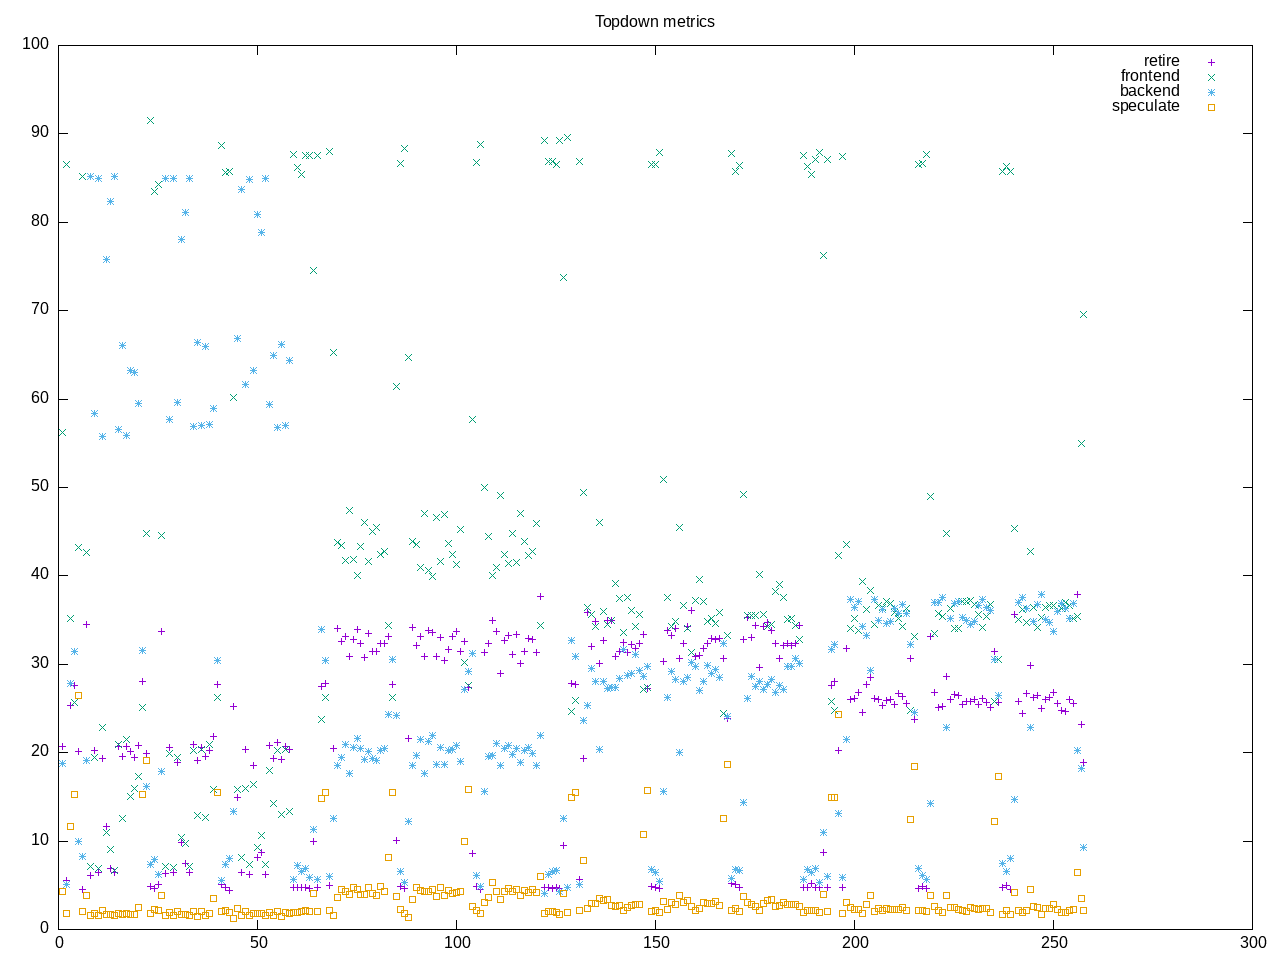
This looks like mostly a single-threaded program. This accounts for a low amount of on-cpu time. Somewhat branchy code with a moderate amount of floating point. Backend and particularly memory access seems to take largest share of time.
elapsed              262.274
on_cpu               0.121          # 1.94 / 16 cores
utime                366.606
stime                141.072
nvcsw                4489040        # 99.83%
nivcsw               7840           # 0.17%
inblock              262848         # 1002.19/sec
onblock              2932088        # 11179.48/sec
cpu-clock            504118685148   # 504.119 seconds
task-clock           505485321404   # 505.485 seconds
page faults          50883528       # 100662.721/sec
context switches     4497375        # 8897.143/sec
cpu migrations       10959          # 21.680/sec
major page faults    729            # 1.442/sec
minor page faults    50882799       # 100661.279/sec
alignment faults     0              # 0.000/sec
emulation faults     0              # 0.000/sec
branches             361656385246   # 143.514 branches per 1000 inst
branch misses        13952901330    # 3.86% branch miss
conditional          267322482059   # 106.080 conditional branches per 1000 inst
indirect             7525360183     # 2.986 indirect branches per 1000 inst
cpu-cycles           2188314398268  # 0.53 GHz
instructions         2509486134649  # 1.15 IPC
slots                4384834911768  #
retiring             844543083364   # 19.3% (20.6%)
-- ucode             2508221097     #     0.1%
-- fastpath          842034862267   #    19.2%
frontend             985978905389   # 22.5% (24.0%)
-- latency           717473756388   #    16.4%
-- bandwidth         268505149001   #     6.1%
backend              2164748146131  # 49.4% (52.7%)
-- cpu               542851638476   #    12.4%
-- memory            1621896507655  #    37.0%
speculation          113713583073   #  2.6% ( 2.8%)
-- branch mispredict 107823545927   #     2.5%
-- pipeline restart  5890037146     #     0.1%
smt-contention       275354088418   #  6.3% ( 0.0%)
cpu-cycles           2177473596639  # 0.53 GHz
instructions         2498720982907  # 1.15 IPC
instructions         833123582177   # 23.471 l2 access per 1000 inst
l2 hit from l1       14295187339    # 21.63% l2 miss
l2 miss from l1      1897261648     #
l2 hit from l2 pf    2926997800     #
l3 hit from l2 pf    808079008      #
l3 miss from l2 pf   1523752563     #
instructions         835136271658   # 168.563 float per 1000 inst
float 512            293            # 0.000 AVX-512 per 1000 inst
float 256            276            # 0.000 AVX-256 per 1000 inst
float 128            140773377324   # 168.563 AVX-128 per 1000 inst
float MMX            0              # 0.000 MMX per 1000 inst
float scalar         0              # 0.000 scalar per 1000 inst
Intel metrics
elapsed              323.082
on_cpu               0.131          # 2.10 / 16 cores
utime                531.315
stime                146.991
nvcsw                10503543       # 99.85%
nivcsw               15479          # 0.15%
inblock              8              # 0.02/sec
onblock              2931888        # 9074.76/sec
cpu-clock            670147573846   # 670.148 seconds
task-clock           671777403316   # 671.777 seconds
page faults          50351069       # 74952.013/sec
context switches     10519619       # 15659.382/sec
cpu migrations       30361          # 45.195/sec
major page faults    1              # 0.001/sec
minor page faults    50351068       # 74952.012/sec
alignment faults     0              # 0.000/sec
emulation faults     0              # 0.000/sec
branches             342678860344   # 135.988 branches per 1000 inst
branch misses        3385141914     # 0.99% branch miss
conditional          342679096184   # 135.988 conditional branches per 1000 inst
indirect             49044340836    # 19.463 indirect branches per 1000 inst
slots                6042017136368  #
retiring             2057791788255  # 34.1% (34.1%)
-- ucode             206973543335   #     3.4%
-- fastpath          1850818244920  #    30.6%
frontend             869596524785   # 14.4% (14.4%)
-- latency           441086010050   #     7.3%
-- bandwidth         428510514735   #     7.1%
backend              2531687347647  # 41.9% (41.9%)
-- cpu               625305575545   #    10.3%
-- memory            1906381772102  #    31.6%
speculation          609068467938   # 10.1% (10.1%)
-- branch mispredict 488700891743   #     8.1%
-- pipeline restart  120367576195   #     2.0%
smt-contention       0              #  0.0% ( 0.0%)
cpu-cycles           3264854609930  # 0.61 GHz
instructions         4152760303612  # 1.27 IPC
l2 access            47561932109    # 20.313 l2 access per 1000 inst
l2 miss              20055987975    # 42.17% l2 miss
The process profile has a large number of “worker” threads. These seem to be launched in parallel but not on the CPU at the same time.
7389 processes
	5580 worker                5202.05  1937.17
	420 gdbus                  348.48   129.47
	425 gmain                  348.39   129.44
	 36 gimp                   292.85    67.87
	 12 async                  292.80    67.83
	360 file-jpeg               53.88    61.30
	 12 bzip2                   11.24     0.14
	 12 async-ind                1.99     1.98
	 12 xz                       1.94     0.15
	 36 script-fu                1.62     0.24
	 38 vulkaninfo               0.75     1.14
	  6 glxinfo:gdrv0            0.09     0.07
	  6 php                      0.08     0.13
	  4 vulkani:disk$0           0.08     0.12
	  2 glxinfo                  0.06     0.03
	  2 glxinfo:cs0              0.05     0.03
	  2 glxinfo:disk$0           0.05     0.03
	  2 glxinfo:sh0              0.05     0.03
	  2 glxinfo:shlo0            0.05     0.03
	  2 llvmpipe-0               0.04     0.06
	  2 llvmpipe-1               0.04     0.06
	  2 llvmpipe-10              0.04     0.06
	  2 llvmpipe-11              0.04     0.06
	  2 llvmpipe-12              0.04     0.06
	  2 llvmpipe-13              0.04     0.06
	  2 llvmpipe-14              0.04     0.06
	  2 llvmpipe-15              0.04     0.06
	  2 llvmpipe-2               0.04     0.06
	  2 llvmpipe-3               0.04     0.06
	  2 llvmpipe-4               0.04     0.06
	  2 llvmpipe-5               0.04     0.06
	  2 llvmpipe-6               0.04     0.06
	  2 llvmpipe-7               0.04     0.06
	  2 llvmpipe-8               0.04     0.06
	  2 llvmpipe-9               0.04     0.06
	  6 clang                    0.03     0.07
	 12 rawtherapee              0.03     0.02
	 24 tar                      0.02     1.72
	 12 swap writer              0.00   292.80
	 12 [pango] FcInit           0.00     2.09
	  1 lspci                    0.00     0.03
	107 sh                       0.00     0.00
	 36 file-darktable           0.00     0.00
	 16 bash                     0.00     0.00
	 16 rm                       0.00     0.00
	 12 awk                      0.00     0.00
	 12 file-glob                0.00     0.00
	 12 file-heif                0.00     0.00
	 12 file-rawtherape          0.00     0.00
	 12 gcc                      0.00     0.00
	 12 head                     0.00     0.00
	  9 stty                     0.00     0.00
	  8 gsettings                0.00     0.00
	  8 stat                     0.00     0.00
	  8 systemd-detect-          0.00     0.00
	  6 llvm-link                0.00     0.00
	  5 phoronix-test-s          0.00     0.00
	  3 dconf worker             0.00     0.00
	  2 lscpu                    0.00     0.00
	  2 uname                    0.00     0.00
	  2 which                    0.00     0.00
	  2 xset                     0.00     0.00
	  1 cc                       0.00     0.00
	  1 date                     0.00     0.00
	  1 dirname                  0.00     0.00
	  1 dmesg                    0.00     0.00
	  1 dmidecode                0.00     0.00
	  1 grep                     0.00     0.00
	  1 ifconfig                 0.00     0.00
	  1 ip                       0.00     0.00
	  1 lsmod                    0.00     0.00
	  1 mktemp                   0.00     0.00
	  1 ps                       0.00     0.00
	  1 readlink                 0.00     0.00
	  1 realpath                 0.00     0.00
	  1 sed                      0.00     0.00
	  1 sort                     0.00     0.00
	  1 systemctl                0.00     0.00
	  1 template.sh              0.00     0.00
	  1 wc                       0.00     0.00
	  1 xrandr                   0.00     0.00