
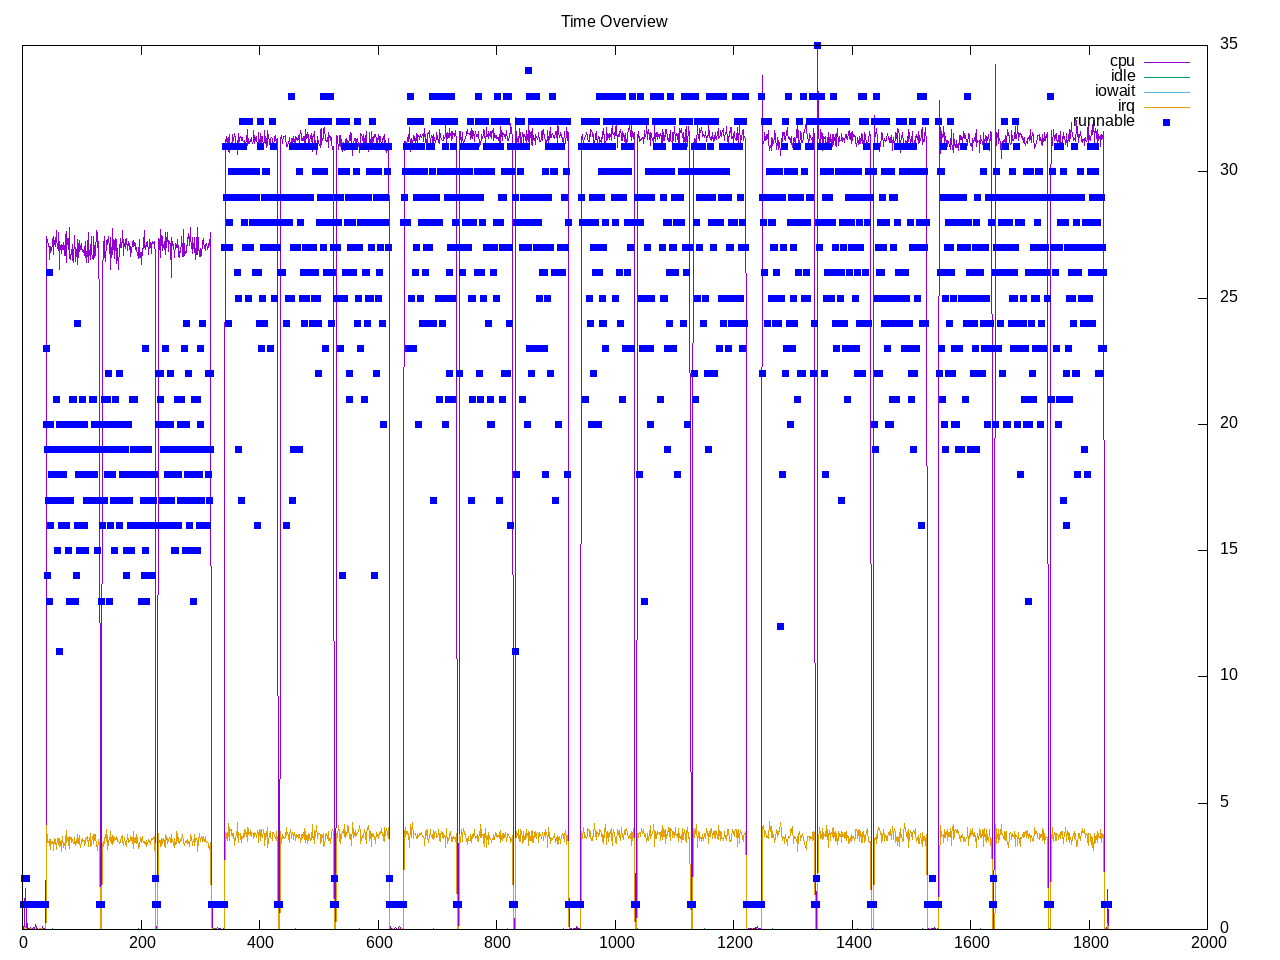
Benchmarks of the lightweight Nginx HTTP web server. Run with seven different configurations in terms of requests per second. The largest of these crashes on Intel. Depending on the workload, there is a steady stream of runnable processes and also a steady rate of interrupt processing.
Topdown profile shows a steady trend as clients increase. High frontend stalls and decreasing with lower backend stalls and increasing.
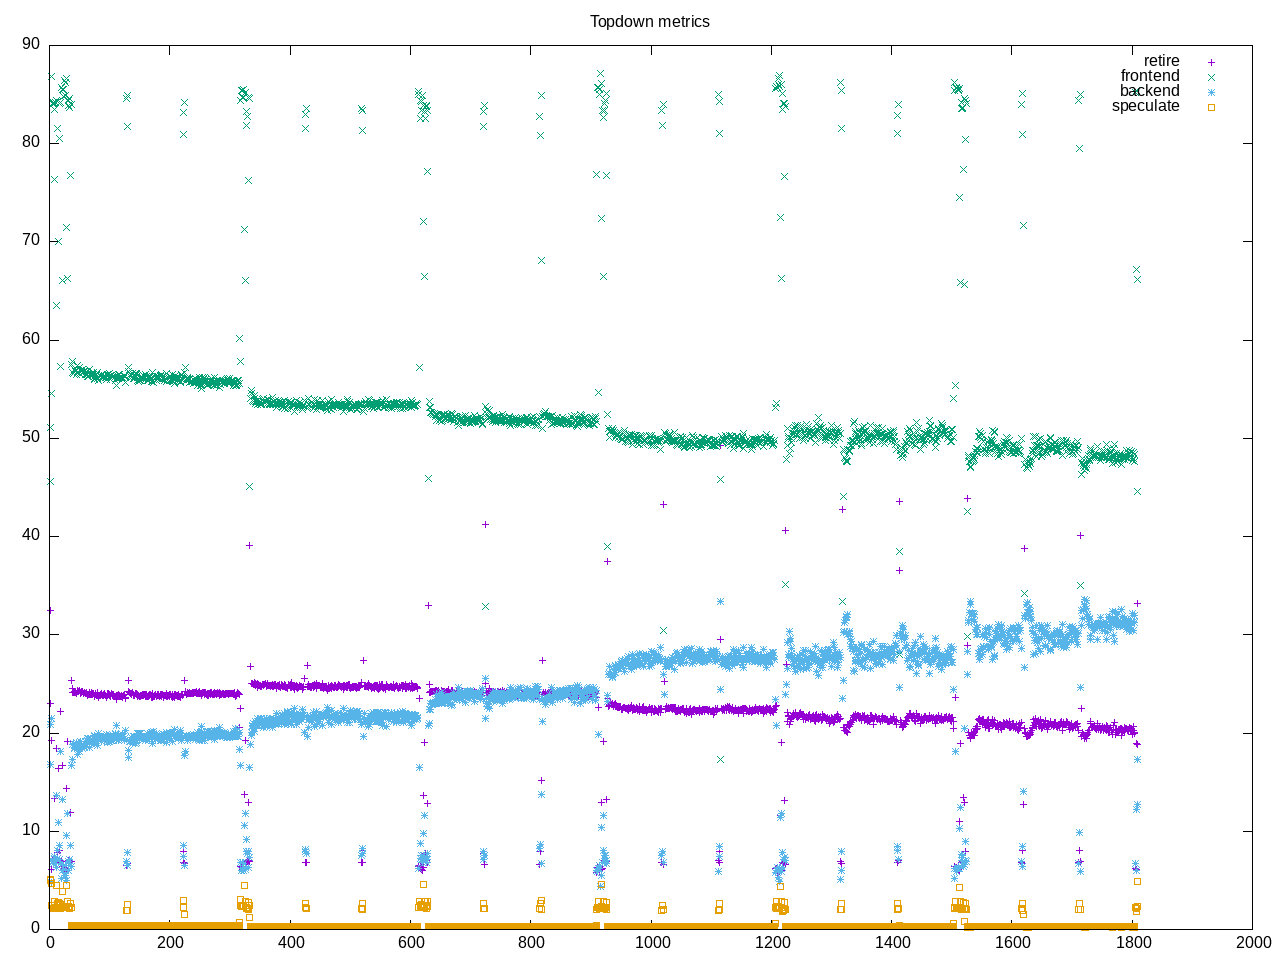
AMD metrics are now annotated with “high” and “low” markers for frontend stalls and speculation misses. Also surprising is the amount of floating point code for a web server?
elapsed              1809.766
on_cpu               0.353          # 5.66 / 16 cores
utime                5668.781
stime                4566.007
nvcsw                79619493       # 92.23%
nivcsw               6704051        # 7.77%
inblock              0              # 0.00/sec
onblock              23120          # 12.78/sec
cpu-clock            25121067020532 # 25121.067 seconds
task-clock           25136131034095 # 25136.131 seconds
page faults          461475         # 18.359/sec
context switches     120417664      # 4790.620/sec
cpu migrations       13566460       # 539.719/sec
major page faults    53             # 0.002/sec
minor page faults    461422         # 18.357/sec
alignment faults     0              # 0.000/sec
emulation faults     0              # 0.000/sec
branches             8640419338678  # 98.384 branches per 1000 inst
branch misses        650998923797   # 7.53% branch miss
conditional          4889857159745  # 55.679 conditional branches per 1000 inst
indirect             219843594998   # 2.503 indirect branches per 1000 inst
cpu-cycles           91450317493505 # 3.32 GHz
instructions         83227323814403 # 0.91 IPC
slots                182463323060250 #
retiring             35008217268307 # 19.2% (23.0%)
-- ucode             1779794881062  #     1.0%
-- fastpath          33228422387245 #    18.2%
frontend             78788810015191 # 43.2% (51.9%) high
-- latency           59787818345946 #    32.8%
-- bandwidth         19000991669245 #    10.4%
backend              37626343922638 # 20.6% (24.8%)
-- cpu               11254685932202 #     6.2%
-- memory            26371657990436 #    14.5%
speculation          489842005426   #  0.3% ( 0.3%) low
-- branch mispredict 488684516442   #     0.3%
-- pipeline restart  1157488984     #     0.0%
smt-contention       30542150588642 # 16.7% ( 0.0%)
cpu-cycles           97023657124856 # 3.36 GHz
instructions         87906505657257 # 0.91 IPC
instructions         29238541691844 # 98.502 l2 access per 1000 inst
l2 hit from l1       2171586154059  # 15.68% l2 miss
l2 miss from l1      223036763348   #
l2 hit from l2 pf    479881576660   #
l3 hit from l2 pf    191834413982   #
l3 miss from l2 pf   36744326249    #
instructions         29238116608759 # 675.701 float per 1000 inst
float 512            89             # 0.000 AVX-512 per 1000 inst
float 256            613            # 0.000 AVX-256 per 1000 inst
float 128            19756213607600 # 675.701 AVX-128 per 1000 inst
float MMX            0              # 0.000 MMX per 1000 inst
float scalar         0              # 0.000 scalar per 1000 inst
\Intel metrics
elapsed              1733.443
on_cpu               0.340          # 5.43 / 16 cores
utime                5028.702
stime                4388.764
nvcsw                95258431       # 91.83%
nivcsw               8471196        # 8.17%
inblock              747360         # 431.14/sec
onblock              11880          # 6.85/sec
cpu-clock            23833547986990 # 23833.548 seconds
task-clock           23845704074536 # 23845.704 seconds
page faults          484089         # 20.301/sec
context switches     143167975      # 6003.932/sec
cpu migrations       22678228       # 951.040/sec
major page faults    4188           # 0.176/sec
minor page faults    479900         # 20.125/sec
alignment faults     0              # 0.000/sec
emulation faults     0              # 0.000/sec
branches             7316456010829  # 87.723 branches per 1000 inst
branch misses        31563258634    # 0.43% branch miss
conditional          7316456043405  # 87.723 conditional branches per 1000 inst
indirect             1729108598933  # 20.732 indirect branches per 1000 inst
slots                99211728596570 #
retiring             52293353050524 # 52.7% (52.7%)
-- ucode             6304853099248  #     6.4%
-- fastpath          45988499951276 #    46.4%
frontend             28850239834340 # 29.1% (29.1%)
-- latency           14975518404750 #    15.1%
-- bandwidth         13874721429590 #    14.0%
backend              16068350018892 # 16.2% (16.2%) low
-- cpu               5117974323048  #     5.2%
-- memory            10950375695844 #    11.0%
speculation          1873177440460  #  1.9% ( 1.9%)
-- branch mispredict 1508068627405  #     1.5%
-- pipeline restart  365108813055   #     0.4%
smt-contention       0              #  0.0% ( 0.0%)
cpu-cycles           69513696338102 # 2.52 GHz
instructions         100793724736328 # 1.45 IPC
l2 access            3769634327220  # 75.954 l2 access per 1000 inst
l2 miss              598194587854   # 15.87% l2 miss
Process tree has a steady stream of processes and fewer than I would expect with many clients. I wonder if these are somehow forked off to a different tree and this is only the core server remaining?
903 processes
	340 wrk                  96747.17 75918.65
	156 nginx                 6933.80  8023.21
	 68 clinfo                  19.83     6.66
	 38 vulkaninfo               1.14     1.52
	  6 glxinfo:gdrv0            0.17     0.05
	  6 glxinfo:gl0              0.17     0.05
	  6 php                      0.12     0.33
	  4 vulkani:disk$0           0.12     0.16
	  2 glxinfo                  0.07     0.03
	  2 glxinfo:cs0              0.07     0.03
	  2 glxinfo:disk$0           0.07     0.03
	  2 glxinfo:sh0              0.07     0.03
	  2 glxinfo:shlo0            0.07     0.03
	  2 llvmpipe-0               0.06     0.08
	  2 llvmpipe-1               0.06     0.08
	  2 llvmpipe-10              0.06     0.08
	  2 llvmpipe-11              0.06     0.08
	  2 llvmpipe-12              0.06     0.08
	  2 llvmpipe-13              0.06     0.08
	  2 llvmpipe-14              0.06     0.08
	  2 llvmpipe-15              0.06     0.08
	  2 llvmpipe-2               0.06     0.08
	  2 llvmpipe-3               0.06     0.08
	  2 llvmpipe-4               0.06     0.08
	  2 llvmpipe-5               0.06     0.08
	  2 llvmpipe-6               0.06     0.08
	  2 llvmpipe-7               0.06     0.08
	  2 llvmpipe-8               0.06     0.08
	  2 llvmpipe-9               0.06     0.08
	  6 clang                    0.06     0.06
	  3 rocminfo                 0.03     0.00
	  1 lspci                    0.01     0.02
	106 sh                       0.00     0.00
	 14 bash                     0.00     0.00
	 14 sleep                    0.00     0.00
	 13 gcc                      0.00     0.00
	  9 gsettings                0.00     0.00
	  8 stat                     0.00     0.00
	  8 systemd-detect-          0.00     0.00
	  7 rm                       0.00     0.00
	  6 llvm-link                0.00     0.00
	  5 phoronix-test-s          0.00     0.00
	  4 gmain                    0.00     0.00
	  3 dconf worker             0.00     0.00
	  2 cc                       0.00     0.00
	  2 lscpu                    0.00     0.00
	  2 uname                    0.00     0.00
	  2 which                    0.00     0.00
	  2 xset                     0.00     0.00
	  1 date                     0.00     0.00
	  1 dirname                  0.00     0.00
	  1 dmesg                    0.00     0.00
	  1 dmidecode                0.00     0.00
	  1 grep                     0.00     0.00
	  1 ifconfig                 0.00     0.00
	  1 ip                       0.00     0.00
	  1 lsmod                    0.00     0.00
	  1 mktemp                   0.00     0.00
	  1 ps                       0.00     0.00
	  1 qdbus                    0.00     0.00
	  1 readlink                 0.00     0.00
	  1 realpath                 0.00     0.00
	  1 sed                      0.00     0.00
	  1 sort                     0.00     0.00
	  1 stty                     0.00     0.00
	  1 systemctl                0.00     0.00
	  1 template.sh              0.00     0.00
	  1 wc                       0.00     0.00
	  1 xrandr                   0.00     0.00
0 processes running
47 maximum processes
An example of the structure
      938801) sh               cpu=13 start=4.03  finish=9.04
        938802) bash             cpu=13 start=4.03  finish=9.04
          938803) nginx            cpu=7 start=4.03  finish=4.03
            938804) nginx            cpu=4 start=4.03  finish=19.08
              938805) nginx            cpu=5 start=4.03  finish=19.08
              938806) nginx            cpu=8 start=4.03  finish=19.08
              938807) nginx            cpu=10 start=4.03  finish=19.08
              938808) nginx            cpu=6 start=4.04  finish=19.08
              938810) nginx            cpu=15 start=4.04  finish=19.08
              938811) nginx            cpu=4 start=4.04  finish=19.08
              938812) nginx            cpu=14 start=4.04  finish=19.08
              938813) nginx            cpu=13 start=4.04  finish=19.08
              938814) nginx            cpu=2 start=4.04  finish=19.08
              938815) nginx            cpu=7 start=4.04  finish=19.08
              938816) nginx            cpu=9 start=4.04  finish=19.08
              938817) nginx            cpu=11 start=4.04  finish=19.08
              938818) nginx            cpu=12 start=4.04  finish=19.08
              938819) nginx            cpu=0 start=4.04  finish=19.08
              938820) nginx            cpu=1 start=4.04  finish=19.08
              938821) nginx            cpu=3 start=4.04  finish=19.08
          938809) sleep            cpu=7 start=4.04  finish=9.04