
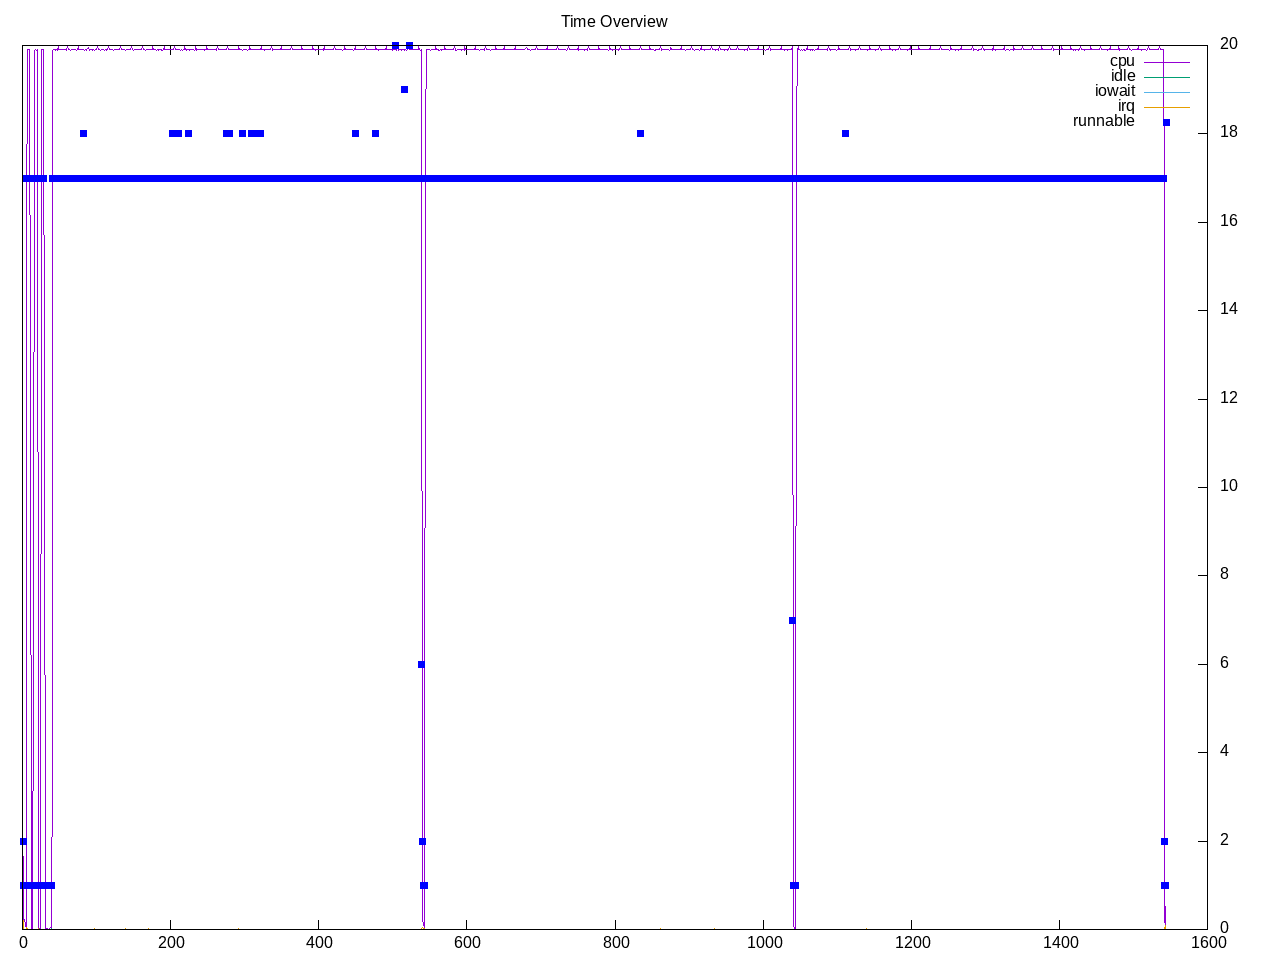
The helsing benchmark computes Vampire Numbers. There are two workloads: one for 12 digits and one for 14 digits with almost all the time going to the later. The second workload seems to run consistently on all cores.
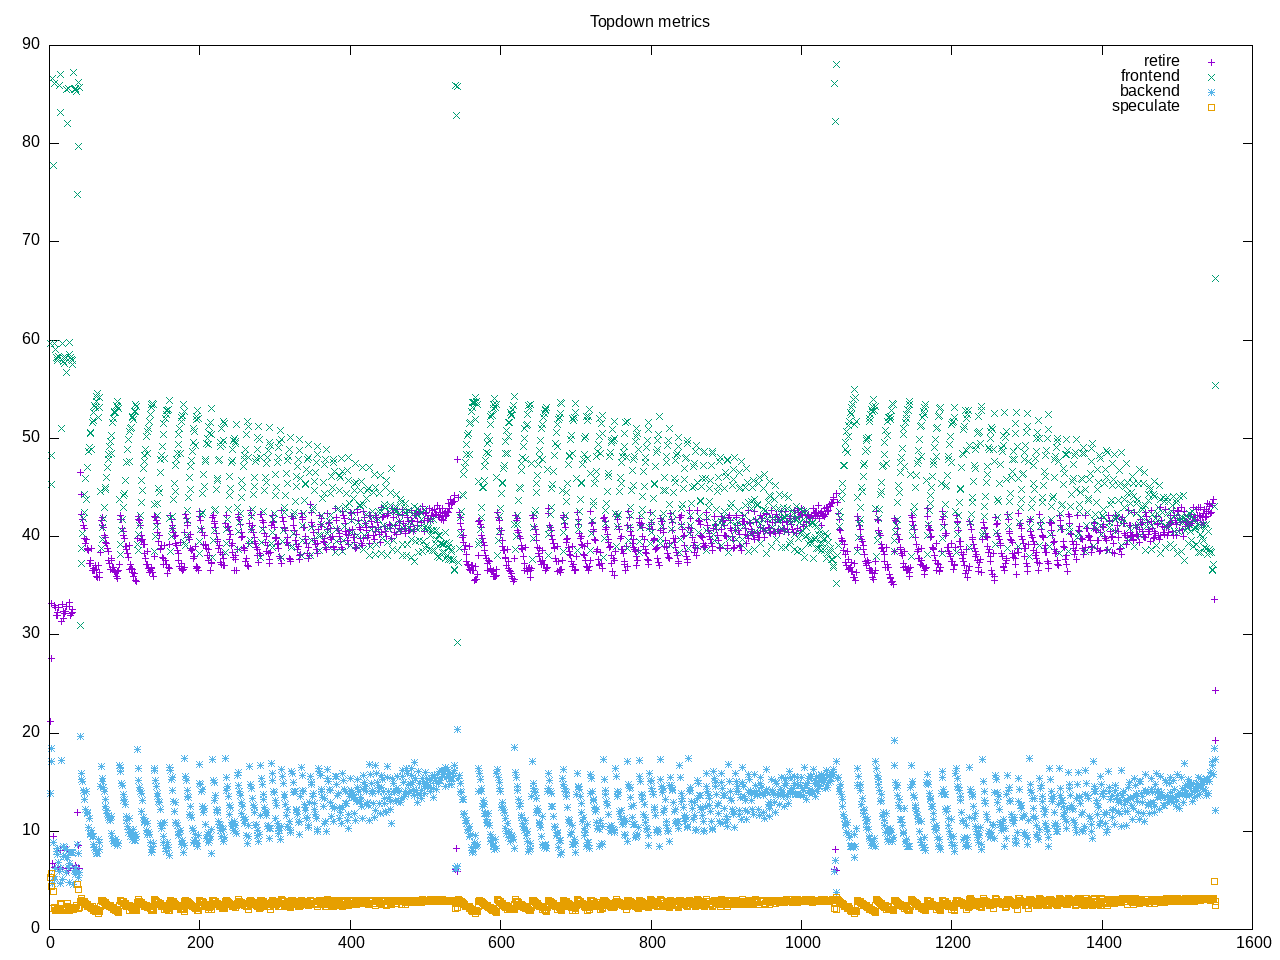
Topdown profile shows frontend stalls dominating with a reasonably high retirement rate.
AMD metrics show little floating point. There is a high L2 access rate with few L2 misses.
elapsed              1544.288
on_cpu               0.977          # 15.64 / 16 cores
utime                24144.861
stime                5.900
nvcsw                2209           # 1.07%
nivcsw               203297         # 98.93%
inblock              8              # 0.01/sec
onblock              12760          # 8.26/sec
cpu-clock            24151759949628 # 24151.760 seconds
task-clock           24151872221780 # 24151.872 seconds
page faults          686457         # 28.423/sec
context switches     213041         # 8.821/sec
cpu migrations       309            # 0.013/sec
major page faults    2              # 0.000/sec
minor page faults    686455         # 28.422/sec
alignment faults     0              # 0.000/sec
emulation faults     0              # 0.000/sec
branches             37996374962268 # 213.248 branches per 1000 inst
branch misses        426355218797   # 1.12% branch miss
conditional          37900334306940 # 212.709 conditional branches per 1000 inst
indirect             1414195149     # 0.008 indirect branches per 1000 inst
cpu-cycles           93192585501105 # 3.76 GHz
instructions         178220525834252 # 1.91 IPC
slots                186374372514954 #
retiring             54534867291655 # 29.3% (39.7%)
-- ucode             602790653      #     0.0%
-- fastpath          54534264501002 #    29.3%
frontend             62137799188459 # 33.3% (45.2%) high
-- latency           33686540498436 #    18.1%
-- bandwidth         28451258690023 #    15.3%
backend              17152720336039 #  9.2% (12.5%) low
-- cpu               1227200586083  #     0.7%
-- memory            15925519749956 #     8.5%
speculation          3537961598501  #  1.9% ( 2.6%)
-- branch mispredict 3526283395770  #     1.9%
-- pipeline restart  11678202731    #     0.0%
smt-contention       49010830482301 # 26.3% ( 0.0%)
cpu-cycles           93281791687407 # 3.76 GHz
instructions         178199946791830 # 1.91 IPC
instructions         59402683308294 # 199.834 l2 access per 1000 inst
l2 hit from l1       6701172480876  # 0.11% l2 miss
l2 miss from l1      6682864116     #
l2 hit from l2 pf    5163093205308  #
l3 hit from l2 pf    3420115358     #
l3 miss from l2 pf   3018255728     #
instructions         59385720242127 # 1.468 float per 1000 inst
float 512            46             # 0.000 AVX-512 per 1000 inst
float 256            434            # 0.000 AVX-256 per 1000 inst
float 128            87181981843    # 1.468 AVX-128 per 1000 inst
float MMX            0              # 0.000 MMX per 1000 inst
float scalar         0              # 0.000 scalar per 1000 inst
instructions         2648516        #
opcache              975479         # 368.312 opcache per 1000 inst
opcache miss         522758         # 53.6% opcache miss rate
l1 dTLB miss         5395           # 2.037 L1 dTLB per 1000 inst
l2 dTLB miss         1159           # 0.438 L2 dTLB per 1000 inst
instructions         2722566        #
icache               1311083        # 481.562 icache per 1000 inst
icache miss          112185         #  8.6% icache miss rate
l1 iTLB miss         11             # 0.004 L1 iTLB per 1000 inst
l2 iTLB miss         0              # 0.000 L2 iTLB per 1000 inst
tlb flush            19             # 0.007 TLB flush per 1000 inst
Intel metrics
elapsed              2195.089
on_cpu               0.983          # 15.73 / 16 cores
utime                34523.529
stime                3.532
nvcsw                5708           # 2.26%
nivcsw               247340         # 97.74%
inblock              736504         # 335.52/sec
onblock              1520           # 0.69/sec
cpu-clock            34527696384921 # 34527.696 seconds
task-clock           34527759388483 # 34527.759 seconds
page faults          694041         # 20.101/sec
context switches     263807         # 7.640/sec
cpu migrations       329            # 0.010/sec
major page faults    4046           # 0.117/sec
minor page faults    689995         # 19.984/sec
alignment faults     0              # 0.000/sec
emulation faults     0              # 0.000/sec
branches             37995215477051 # 213.238 branches per 1000 inst
branch misses        554926384677   # 1.46% branch miss
conditional          37995215494459 # 213.238 conditional branches per 1000 inst
indirect             7321841704743  # 41.092 indirect branches per 1000 inst
slots                157759917459068 #
retiring             93941253151823 # 59.5% (59.5%) high
-- ucode             587027031054   #     0.4%
-- fastpath          93354226120769 #    59.2%
frontend             27064981185513 # 17.2% (17.2%)
-- latency           7967772793571  #     5.1%
-- bandwidth         19097208391942 #    12.1%
backend              8761522150341  #  5.6% ( 5.6%) low
-- cpu               7775846235503  #     4.9%
-- memory            985675914838   #     0.6%
speculation          28702420410020 # 18.2% (18.2%) high
-- branch mispredict 28702222069505 #    18.2%
-- pipeline restart  198340515      #     0.0%
smt-contention       0              #  0.0% ( 0.0%)
cpu-cycles           86412475211325 # 2.47 GHz
instructions         192985063456344 # 2.23 IPC
l2 access            7513647170631  # 63.938 l2 access per 1000 inst
l2 miss              49651416890    # 0.66% l2 miss
cpu-cycles           52549088264933 # 13.4% memory latency
load stalls          7024140040104  #  0.0% l1 bound
l1 miss              31270895567874 # 57.1% l2 bound
l2 miss              1284758476766  #  0.7% l3 bound
l3 miss              929695149808   #  1.8% dram bound
store_stalls         782090312      #  0.0% store bound
Process overview shows the helsing process taking the most time.
458 processes
	108 helsing              411130.16    82.11
	 68 clinfo                  16.22     6.64
	 38 vulkaninfo               1.14     1.14
	  6 php                      0.17     0.10
	  6 glxinfo:gdrv0            0.13     0.07
	  4 vulkani:disk$0           0.12     0.12
	  6 glxinfo:gl0              0.12     0.06
	  6 clang                    0.07     0.05
	  2 glxinfo                  0.07     0.03
	  2 glxinfo:cs0              0.07     0.03
	  2 glxinfo:disk$0           0.07     0.03
	  2 glxinfo:sh0              0.07     0.03
	  2 glxinfo:shlo0            0.07     0.03
	  2 llvmpipe-0               0.06     0.06
	  2 llvmpipe-1               0.06     0.06
	  2 llvmpipe-10              0.06     0.06
	  2 llvmpipe-11              0.06     0.06
	  2 llvmpipe-12              0.06     0.06
	  2 llvmpipe-13              0.06     0.06
	  2 llvmpipe-14              0.06     0.06
	  2 llvmpipe-15              0.06     0.06
	  2 llvmpipe-2               0.06     0.06
	  2 llvmpipe-3               0.06     0.06
	  2 llvmpipe-4               0.06     0.06
	  2 llvmpipe-5               0.06     0.06
	  2 llvmpipe-6               0.06     0.06
	  2 llvmpipe-7               0.06     0.06
	  2 llvmpipe-8               0.06     0.06
	  2 llvmpipe-9               0.06     0.06
	  3 rocminfo                 0.03     0.00
	  1 lspci                    0.00     0.02
	 84 sh                       0.00     0.00
	 13 gcc                      0.00     0.00
	 12 gsettings                0.00     0.00
	  8 stat                     0.00     0.00
	  8 systemd-detect-          0.00     0.00
	  6 llvm-link                0.00     0.00
	  5 phoronix-test-s          0.00     0.00
	  3 gmain                    0.00     0.00
	  2 cc                       0.00     0.00
	  2 lscpu                    0.00     0.00
	  2 uname                    0.00     0.00
	  2 which                    0.00     0.00
	  2 xset                     0.00     0.00
	  1 date                     0.00     0.00
	  1 dconf worker             0.00     0.00
	  1 dirname                  0.00     0.00
	  1 dmesg                    0.00     0.00
	  1 dmidecode                0.00     0.00
	  1 grep                     0.00     0.00
	  1 ifconfig                 0.00     0.00
	  1 ip                       0.00     0.00
	  1 lsmod                    0.00     0.00
	  1 mktemp                   0.00     0.00
	  1 ps                       0.00     0.00
	  1 qdbus                    0.00     0.00
	  1 readlink                 0.00     0.00
	  1 realpath                 0.00     0.00
	  1 sed                      0.00     0.00
	  1 sort                     0.00     0.00
	  1 stty                     0.00     0.00
	  1 systemctl                0.00     0.00
	  1 template.sh              0.00     0.00
	  1 wc                       0.00     0.00
	  1 xrandr                   0.00     0.00
0 processes running
47 maximum processes
Computation structure is straightforward.
      233808) helsing          cpu=4 start=14.92 finish=20.30
        233809) helsing          cpu=13 start=14.93 finish=20.30
          233810) helsing          cpu=6 start=14.93 finish=20.23
          233811) helsing          cpu=15 start=14.93 finish=20.30
          233812) helsing          cpu=2 start=14.93 finish=20.23
          233813) helsing          cpu=0 start=14.93 finish=20.24
          233814) helsing          cpu=1 start=14.93 finish=20.20
          233815) helsing          cpu=3 start=14.93 finish=20.24
          233816) helsing          cpu=4 start=14.93 finish=20.21
          233817) helsing          cpu=5 start=14.93 finish=20.26
          233818) helsing          cpu=8 start=14.93 finish=20.29
          233819) helsing          cpu=7 start=14.93 finish=20.26
          233820) helsing          cpu=10 start=14.93 finish=20.25
          233821) helsing          cpu=14 start=14.93 finish=20.27
          233822) helsing          cpu=11 start=14.93 finish=20.23
          233823) helsing          cpu=9 start=14.93 finish=20.21
          233824) helsing          cpu=12 start=14.93 finish=20.23
          233825) helsing          cpu=13 start=14.93 finish=20.21