
An open-source in-memory data structure store. This tries to run up to 15 benchmarks but on AMD I have the following with errors saying they don’t run
- pts/redis-1.4.0: Test: GET - Parallel Connections: 50
- pts/redis-1.4.0: Test: SET - Parallel Connections: 50
- pts/redis-1.4.0: Test: GET - Parallel Connections: 500
- pts/redis-1.4.0: Test: LPOP - Parallel Connections: 50
- pts/redis-1.4.0: Test: SADD - Parallel Connections: 50
- pts/redis-1.4.0: Test: SET - Parallel Connections: 500
- pts/redis-1.4.0: Test: LPOP - Parallel Connections: 500
- pts/redis-1.4.0: Test: LPUSH - Parallel Connections: 50
- pts/redis-1.4.0: Test: SADD - Parallel Connections: 500
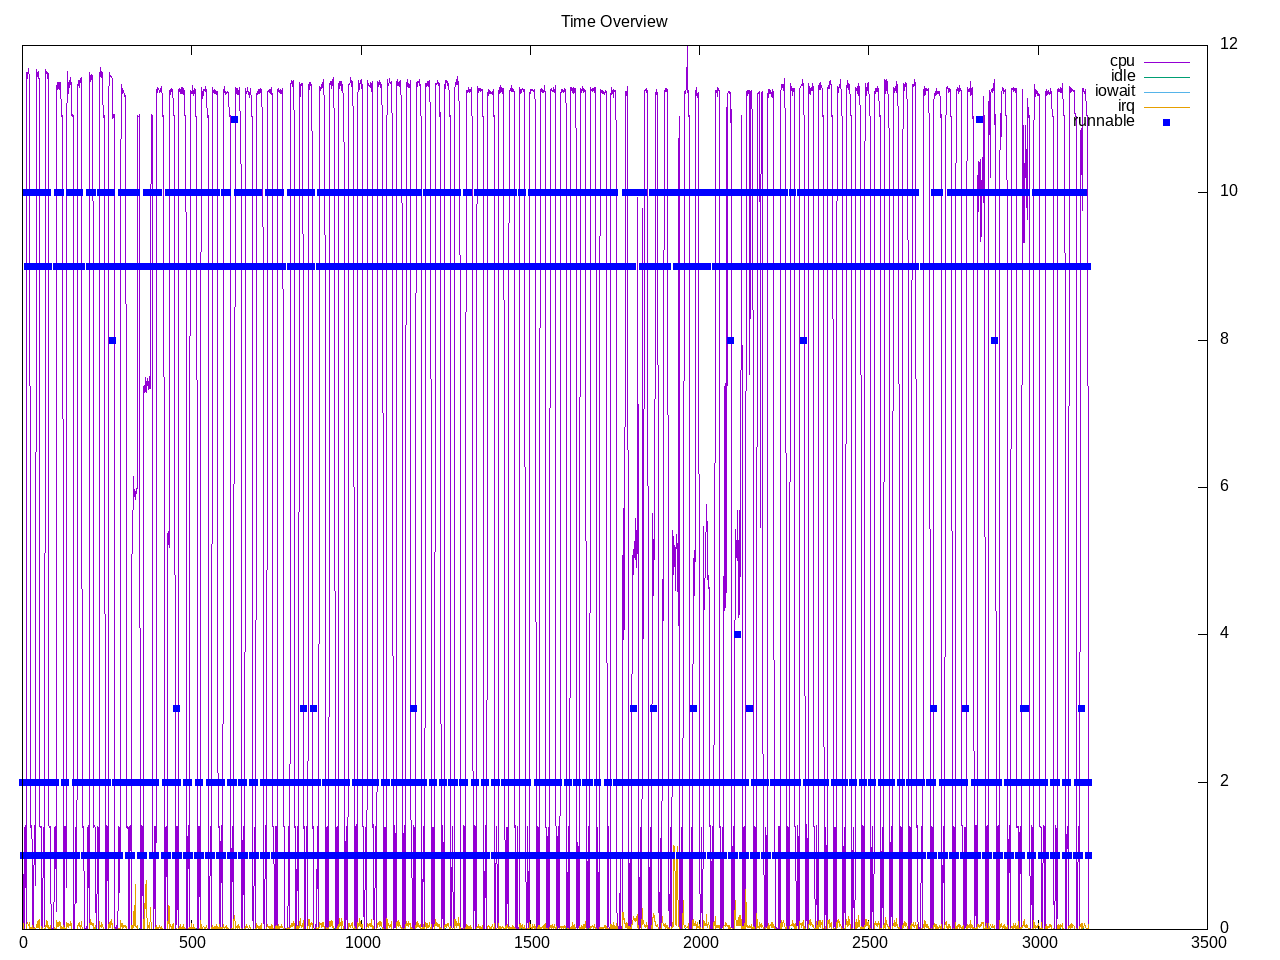
- pts/redis-1.4.0: Test: LPUSH - Parallel Connections: 500On Intel the entire process crashes with out of memory killer, even taking the controlling terminal with it as well. So this is a good benchmark to drill on a system with enough memory/swap and see what the actual demand are. These tests have up to 50 concurrent requests, though interesting to see the maximum number of cores used is closer to 10.
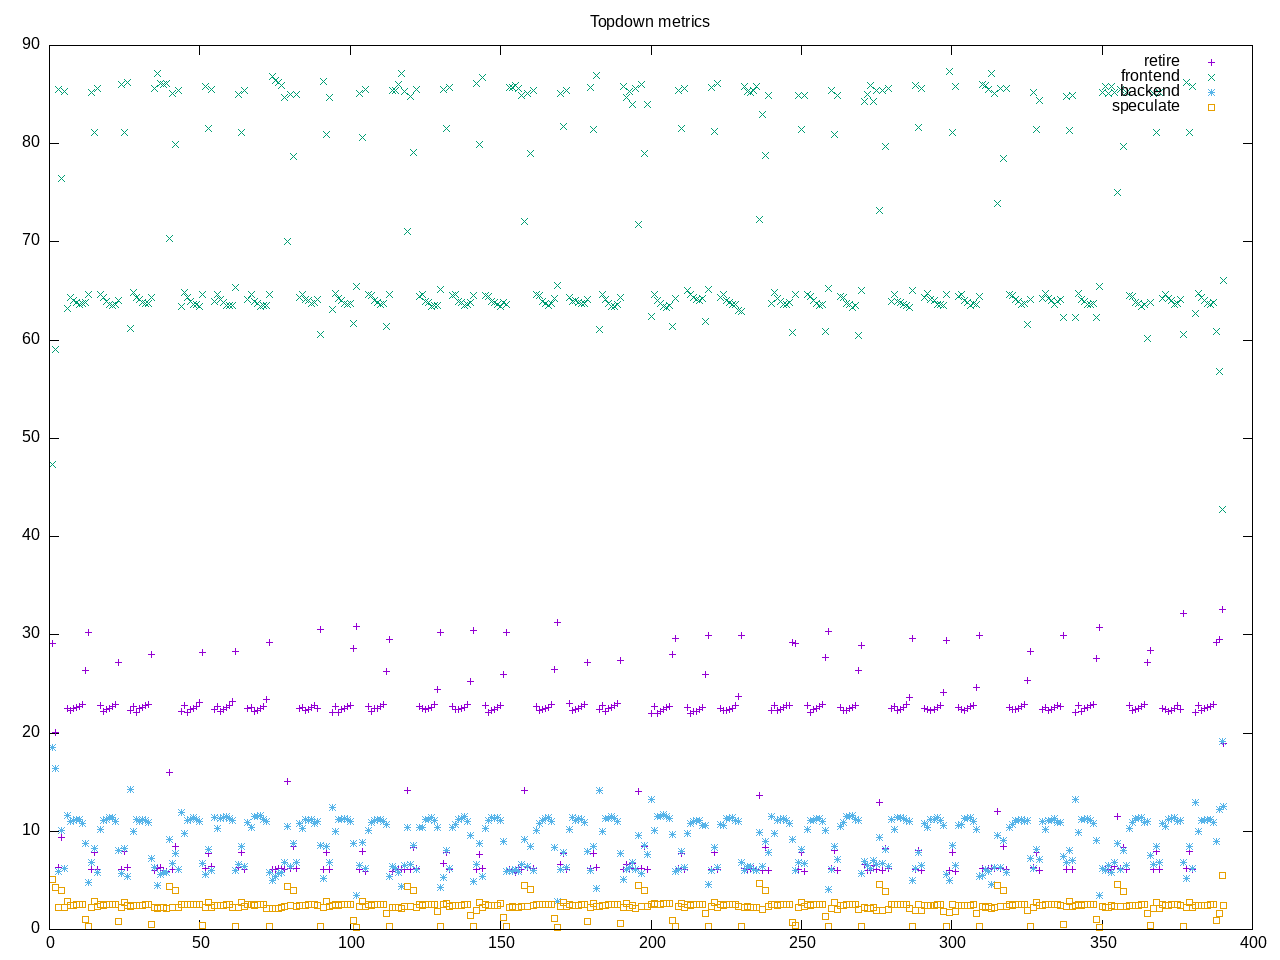
Topdown profile shows highest amounts with frontend stalls. Curiously backend is lower, so must be going directly to memory?
AMD metrics suggest this isn’t a compute benchmark with only 0.15 cores used. Even the L2 miss rate isn’t as high as I expected. There are however many page faults and a very high number of branches.
elapsed              2259.922
on_cpu               0.010          # 0.15 / 16 cores
utime                268.567
stime                78.932
nvcsw                162118         # 92.74%
nivcsw               12692          # 7.26%
inblock              0              # 0.00/sec
onblock              16216          # 7.18/sec
cpu-clock            10122237671248 # 10122.238 seconds
task-clock           10122558791444 # 10122.559 seconds
page faults          193723516      # 19137.801/sec
context switches     355145         # 35.085/sec
cpu migrations       10120          # 1.000/sec
major page faults    2              # 0.000/sec
minor page faults    193723514      # 19137.801/sec
alignment faults     0              # 0.000/sec
emulation faults     0              # 0.000/sec
branches             77198022469055 # 373.947 branches per 1000 inst
branch misses        46781194640    # 0.06% branch miss
conditional          75399169886602 # 365.233 conditional branches per 1000 inst
indirect             266512608553   # 1.291 indirect branches per 1000 inst
cpu-cycles           70964703660624 # 1.33 GHz
instructions         314901062257201 # 4.44 IPC high
slots                141976486254930 #
retiring             68709077340669 # 48.4% (49.6%)
-- ucode             24903181428    #     0.0%
-- fastpath          68684174159241 #    48.4%
frontend             10851835723585 #  7.6% ( 7.8%)
-- latency           6110657230428  #     4.3%
-- bandwidth         4741178493157  #     3.3%
backend              58757120586209 # 41.4% (42.4%)
-- cpu               12458026094976 #     8.8%
-- memory            46299094491233 #    32.6%
speculation          247109410646   #  0.2% ( 0.2%) low
-- branch mispredict 244955058544   #     0.2%
-- pipeline restart  2154352102     #     0.0%
smt-contention       3411236551070  #  2.4% ( 0.0%)
cpu-cycles           939713831540   # 0.15 GHz
instructions         1079058399556  # 1.15 IPC
instructions         360259392636   # 44.335 l2 access per 1000 inst
l2 hit from l1       13251426351    # 12.57% l2 miss
l2 miss from l1      534270581      #
l2 hit from l2 pf    1247616791     #
l3 hit from l2 pf    84447007       #
l3 miss from l2 pf   1388497154     #
instructions         359931132234   # 19.095 float per 1000 inst
float 512            111            # 0.000 AVX-512 per 1000 inst
float 256            624            # 0.000 AVX-256 per 1000 inst
float 128            6872979115     # 19.095 AVX-128 per 1000 inst
float MMX            0              # 0.000 MMX per 1000 inst
float scalar         0              # 0.000 scalar per 1000 inst
This is not running reliably on Intel. In particular, it crashes the running terminal. Looking at syslog I see OOM out of memory errors. Initially it got through many of the cases for 1000 simultaneous but eventually it crashes even when configured with 50 requests. This system has 16Gb of memory. Below are partial metrics when I was able to collect topdown for a run (it crashed on IPC so didn’t get that)
slots                272335914937490 #
retiring             142603219927690 # 52.4% (52.4%)
-- ucode             4271167488209  #     1.6%
-- fastpath          138332052439481 #    50.8%
frontend             66038620923890 # 24.2% (24.2%)
-- latency           7911569467471  #     2.9%
-- bandwidth         58127051456419 #    21.3%
backend              61775042796876 # 22.7% (22.7%)
-- cpu               55815826753567 #    20.5%
-- memory            5959216043309  #     2.2%
speculation          1837174312495  #  0.7% ( 0.7%) low
-- branch mispredict 1244841407692  #     0.5%
-- pipeline restart  592332904803   #     0.2%
smt-contention       0              #  0.0% ( 0.0%)
The process profile also has fewer processes than I expected
796 processes
	 30 bio_aof_fsync           50.40   137.14
	 30 bio_close_file          50.40   137.14
	 30 bio_lazy_free           50.40   137.14
	 30 io_thd_1                50.40   137.14
	 30 io_thd_2                50.40   137.14
	 30 io_thd_3                50.40   137.14
	 30 io_thd_4                50.40   137.14
	 30 io_thd_5                50.40   137.14
	 30 io_thd_6                50.40   137.14
	 30 io_thd_7                50.40   137.14
	 30 redis-server            50.40   137.14
	 68 clinfo                  16.20     6.66
	 38 vulkaninfo               1.13     1.14
	  6 glxinfo:gdrv0            0.15     0.00
	  6 glxinfo:gl0              0.15     0.00
	  4 vulkani:disk$0           0.12     0.12
	  6 php                      0.11     0.19
	  2 glxinfo                  0.08     0.00
	  2 glxinfo:cs0              0.07     0.00
	  2 glxinfo:disk$0           0.07     0.00
	  2 glxinfo:sh0              0.07     0.00
	  2 glxinfo:shlo0            0.07     0.00
	  6 clang                    0.06     0.06
	  2 llvmpipe-0               0.06     0.06
	  2 llvmpipe-1               0.06     0.06
	  2 llvmpipe-10              0.06     0.06
	  2 llvmpipe-11              0.06     0.06
	  2 llvmpipe-12              0.06     0.06
	  2 llvmpipe-13              0.06     0.06
	  2 llvmpipe-14              0.06     0.06
	  2 llvmpipe-15              0.06     0.06
	  2 llvmpipe-2               0.06     0.06
	  2 llvmpipe-3               0.06     0.06
	  2 llvmpipe-4               0.06     0.06
	  2 llvmpipe-5               0.06     0.06
	  2 llvmpipe-6               0.06     0.06
	  2 llvmpipe-7               0.06     0.06
	  2 llvmpipe-8               0.06     0.06
	  2 llvmpipe-9               0.06     0.06
	  3 rocminfo                 0.03     0.00
	 30 redis-benchmark          0.00     0.35
	  1 lspci                    0.00     0.02
	  1 ps                       0.00     0.01
	 80 sh                       0.00     0.00
	 31 sed                      0.00     0.00
	 30 redis                    0.00     0.00
	 30 sleep                    0.00     0.00
	 13 gcc                      0.00     0.00
	  9 gsettings                0.00     0.00
	  8 stat                     0.00     0.00
	  8 systemd-detect-          0.00     0.00
	  6 llvm-link                0.00     0.00
	  5 gmain                    0.00     0.00
	  5 phoronix-test-s          0.00     0.00
	  2 cc                       0.00     0.00
	  2 dconf worker             0.00     0.00
	  2 lscpu                    0.00     0.00
	  2 uname                    0.00     0.00
	  2 which                    0.00     0.00
	  2 xset                     0.00     0.00
	  1 date                     0.00     0.00
	  1 dirname                  0.00     0.00
	  1 dmesg                    0.00     0.00
	  1 dmidecode                0.00     0.00
	  1 grep                     0.00     0.00
	  1 ifconfig                 0.00     0.00
	  1 ip                       0.00     0.00
	  1 lsmod                    0.00     0.00
	  1 mktemp                   0.00     0.00
	  1 qdbus                    0.00     0.00
	  1 readlink                 0.00     0.00
	  1 realpath                 0.00     0.00
	  1 sort                     0.00     0.00
	  1 stty                     0.00     0.00
	  1 systemctl                0.00     0.00
	  1 template.sh              0.00     0.00
	  1 wc                       0.00     0.00
	  1 xrandr                   0.00     0.00
0 processes running
47 maximum processes
The computation blocks also look straightforward
      963332) redis            cpu=5 start=5.22  finish=11.35
        963333) redis-server     cpu=2 start=5.22  finish=11.41
          963335) bio_close_file   cpu=8 start=5.22  finish=11.41
          963336) bio_aof_fsync    cpu=7 start=5.22  finish=11.41
          963337) bio_lazy_free    cpu=4 start=5.22  finish=11.41
          963338) io_thd_1         cpu=10 start=5.22  finish=11.41
          963339) io_thd_2         cpu=6 start=5.22  finish=11.41
          963340) io_thd_3         cpu=5 start=5.22  finish=11.41
          963341) io_thd_4         cpu=11 start=5.22  finish=11.41
          963342) io_thd_5         cpu=0 start=5.22  finish=11.41
          963343) io_thd_6         cpu=12 start=5.22  finish=11.41
          963344) io_thd_7         cpu=13 start=5.22  finish=11.41
        963334) sleep            cpu=11 start=5.22  finish=11.22
        963345) redis-benchmark  cpu=6 start=11.22 finish=11.34
        963346) sed              cpu=1 start=11.35 finish=11.35
In summary, this seems like a workload to better characterize with different analysis. I have some of that in the exit lines for the various processes -and good follow up would be to see what to decorate the tree with, e.g.
- virtual memory size
- resident size
Here for example is a block after I have added a -M option to proctree to print the virtual memory size:
      963597) redis            cpu=10 start=222.03 finish=228.57 vmsize=2896k
        963598) redis-server     cpu=3 start=222.03 finish=228.61 vmsize=1923576k
          963600) bio_close_file   cpu=14 start=222.04 finish=228.61 vmsize=1923576k
          963601) bio_aof_fsync    cpu=7 start=222.04 finish=228.61 vmsize=1923576k
          963602) bio_lazy_free    cpu=0 start=222.04 finish=228.61 vmsize=1923576k
          963603) io_thd_1         cpu=12 start=222.04 finish=228.61 vmsize=1923576k
          963604) io_thd_2         cpu=10 start=222.04 finish=228.61 vmsize=1923576k
          963605) io_thd_3         cpu=13 start=222.04 finish=228.61 vmsize=1923576k
          963606) io_thd_4         cpu=6 start=222.04 finish=228.61 vmsize=1923576k
          963607) io_thd_5         cpu=15 start=222.04 finish=228.61 vmsize=1923576k
          963608) io_thd_6         cpu=4 start=222.04 finish=228.61 vmsize=1923576k
          963609) io_thd_7         cpu=8 start=222.04 finish=228.61 vmsize=1923576k
        963599) sleep            cpu=13 start=222.03 finish=228.03 vmsize=8376k
        963610) redis-benchmark  cpu=12 start=228.03 finish=228.56 vmsize=51856k
        963611) sed              cpu=13 start=228.57 finish=228.57 vmsize=9300k
I would probably want to get additional information from the /proc/pid/statm file, which is described on the man page as providing:
       /proc/[pid]/statm
              Provides information about memory usage, measured in pages.  The columns are:

                  size       (1) total program size
                             (same as VmSize in /proc/[pid]/status)
                  resident   (2) resident set size
                             (inaccurate; same as VmRSS in /proc/[pid]/status)
                  shared     (3) number of resident shared pages
                             (i.e., backed by a file)
                             (inaccurate; same as RssFile+RssShmem in
                             /proc/[pid]/status)
                  text       (4) text (code)
                  lib        (5) library (unused since Linux 2.6; always 0)
                  data       (6) data + stack
                  dt         (7) dirty pages (unused since Linux 2.6; always 0)