
Testing the draco library which compresses/decompresses 3d geometric meshes and point clouds. There are two workloads. The benchmark looks to be single-threaded and runs quickly.
Topdown profile is sparse but has a few more backend stalls than other stalls.
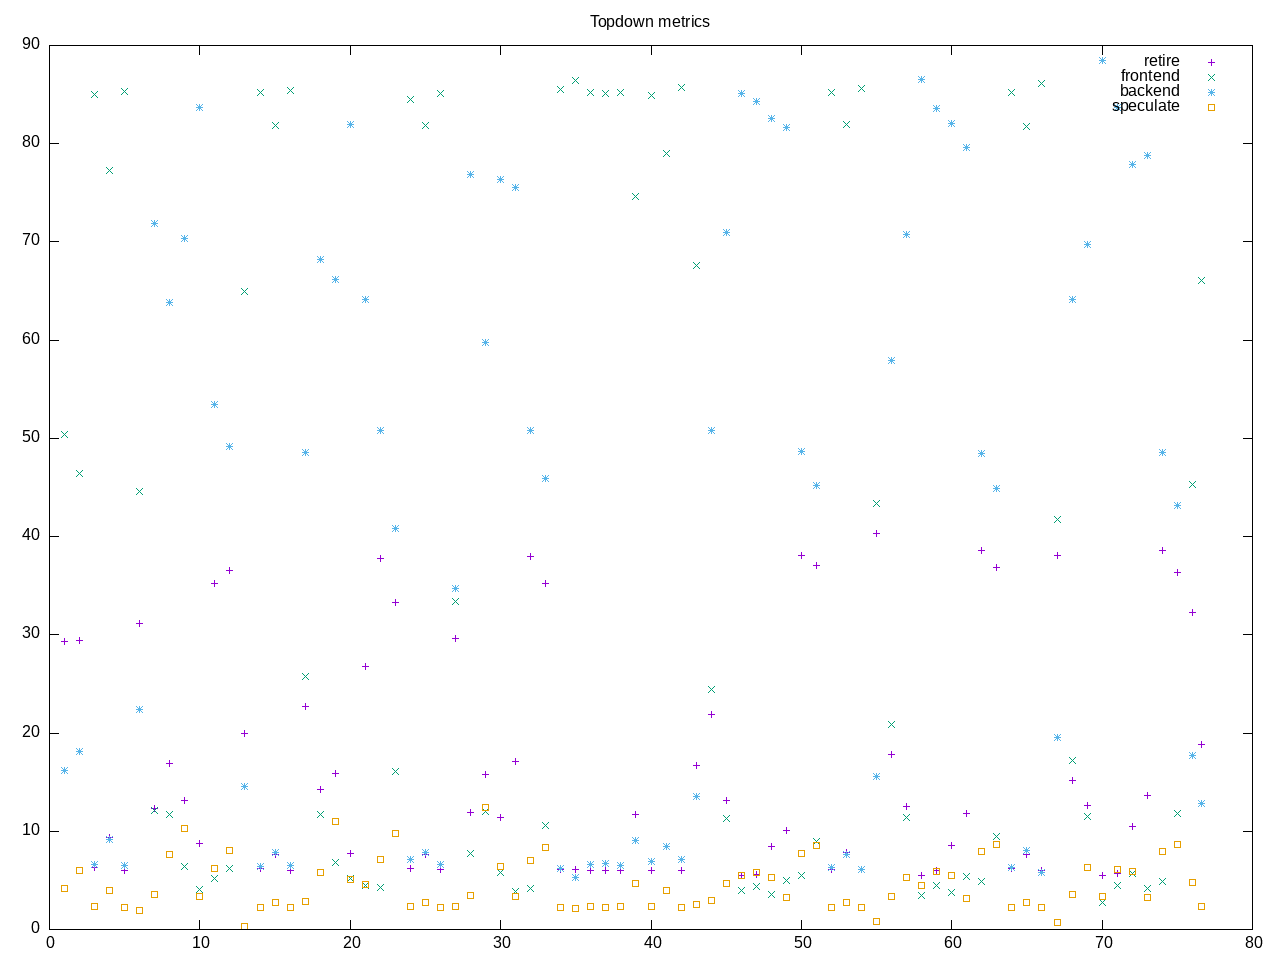
AMD metrics show this as memory-bound with a moderate L2 access but high L2 miss rate. Opcache and icache misses are lower as is the overall amount of frontend stalls. There is a high number of page faults suggesting a larger image.
elapsed              77.962
on_cpu               0.036          # 0.57 / 16 cores
utime                40.788
stime                4.022
nvcsw                2043           # 83.73%
nivcsw               397            # 16.27%
inblock              104            # 1.33/sec
onblock              80032          # 1026.55/sec
cpu-clock            44838944612    # 44.839 seconds
task-clock           44842022604    # 44.842 seconds
page faults          1795046        # 40030.442/sec
context switches     2648           # 59.052/sec
cpu migrations       255            # 5.687/sec
major page faults    2              # 0.045/sec
minor page faults    1795044        # 40030.398/sec
alignment faults     0              # 0.000/sec
emulation faults     0              # 0.000/sec
branches             33523335325    # 148.823 branches per 1000 inst
branch misses        732131582      # 2.18% branch miss
conditional          23698905001    # 105.209 conditional branches per 1000 inst
indirect             1555350390     # 6.905 indirect branches per 1000 inst
cpu-cycles           196511308061   # 0.16 GHz
instructions         224485305110   # 1.14 IPC
slots                395880545292   #
retiring             75548253138    # 19.1% (19.1%)
-- ucode             94125257       #     0.0%
-- fastpath          75454127881    #    19.1%
frontend             37847893235    #  9.6% ( 9.6%)
-- latency           26504030406    #     6.7%
-- bandwidth         11343862829    #     2.9%
backend              259262254091   # 65.5% (65.5%)
-- cpu               22063845225    #     5.6%
-- memory            237198408866   #    59.9%
speculation          23140243395    #  5.8% ( 5.8%)
-- branch mispredict 22566641443    #     5.7%
-- pipeline restart  573601952      #     0.1%
smt-contention       81622036       #  0.0% ( 0.0%)
cpu-cycles           196873203387   # 0.15 GHz
instructions         223740459677   # 1.14 IPC
instructions         74815515355    # 16.773 l2 access per 1000 inst
l2 hit from l1       867622158      # 54.20% l2 miss
l2 miss from l1      385079902      #
l2 hit from l2 pf    92216461       #
l3 hit from l2 pf    84717755       #
l3 miss from l2 pf   210321243      #
instructions         74852913626    # 97.722 float per 1000 inst
float 512            65             # 0.000 AVX-512 per 1000 inst
float 256            596            # 0.000 AVX-256 per 1000 inst
float 128            7314742792     # 97.722 AVX-128 per 1000 inst
float MMX            0              # 0.000 MMX per 1000 inst
float scalar         0              # 0.000 scalar per 1000 inst
instructions         224508389933   #
opcache              46644408269    # 207.762 opcache per 1000 inst
opcache miss         2316394861     #  5.0% opcache miss rate
l1 dTLB miss         901995710      # 4.018 L1 dTLB per 1000 inst
l2 dTLB miss         428419600      # 1.908 L2 dTLB per 1000 inst
instructions         224518696767   #
icache               5188957924     # 23.111 icache per 1000 inst
icache miss          247155351      #  4.8% icache miss rate
l1 iTLB miss         8246787        # 0.037 L1 iTLB per 1000 inst
l2 iTLB miss         0              # 0.000 L2 iTLB per 1000 inst
tlb flush            17624          # 0.000 TLB flush per 1000 inst
Intel metrics confirm this as a dram bound application.
elapsed              78.459
on_cpu               0.035          # 0.56 / 16 cores
utime                41.446
stime                2.806
nvcsw                2144           # 87.51%
nivcsw               306            # 12.49%
inblock              381824         # 4866.55/sec
onblock              68792          # 876.79/sec
cpu-clock            44260949968    # 44.261 seconds
task-clock           44264376235    # 44.264 seconds
page faults          1785230        # 40331.078/sec
context switches     2664           # 60.184/sec
cpu migrations       286            # 6.461/sec
major page faults    43             # 0.971/sec
minor page faults    1785187        # 40330.106/sec
alignment faults     0              # 0.000/sec
emulation faults     0              # 0.000/sec
branches             32716277551    # 146.506 branches per 1000 inst
branch misses        461064056      # 1.41% branch miss
conditional          32716289647    # 146.506 conditional branches per 1000 inst
indirect             1555729043     # 6.967 indirect branches per 1000 inst
slots                860942765204   #
retiring             217875645299   # 25.3% (25.3%)
-- ucode             14864431684    #     1.7%
-- fastpath          203011213615   #    23.6%
frontend             47874051035    #  5.6% ( 5.6%)
-- latency           22289417139    #     2.6%
-- bandwidth         25584633896    #     3.0%
backend              493844325597   # 57.4% (57.4%)
-- cpu               134378018395   #    15.6%
-- memory            359466307202   #    41.8%
speculation          104189435651   # 12.1% (12.1%) high
-- branch mispredict 101968937864   #    11.8%
-- pipeline restart  2220497787     #     0.3%
smt-contention       0              #  0.0% ( 0.0%)
cpu-cycles           143952942248   # 0.11 GHz
instructions         222454692992   # 1.55 IPC
l2 access            6186401409     # 27.816 l2 access per 1000 inst
l2 miss              4300814427     # 69.52% l2 miss
cpu-cycles           143931637736   # 46.2% memory latency
load stalls          64714460372    #  0.0% l1 bound
l1 miss              77055639785    # 13.1% l2 bound
l2 miss              58150653301    #  5.4% l3 bound
l3 miss              50425863737    # 35.0% dram bound
store_stalls         1809094793     #  1.3% store bound
Process information shows draco_encoder as the primary user application but also a higher percentage of test overhead.
362 processes
	  6 draco_encoder           39.71     3.01
	 68 clinfo                  16.71     5.99
	 38 vulkaninfo               1.72     0.95
	  4 vulkani:disk$0           0.18     0.10
	  6 glxinfo:gdrv0            0.14     0.02
	  6 glxinfo:gl0              0.14     0.02
	  2 llvmpipe-0               0.09     0.05
	  2 llvmpipe-1               0.09     0.05
	  2 llvmpipe-10              0.09     0.05
	  2 llvmpipe-11              0.09     0.05
	  2 llvmpipe-12              0.09     0.05
	  2 llvmpipe-13              0.09     0.05
	  2 llvmpipe-14              0.09     0.05
	  2 llvmpipe-15              0.09     0.05
	  2 llvmpipe-2               0.09     0.05
	  2 llvmpipe-3               0.09     0.05
	  2 llvmpipe-4               0.09     0.05
	  2 llvmpipe-5               0.09     0.05
	  2 llvmpipe-6               0.09     0.05
	  2 llvmpipe-7               0.09     0.05
	  2 llvmpipe-8               0.09     0.05
	  2 llvmpipe-9               0.09     0.05
	  6 php                      0.07     0.08
	  2 glxinfo                  0.06     0.02
	  2 glxinfo:cs0              0.06     0.02
	  2 glxinfo:disk$0           0.06     0.02
	  2 glxinfo:sh0              0.06     0.02
	  2 glxinfo:shlo0            0.06     0.02
	  6 clang                    0.03     0.09
	  3 rocminfo                 0.03     0.00
	  1 lspci                    0.00     0.02
	 84 sh                       0.00     0.00
	 13 gcc                      0.00     0.00
	 13 gsettings                0.00     0.00
	  8 stat                     0.00     0.00
	  8 systemd-detect-          0.00     0.00
	  6 draco                    0.00     0.00
	  6 llvm-link                0.00     0.00
	  5 phoronix-test-s          0.00     0.00
	  2 cc                       0.00     0.00
	  2 gmain                    0.00     0.00
	  2 lscpu                    0.00     0.00
	  2 uname                    0.00     0.00
	  2 which                    0.00     0.00
	  2 xset                     0.00     0.00
	  1 date                     0.00     0.00
	  1 dconf worker             0.00     0.00
	  1 dirname                  0.00     0.00
	  1 dmesg                    0.00     0.00
	  1 dmidecode                0.00     0.00
	  1 grep                     0.00     0.00
	  1 ifconfig                 0.00     0.00
	  1 ip                       0.00     0.00
	  1 lsmod                    0.00     0.00
	  1 mktemp                   0.00     0.00
	  1 ps                       0.00     0.00
	  1 qdbus                    0.00     0.00
	  1 readlink                 0.00     0.00
	  1 realpath                 0.00     0.00
	  1 sed                      0.00     0.00
	  1 sort                     0.00     0.00
	  1 stty                     0.00     0.00
	  1 systemctl                0.00     0.00
	  1 template.sh              0.00     0.00
	  1 wc                       0.00     0.00
	  1 xrandr                   0.00     0.00
0 processes running
47 maximum processes
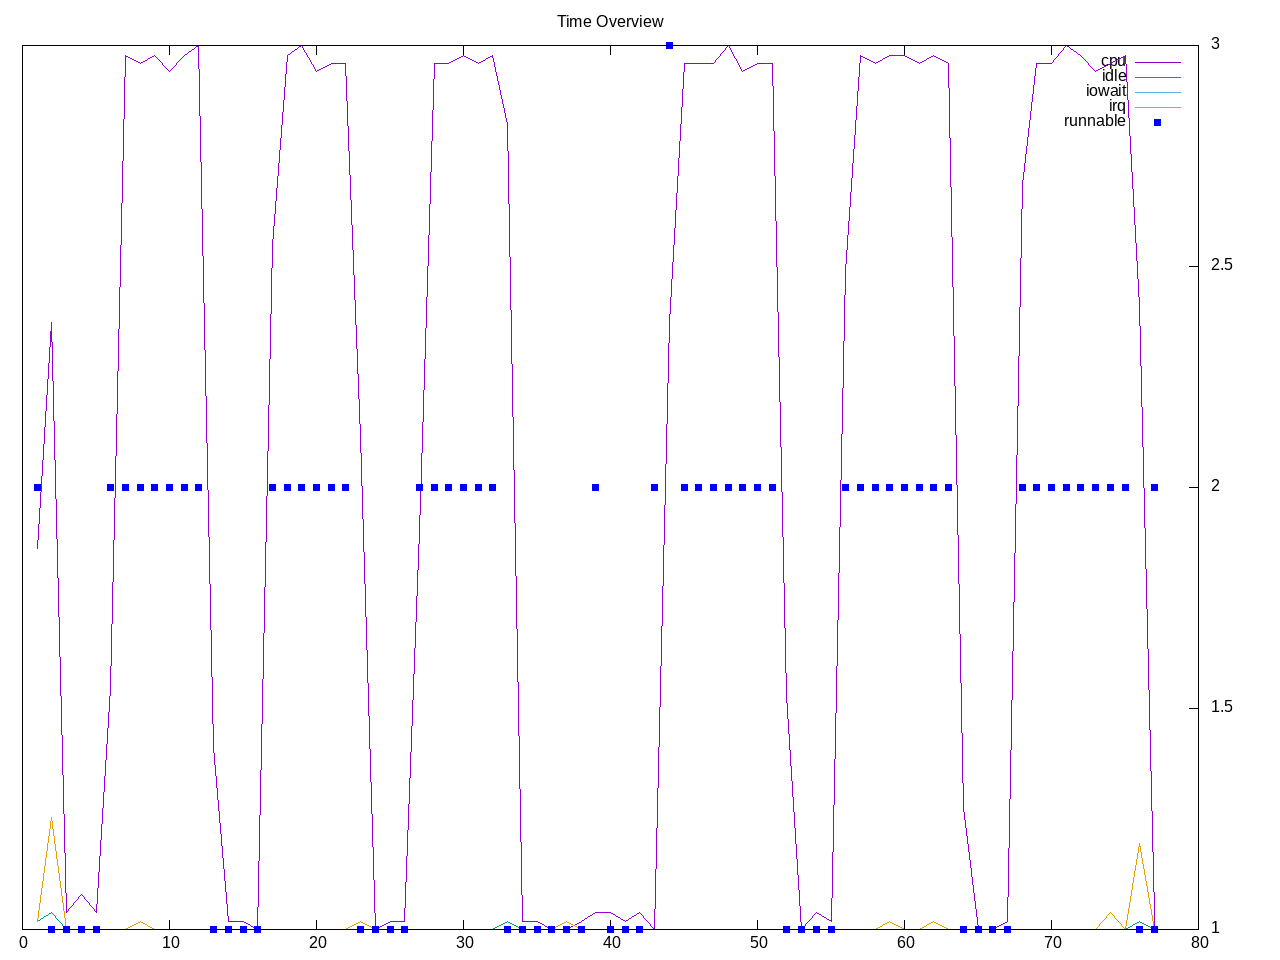
Computation structure
      59852) draco            cpu=14 start=5.59  finish=11.96
        59853) draco_encoder    cpu=4 start=5.59  finish=11.95
      59856) draco            cpu=11 start=15.96 finish=22.34
        59857) draco_encoder    cpu=12 start=15.97 finish=22.32
      59858) draco            cpu=11 start=26.34 finish=32.71
        59859) draco_encoder    cpu=4 start=26.34 finish=32.70
      59860) sh               cpu=11 start=32.71 finish=32.71
        59861) sh               cpu=13 start=32.71 finish=32.71
      59862) draco            cpu=11 start=42.89 finish=50.82
        59863) draco_encoder    cpu=4 start=42.90 finish=50.81
      59864) draco            cpu=11 start=54.83 finish=62.73
        59865) draco_encoder    cpu=4 start=54.83 finish=62.72
      59866) draco            cpu=11 start=66.73 finish=74.64
        59867) draco_encoder    cpu=4 start=66.74 finish=74.63