
A test for scientific/numerical computing with FFT, Jacobi Successive Over-relaxation, Monte Carlo, Sparse Matrix Multiply and dense LU factorization. This is a single-threaded program with array type functions that likely benefit from -O3 optimizations. Also a care where relatively speaking my Intel CPU performs better.
Topdown profile shows differences among the six tests with one of them having particularly high branch misprediction.
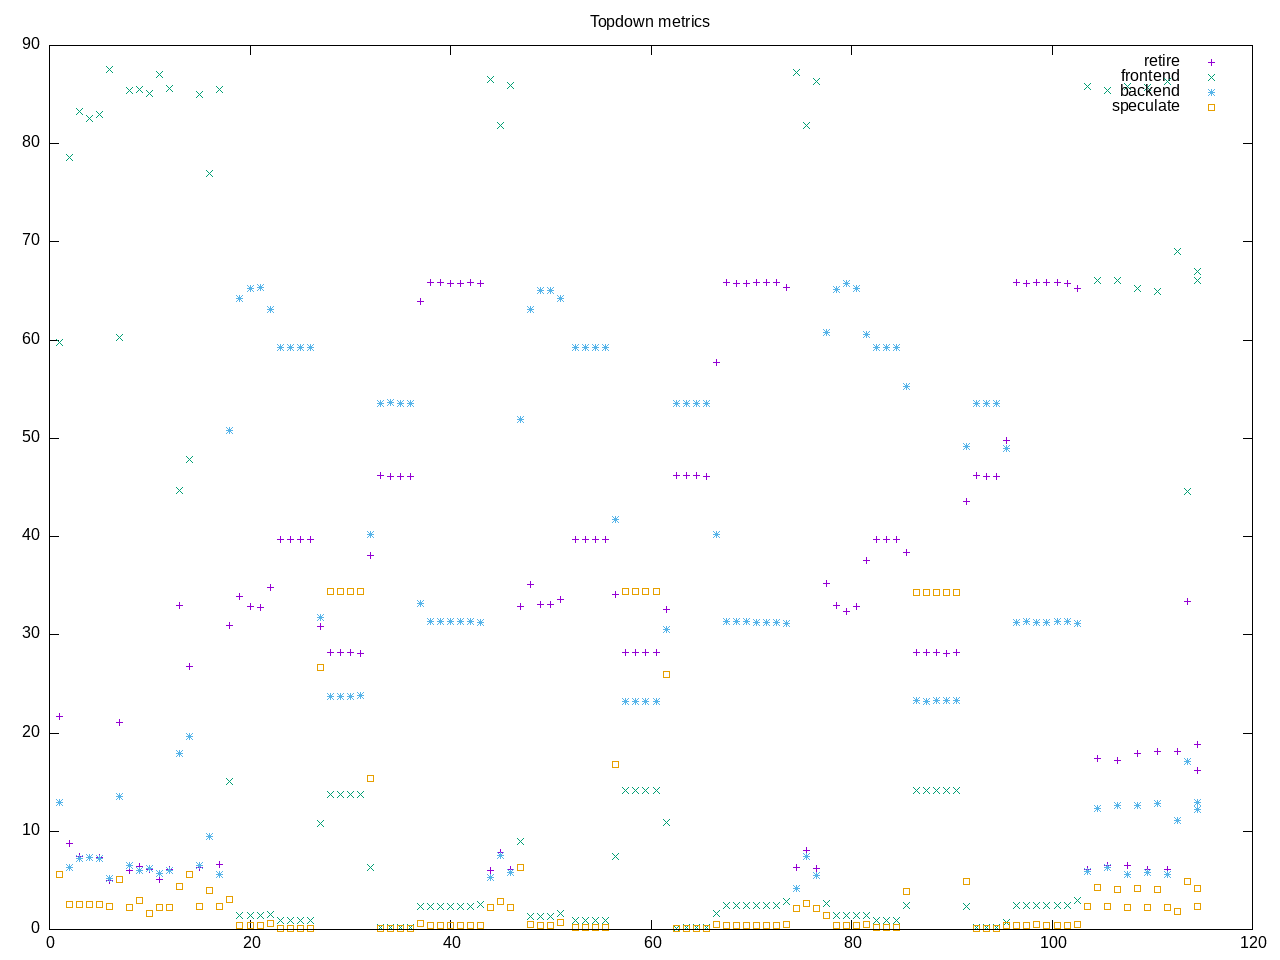
AMD metrics show very low frontend stalls and not many L2 accesses.
elapsed              120.143
on_cpu               0.041          # 0.65 / 16 cores
utime                77.062
stime                0.901
nvcsw                2073           # 75.85%
nivcsw               660            # 24.15%
inblock              0              # 0.00/sec
onblock              12952          # 107.81/sec
cpu-clock            77989027760    # 77.989 seconds
task-clock           77992605087    # 77.993 seconds
page faults          171397         # 2197.606/sec
context switches     3130           # 40.132/sec
cpu migrations       277            # 3.552/sec
major page faults    2              # 0.026/sec
minor page faults    171395         # 2197.580/sec
alignment faults     0              # 0.000/sec
emulation faults     0              # 0.000/sec
branches             41435159232    # 45.318 branches per 1000 inst
branch misses        1064480394     # 2.57% branch miss
conditional          36540908643    # 39.965 conditional branches per 1000 inst
indirect             45509669       # 0.050 indirect branches per 1000 inst
cpu-cycles           374643884210   # 0.19 GHz
instructions         948713151358   # 2.53 IPC
slots                752276514300   #
retiring             330387842212   # 43.9% (43.9%)
-- ucode             10231549       #     0.0%
-- fastpath          330377610663   #    43.9%
frontend             34320778963    #  4.6% ( 4.6%) low
-- latency           22696737306    #     3.0%
-- bandwidth         11624041657    #     1.5%
backend              334210686266   # 44.4% (44.4%)
-- cpu               155565850726   #    20.7%
-- memory            178644835540   #    23.7%
speculation          53315171232    #  7.1% ( 7.1%)
-- branch mispredict 52405351963    #     7.0%
-- pipeline restart  909819269      #     0.1%
smt-contention       41777915       #  0.0% ( 0.0%)
cpu-cycles           356773196761   # 0.18 GHz
instructions         911718531981   # 2.56 IPC
instructions         304843400647   # 17.199 l2 access per 1000 inst
l2 hit from l1       2559865446     # 36.41% l2 miss
l2 miss from l1      112336155      #
l2 hit from l2 pf    886371975      #
l3 hit from l2 pf    1712944459     #
l3 miss from l2 pf   83870847       #
instructions         304871254285   # 138.593 float per 1000 inst
float 512            63             # 0.000 AVX-512 per 1000 inst
float 256            600            # 0.000 AVX-256 per 1000 inst
float 128            42252886621    # 138.593 AVX-128 per 1000 inst
float MMX            0              # 0.000 MMX per 1000 inst
float scalar         0              # 0.000 scalar per 1000 inst
Intel metrics
elapsed              111.250
on_cpu               0.049          # 0.79 / 16 cores
utime                86.983
stime                0.416
nvcsw                1833           # 82.68%
nivcsw               384            # 17.32%
inblock              0              # 0.00/sec
onblock              1704           # 15.32/sec
cpu-clock            87416742309    # 87.417 seconds
task-clock           87419658637    # 87.420 seconds
page faults          160844         # 1839.907/sec
context switches     2602           # 29.764/sec
cpu migrations       282            # 3.226/sec
major page faults    0              # 0.000/sec
minor page faults    160844         # 1839.907/sec
alignment faults     0              # 0.000/sec
emulation faults     0              # 0.000/sec
branches             49111974552    # 45.159 branches per 1000 inst
branch misses        1006651173     # 2.05% branch miss
conditional          49111986488    # 45.159 conditional branches per 1000 inst
indirect             66878428       # 0.061 indirect branches per 1000 inst
slots                2066702758058  #
retiring             1113671660547  # 53.9% (53.9%)
-- ucode             19320553958    #     0.9%
-- fastpath          1094351106589  #    53.0%
frontend             57972748845    #  2.8% ( 2.8%) low
-- latency           27368677487    #     1.3%
-- bandwidth         30604071358    #     1.5%
backend              687206848332   # 33.3% (33.3%)
-- cpu               510136569456   #    24.7%
-- memory            177070278876   #     8.6%
speculation          280845134496   # 13.6% (13.6%) high
-- branch mispredict 265676095678   #    12.9%
-- pipeline restart  15169038818    #     0.7%
smt-contention       0              #  0.0% ( 0.0%)
cpu-cycles           371966209251   # 0.19 GHz
instructions         1199189287856  # 3.22 IPC high
l2 access            19221667822    # 16.042 l2 access per 1000 inst
l2 miss              10810784391    # 56.24% l2 miss
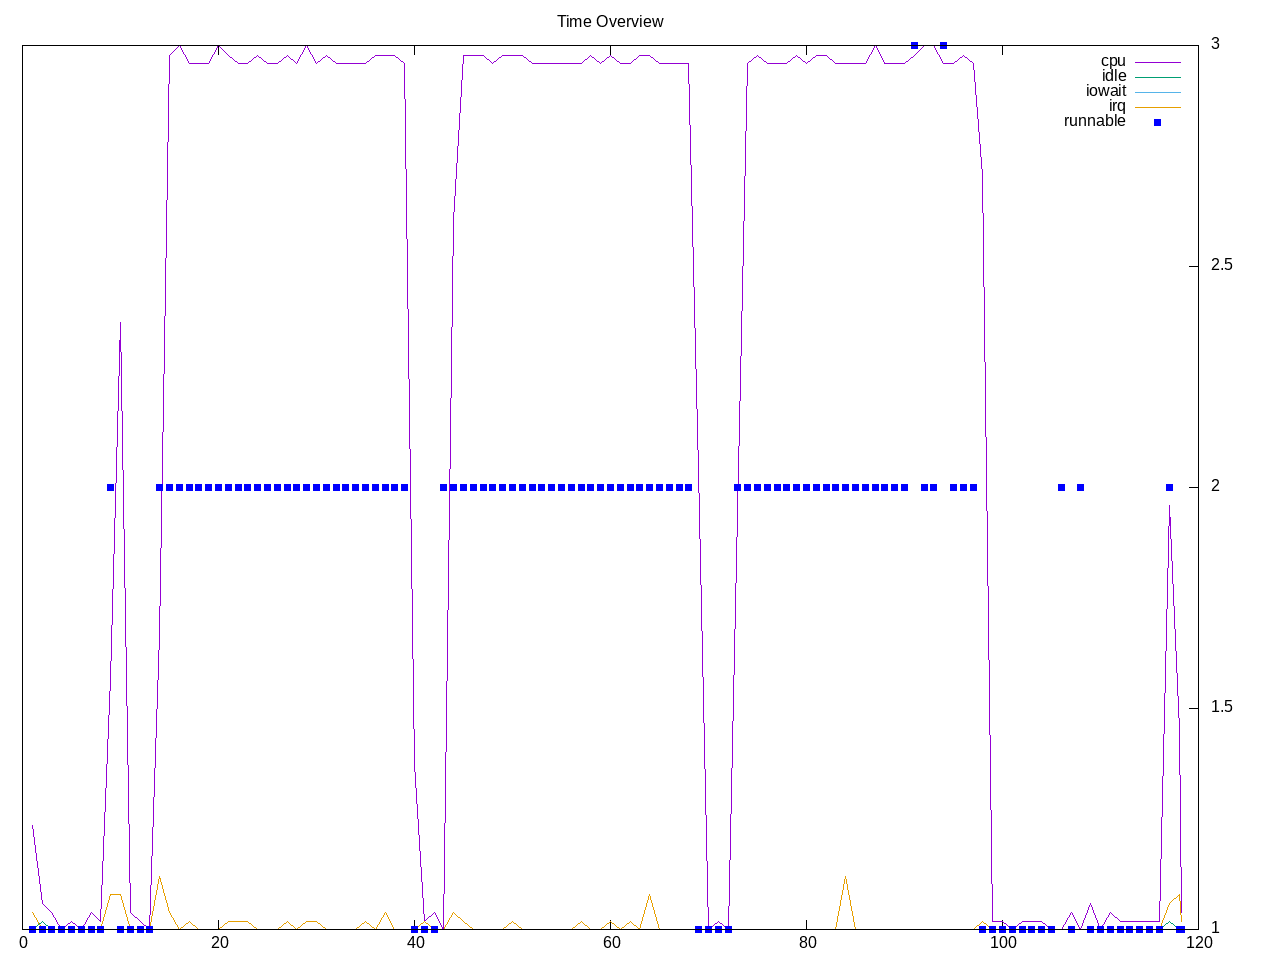
Process summary shows six invocations of scimark2 and otherwise test overhead.
354 processes
	  6 scimark2                79.83     0.02
	 68 clinfo                  19.51     6.99
	 38 vulkaninfo               1.52     1.14
	  4 vulkani:disk$0           0.16     0.12
	  6 glxinfo:gdrv0            0.15     0.05
	  6 glxinfo:gl0              0.15     0.05
	  2 llvmpipe-0               0.08     0.06
	  2 llvmpipe-1               0.08     0.06
	  2 llvmpipe-10              0.08     0.06
	  2 llvmpipe-11              0.08     0.06
	  2 llvmpipe-12              0.08     0.06
	  2 llvmpipe-13              0.08     0.06
	  2 llvmpipe-14              0.08     0.06
	  2 llvmpipe-15              0.08     0.06
	  2 llvmpipe-2               0.08     0.06
	  2 llvmpipe-3               0.08     0.06
	  2 llvmpipe-4               0.08     0.06
	  2 llvmpipe-5               0.08     0.06
	  2 llvmpipe-6               0.08     0.06
	  2 llvmpipe-7               0.08     0.06
	  2 llvmpipe-8               0.08     0.06
	  2 llvmpipe-9               0.08     0.06
	  6 php                      0.07     0.09
	  2 glxinfo                  0.07     0.03
	  2 glxinfo:cs0              0.07     0.03
	  2 glxinfo:disk$0           0.07     0.03
	  2 glxinfo:sh0              0.07     0.03
	  2 glxinfo:shlo0            0.07     0.03
	  6 clang                    0.06     0.06
	  1 lspci                    0.01     0.02
	  3 rocminfo                 0.00     0.03
	 82 sh                       0.00     0.00
	 13 gcc                      0.00     0.00
	  8 gsettings                0.00     0.00
	  8 stat                     0.00     0.00
	  8 systemd-detect-          0.00     0.00
	  6 llvm-link                0.00     0.00
	  5 gmain                    0.00     0.00
	  5 phoronix-test-s          0.00     0.00
	  3 dconf worker             0.00     0.00
	  2 cc                       0.00     0.00
	  2 lscpu                    0.00     0.00
	  2 uname                    0.00     0.00
	  2 which                    0.00     0.00
	  2 xset                     0.00     0.00
	  1 date                     0.00     0.00
	  1 dirname                  0.00     0.00
	  1 dmesg                    0.00     0.00
	  1 dmidecode                0.00     0.00
	  1 grep                     0.00     0.00
	  1 ifconfig                 0.00     0.00
	  1 ip                       0.00     0.00
	  1 lsmod                    0.00     0.00
	  1 mktemp                   0.00     0.00
	  1 ps                       0.00     0.00
	  1 qdbus                    0.00     0.00
	  1 readlink                 0.00     0.00
	  1 realpath                 0.00     0.00
	  1 sed                      0.00     0.00
	  1 sort                     0.00     0.00
	  1 stty                     0.00     0.00
	  1 systemctl                0.00     0.00
	  1 template.sh              0.00     0.00
	  1 wc                       0.00     0.00
	  1 xrandr                   0.00     0.00
0 processes running
47 maximum processes
The computation block
      1189178) scimark2         cpu=7 start=5.83  finish=35.09
        1189179) scimark2         cpu=1 start=5.84  finish=35.09
      1189181) scimark2         cpu=6 start=39.09 finish=64.41
        1189182) scimark2         cpu=7 start=39.09 finish=64.41
      1189184) scimark2         cpu=6 start=68.42 finish=93.77
        1189185) scimark2         cpu=7 start=68.42 finish=93.77