
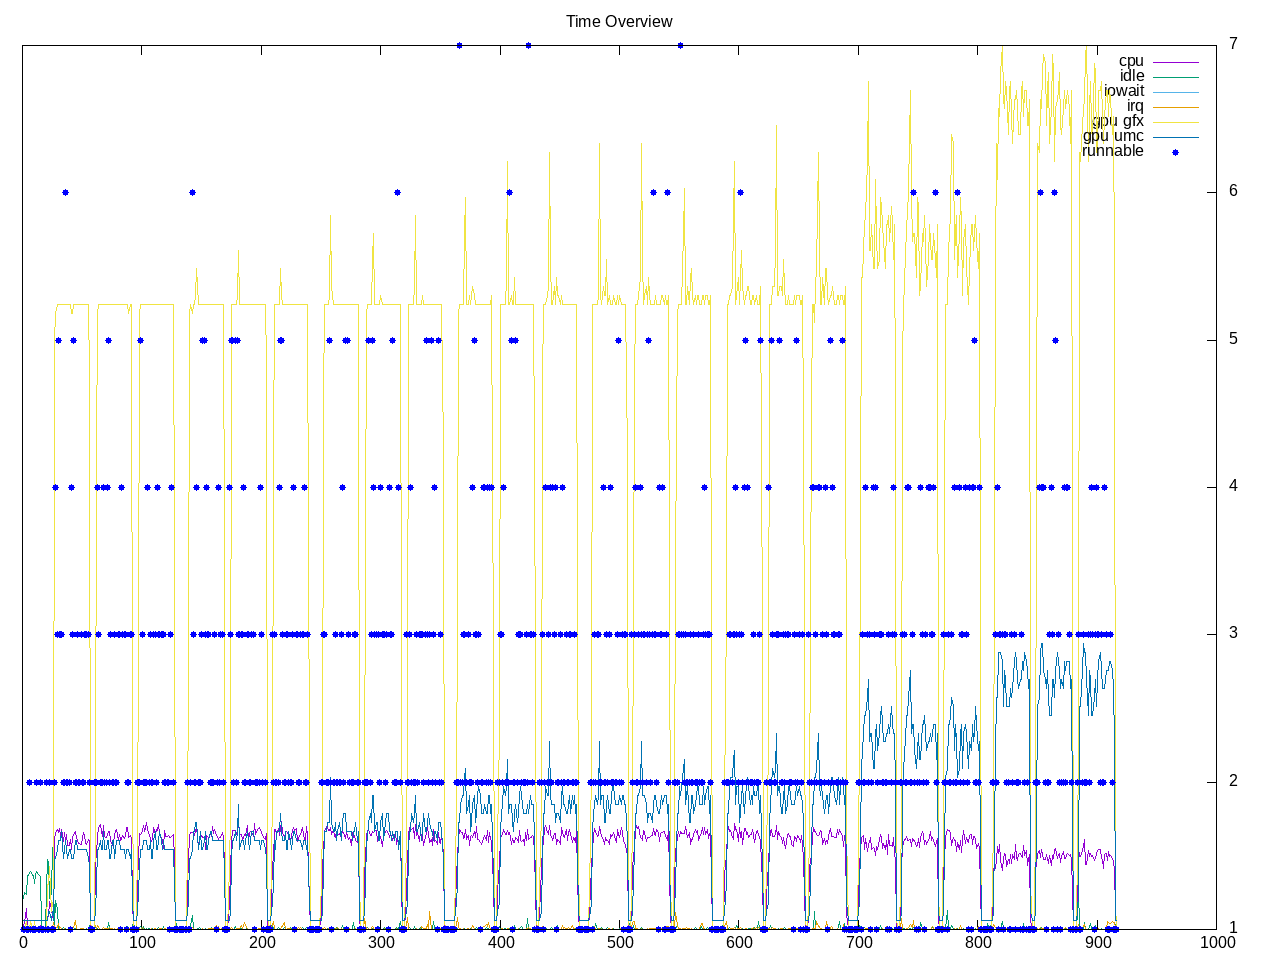
Tesseract is a GPU focused game that tries a set of scenes at different resolutions and reports frames/sec. As such unclear how much this really tests the CPU so don’t expect to run more of these game applications. The progression below uses increasing resolutions and presumably slower waits for GPU. Just a few processes are runable.

Running on a system with discrete GPU and ROCm running we can also used the amdsmi library to monitor business of AMD graphics and memory. In yellow below we can see the graphics is kept busier than CPU and the UMC in blue is also shown. Unfortunately, this uses the amdgpu driver and only seems to work platforms with ROCm.
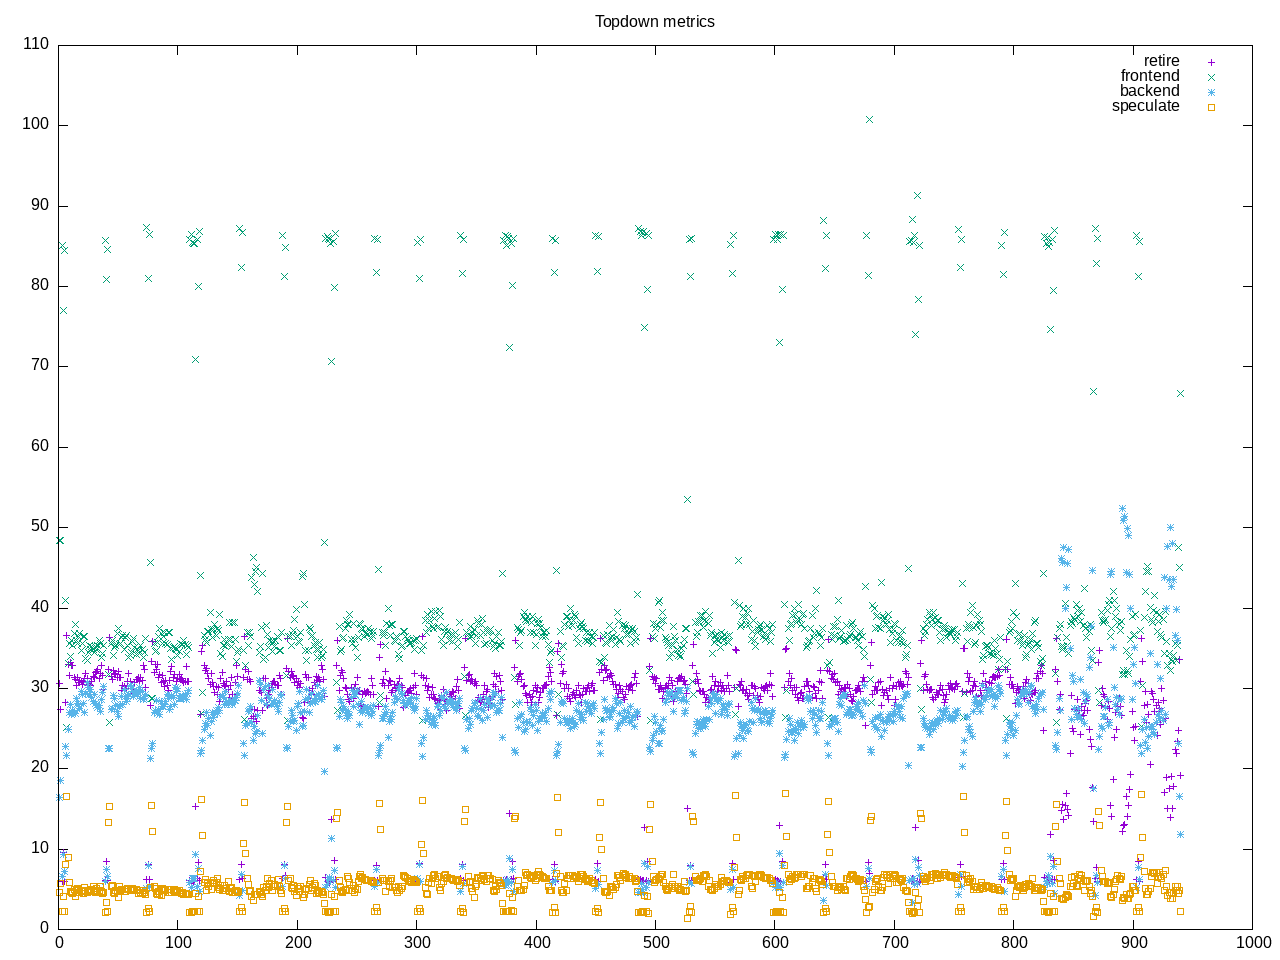
Topdown metrics shows mix of frontend stalls and then retiring and backend.
AMD metrics show only 0.60 on cpu so most all is a GPU application time. There is a moderate L2 access with a higher miss rate.
elapsed              940.138
on_cpu               0.037          # 0.60 / 16 cores
utime                448.137
stime                114.663
nvcsw                5006246        # 99.31%
nivcsw               34548          # 0.69%
inblock              760            # 0.81/sec
onblock              15352          # 16.33/sec
cpu-clock            555072782963   # 555.073 seconds
task-clock           557387113153   # 557.387 seconds
page faults          1091959        # 1959.068/sec
context switches     5045214        # 9051.544/sec
cpu migrations       6429           # 11.534/sec
major page faults    783            # 1.405/sec
minor page faults    1091176        # 1957.663/sec
alignment faults     0              # 0.000/sec
emulation faults     0              # 0.000/sec
branches             432496189191   # 164.537 branches per 1000 inst
branch misses        12518545903    # 2.89% branch miss
conditional          312883554453   # 119.032 conditional branches per 1000 inst
indirect             16879982752    # 6.422 indirect branches per 1000 inst
cpu-cycles           2297827692401  # 0.10 GHz
instructions         4134264086743  # 1.80 IPC
slots                4592679099624  #
retiring             1399510657504  # 30.5% (30.6%)
-- ucode             5332102804     #     0.1%
-- fastpath          1394178554700  #    30.4%
frontend             1631768830655  # 35.5% (35.7%)
-- latency           1193385343362  #    26.0%
-- bandwidth         438383487293   #     9.5%
backend              1228985655369  # 26.8% (26.9%)
-- cpu               195338081902   #     4.3%
-- memory            1033647573467  #    22.5%
speculation          306018898077   #  6.7% ( 6.7%)
-- branch mispredict 301962227802   #     6.6%
-- pipeline restart  4056670275     #     0.1%
smt-contention       26346755888    #  0.6% ( 0.0%)
cpu-cycles           2081086819075  # 0.10 GHz
instructions         3702405530816  # 1.78 IPC
instructions         1229550171162  # 41.165 l2 access per 1000 inst
l2 hit from l1       47072177297    # 25.67% l2 miss
l2 miss from l1      10767695677    #
l2 hit from l2 pf    1316928266     #
l3 hit from l2 pf    2055888447     #
l3 miss from l2 pf   169576582      #
instructions         1224949261309  # 63.013 float per 1000 inst
float 512            127            # 0.000 AVX-512 per 1000 inst
float 256            158978         # 0.000 AVX-256 per 1000 inst
float 128            77187093384    # 63.012 AVX-128 per 1000 inst
float MMX            0              # 0.000 MMX per 1000 inst
float scalar         0              # 0.000 scalar per 1000 inst
Intel metrics with a somewhat different iGPU that seems ~2x slower frame rate.
elapsed              916.368
on_cpu               0.044          # 0.71 / 16 cores
utime                560.936
stime                85.333
nvcsw                1113258        # 99.18%
nivcsw               9227           # 0.82%
inblock              16088          # 17.56/sec
onblock              9976           # 10.89/sec
cpu-clock            639362215876   # 639.362 seconds
task-clock           640526730187   # 640.527 seconds
page faults          1119966        # 1748.508/sec
context switches     1126776        # 1759.140/sec
cpu migrations       8294           # 12.949/sec
major page faults    109            # 0.170/sec
minor page faults    1119857        # 1748.338/sec
alignment faults     0              # 0.000/sec
emulation faults     0              # 0.000/sec
branches             386646868699   # 170.775 branches per 1000 inst
branch misses        6406907616     # 1.66% branch miss
conditional          386646903227   # 170.775 conditional branches per 1000 inst
indirect             13807109676    # 6.098 indirect branches per 1000 inst
slots                7765648184300  #
retiring             2874712201531  # 37.0% (37.0%)
-- ucode             217635797671   #     2.8%
-- fastpath          2657076403860  #    34.2%
frontend             1908382930340  # 24.6% (24.6%)
-- latency           858073053677   #    11.0%
-- bandwidth         1050309876663  #    13.5%
backend              1650754897442  # 21.3% (21.3%)
-- cpu               768652337590   #     9.9%
-- memory            882102559852   #    11.4%
speculation          1405928996655  # 18.1% (18.1%)
-- branch mispredict 1385587146745  #    17.8%
-- pipeline restart  20341849910    #     0.3%
smt-contention       0              #  0.0% ( 0.0%)
cpu-cycles           1319100239590  # 0.09 GHz
instructions         2254013924600  # 1.71 IPC
l2 access            92921018270    # 41.629 l2 access per 1000 inst
l2 miss              37922616224    # 40.81% l2 miss
Process summary shows both gdrv (driver?) and several client and disk processes.
1005 processes
	 96 linux_64:gdrv0         433.33    94.69
	 24 linux_64_client        430.57    93.18
	 24 SDLTimer               430.53    93.16
	 24 linux_64_c:cs0         430.53    93.15
	 24 linux_6:disk$0         430.52    93.15
	 24 linux_64:shlo0         430.51    93.15
	 24 linux_64_c:sh1         430.51    93.14
	 24 linux_64_c:sh10        430.51    93.14
	 24 linux_64_c:sh2         430.51    93.14
	 24 linux_64_c:sh3         430.51    93.14
	 24 linux_64_c:sh4         430.51    93.14
	 24 linux_64_c:sh5         430.51    93.14
	 24 linux_64_c:sh7         430.51    93.14
	 24 linux_64_c:sh8         430.51    93.14
	 24 linux_64_c:sh0         430.50    93.14
	 24 linux_64_c:sh11        430.50    93.14
	 24 linux_64_c:sh6         430.50    93.14
	 24 linux_64_c:sh9         430.50    93.14
	 24 PulseHotplug           430.47    93.11
	 24 SDLAudioP2             430.46    93.11
	 68 clinfo                  19.06     7.30
	 38 vulkaninfo               1.14     1.53
	  6 glxinfo:gdrv0            0.17     0.10
	  6 php                      0.13     0.26
	  4 vulkani:disk$0           0.12     0.17
	  2 glxinfo                  0.08     0.04
	  2 glxinfo:cs0              0.08     0.04
	  2 glxinfo:disk$0           0.08     0.04
	  6 clang                    0.07     0.05
	  2 glxinfo:sh0              0.07     0.04
	  2 glxinfo:shlo0            0.07     0.04
	  2 llvmpipe-0               0.06     0.09
	  2 llvmpipe-1               0.06     0.09
	  2 llvmpipe-10              0.06     0.09
	  2 llvmpipe-11              0.06     0.09
	  2 llvmpipe-12              0.06     0.09
	  2 llvmpipe-13              0.06     0.09
	  2 llvmpipe-14              0.06     0.09
	  2 llvmpipe-15              0.06     0.09
	  2 llvmpipe-2               0.06     0.09
	  2 llvmpipe-3               0.06     0.09
	  2 llvmpipe-4               0.06     0.09
	  2 llvmpipe-5               0.06     0.09
	  2 llvmpipe-6               0.06     0.09
	  2 llvmpipe-7               0.06     0.09
	  2 llvmpipe-8               0.06     0.09
	  2 llvmpipe-9               0.06     0.09
	  3 rocminfo                 0.00     0.03
	  1 lspci                    0.00     0.03
	  1 ps                       0.00     0.01
	 97 sh                       0.00     0.00
	 50 uname                    0.00     0.00
	 24 rm                       0.00     0.00
	 24 tesseract                0.00     0.00
	 14 gsettings                0.00     0.00
	 12 gcc                      0.00     0.00
	  9 systemd-detect-          0.00     0.00
	  8 stat                     0.00     0.00
	  6 llvm-link                0.00     0.00
	  5 phoronix-test-s          0.00     0.00
	  2 gmain                    0.00     0.00
	  2 lscpu                    0.00     0.00
	  2 which                    0.00     0.00
	  2 xrandr                   0.00     0.00
	  2 xset                     0.00     0.00
	  1 cc                       0.00     0.00
	  1 date                     0.00     0.00
	  1 dirname                  0.00     0.00
	  1 dmesg                    0.00     0.00
	  1 dmidecode                0.00     0.00
	  1 grep                     0.00     0.00
	  1 ifconfig                 0.00     0.00
	  1 ip                       0.00     0.00
	  1 lsmod                    0.00     0.00
	  1 mktemp                   0.00     0.00
	  1 qdbus                    0.00     0.00
	  1 readlink                 0.00     0.00
	  1 realpath                 0.00     0.00
	  1 sed                      0.00     0.00
	  1 sort                     0.00     0.00
	  1 stty                     0.00     0.00
	  1 systemctl                0.00     0.00
	  1 template.sh              0.00     0.00
	  1 wc                       0.00     0.00
0 processes running
47 maximum processes
Following is the processes for one iteration
      290837) tesseract        cpu=11 start=5.72  finish=37.33
        290838) rm               cpu=4 start=5.72  finish=5.72
        290839) linux_64_client  cpu=4 start=5.72  finish=37.31
          290840) uname            cpu=1 start=5.72  finish=5.72
          290841) uname            cpu=10 start=5.72  finish=5.73
          290842) SDLTimer         cpu=4 start=5.74  finish=37.31
          290843) linux_64_c:cs0   cpu=9 start=5.78  finish=37.31
          290844) linux_6:disk$0   cpu=10 start=5.78  finish=37.31
          290845) linux_64_c:sh0   cpu=14 start=5.78  finish=37.31
          290846) linux_64:shlo0   cpu=15 start=5.78  finish=37.31
          290847) linux_64:gdrv0   cpu=14 start=5.79  finish=5.80
          290848) linux_64:gdrv0   cpu=14 start=5.80  finish=5.80
          290850) PulseHotplug     cpu=15 start=5.80  finish=37.30
          290851) linux_64:gdrv0   cpu=4 start=5.80  finish=5.80
          290852) linux_64:gdrv0   cpu=7 start=5.81  finish=37.31
          290853) linux_64_c:sh1   cpu=3 start=5.82  finish=37.31
          290854) linux_64_c:sh2   cpu=12 start=5.82  finish=37.31
          290855) linux_64_c:sh3   cpu=2 start=5.82  finish=37.31
          290856) linux_64_c:sh4   cpu=6 start=5.82  finish=37.31
          290857) SDLAudioP2       cpu=10 start=5.88  finish=37.30
          290858) linux_64_c:sh5   cpu=12 start=5.91  finish=37.31
          290859) linux_64_c:sh6   cpu=6 start=5.91  finish=37.31
          290860) linux_64_c:sh7   cpu=5 start=5.91  finish=37.31
          290861) linux_64_c:sh8   cpu=5 start=5.91  finish=37.31
          290862) linux_64_c:sh9   cpu=15 start=5.91  finish=37.31
          290863) linux_64_c:sh10  cpu=6 start=5.92  finish=37.31
          290864) linux_64_c:sh11  cpu=1 start=5.92  finish=37.31