
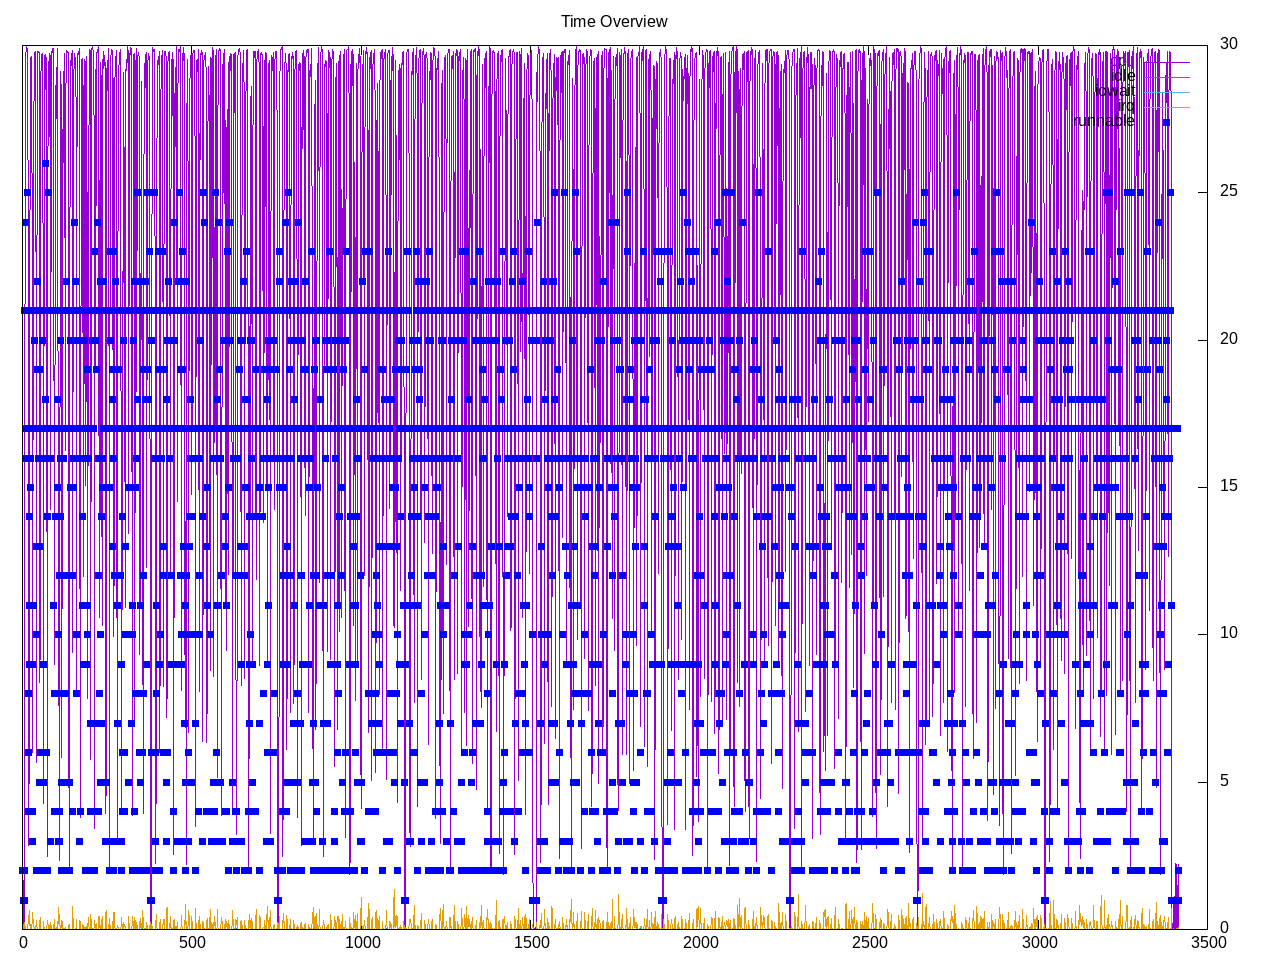
LeelaChessZero is a chess program automated via neural networks. There are three backends: BLAS, Eigen and OpenCL. The OpenCL backend didn’t run because OpenCL wasn’t configured. The BLAS implementation is much faster on my AMD CPU than my Intel CPU. Th e profile shows a lot of variation in runnable processes.I expect we will see many short processes running.
Frontend stalls periodically spike up and retirement rate is in mid 30s.
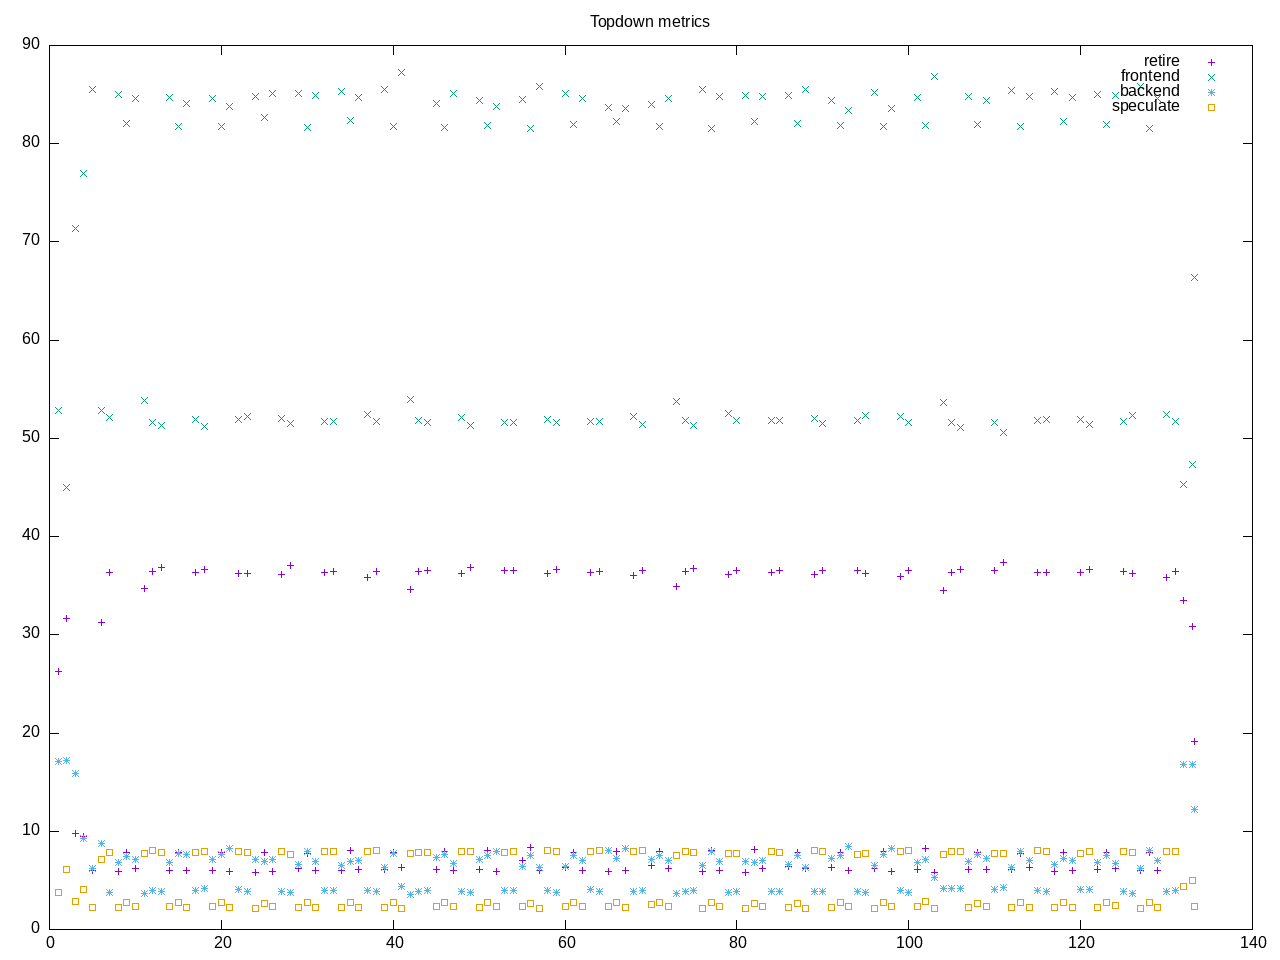
AMD metrics show a lot of context switches and page faults. Waiting on both CPU and memory.
elapsed              2286.628
on_cpu               0.788          # 12.61 / 16 cores
utime                28433.206
stime                398.719
nvcsw                3234284        # 4.57%
nivcsw               67581710       # 95.43%
inblock              0              # 0.00/sec
onblock              28176          # 12.32/sec
cpu-clock            28817910710262 # 28817.911 seconds
task-clock           28822250831254 # 28822.251 seconds
page faults          13958000       # 484.279/sec
context switches     70827221       # 2457.380/sec
cpu migrations       638731         # 22.161/sec
major page faults    6              # 0.000/sec
minor page faults    13957994       # 484.278/sec
alignment faults     0              # 0.000/sec
emulation faults     0              # 0.000/sec
branches             6068063340836  # 48.790 branches per 1000 inst
branch misses        161506622845   # 2.66% branch miss
conditional          4022477007429  # 32.343 conditional branches per 1000 inst
indirect             635544091025   # 5.110 indirect branches per 1000 inst
cpu-cycles           127880209993342 # 3.00 GHz
instructions         136039223127335 # 1.06 IPC
slots                255788277627072 #
retiring             46024278712982 # 18.0% (23.6%)
-- ucode             148061056873   #     0.1%
-- fastpath          45876217656109 #    17.9%
frontend             16172927052638 #  6.3% ( 8.3%)
-- latency           8743803494448  #     3.4%
-- bandwidth         7429123558190  #     2.9%
backend              128450684661770 # 50.2% (66.0%)
-- cpu               72082918052603 #    28.2%
-- memory            56367766609167 #    22.0%
speculation          4004300785800  #  1.6% ( 2.1%)
-- branch mispredict 3950326280615  #     1.5%
-- pipeline restart  53974505185    #     0.0%
smt-contention       61135597919753 # 23.9% ( 0.0%)
cpu-cycles           109299872593817 # 2.99 GHz
instructions         123409306628789 # 1.13 IPC
instructions         41152895861252 # 95.467 l2 access per 1000 inst
l2 hit from l1       2977220324102  # 7.87% l2 miss
l2 miss from l1      82623493543    #
l2 hit from l2 pf    725059870544   #
l3 hit from l2 pf    106665422650   #
l3 miss from l2 pf   119803286779   #
instructions         41153957789364 # 89.041 float per 1000 inst
float 512            85             # 0.000 AVX-512 per 1000 inst
float 256            11641          # 0.000 AVX-256 per 1000 inst
float 128            3664377273313  # 89.041 AVX-128 per 1000 inst
float MMX            0              # 0.000 MMX per 1000 inst
float scalar         0              # 0.000 scalar per 1000 inst
Intel metrics.
elapsed              4689.232
on_cpu               0.669          # 10.71 / 16 cores
utime                49944.869
stime                265.709
nvcsw                10542389       # 27.33%
nivcsw               28035944       # 72.67%
inblock              88096          # 18.79/sec
onblock              4136           # 0.88/sec
cpu-clock            50157070996008 # 50157.071 seconds
task-clock           50166215178468 # 50166.215 seconds
page faults          27500955       # 548.197/sec
context switches     38601556       # 769.473/sec
cpu migrations       2041465        # 40.694/sec
major page faults    46             # 0.001/sec
minor page faults    27500909       # 548.196/sec
alignment faults     0              # 0.000/sec
emulation faults     0              # 0.000/sec
branches             6812057398539  # 21.566 branches per 1000 inst
branch misses        149765412660   # 2.20% branch miss
conditional          6812058478571  # 21.566 conditional branches per 1000 inst
indirect             2202417120955  # 6.973 indirect branches per 1000 inst
slots                306536509111490 #
retiring             140232905670943 # 45.7% (45.7%)
-- ucode             2752895743197  #     0.9%
-- fastpath          137480009927746 #    44.8%
frontend             34306137327121 # 11.2% (11.2%)
-- latency           26258728548842 #     8.6%
-- bandwidth         8047408778279  #     2.6%
backend              118976275623436 # 38.8% (38.8%)
-- cpu               58208559972379 #    19.0%
-- memory            60767715651057 #    19.8%
speculation          13128862043712 #  4.3% ( 4.3%)
-- branch mispredict 13020891939040 #     4.2%
-- pipeline restart  107970104672   #     0.0%
smt-contention       0              #  0.0% ( 0.0%)
cpu-cycles           136668286409257 # 1.86 GHz
instructions         242039315669235 # 1.77 IPC
l2 access            6583853889433  # 46.933 l2 access per 1000 inst
l2 miss              1277645992049  # 19.41% l2 miss
Process overview as expected a large number of processes and at times many runnable processes so this benchmark is a good test of process creation for short-lived processes.
17100 processes
	16675 lc0                  41020472.95 418368.36
	136 clinfo                  37.67    14.71
	 38 vulkaninfo               1.14     1.52
	  6 php                      0.21     0.38
	  6 glxinfo:gdrv0            0.16     0.10
	  4 vulkani:disk$0           0.12     0.16
	  2 glxinfo                  0.08     0.04
	  2 glxinfo:cs0              0.08     0.04
	  2 glxinfo:disk$0           0.08     0.04
	  2 glxinfo:sh0              0.08     0.04
	  2 glxinfo:shlo0            0.08     0.04
	  2 llvmpipe-0               0.06     0.08
	  2 llvmpipe-1               0.06     0.08
	  2 llvmpipe-10              0.06     0.08
	  2 llvmpipe-11              0.06     0.08
	  2 llvmpipe-12              0.06     0.08
	  2 llvmpipe-13              0.06     0.08
	  2 llvmpipe-14              0.06     0.08
	  2 llvmpipe-15              0.06     0.08
	  2 llvmpipe-2               0.06     0.08
	  2 llvmpipe-3               0.06     0.08
	  2 llvmpipe-4               0.06     0.08
	  2 llvmpipe-5               0.06     0.08
	  2 llvmpipe-6               0.06     0.08
	  2 llvmpipe-7               0.06     0.08
	  2 llvmpipe-8               0.06     0.08
	  2 llvmpipe-9               0.06     0.08
	  6 clang                    0.06     0.02
	  3 rocminfo                 0.03     0.00
	  1 lspci                    0.01     0.02
	 86 sh                       0.00     0.00
	 13 gcc                      0.00     0.00
	 12 gsettings                0.00     0.00
	  9 lczero                   0.00     0.00
	  8 stat                     0.00     0.00
	  8 systemd-detect-          0.00     0.00
	  6 llvm-link                0.00     0.00
	  5 phoronix-test-s          0.00     0.00
	  3 gmain                    0.00     0.00
	  2 cc                       0.00     0.00
	  2 lscpu                    0.00     0.00
	  2 uname                    0.00     0.00
	  2 which                    0.00     0.00
	  2 xset                     0.00     0.00
	  1 date                     0.00     0.00
	  1 dconf worker             0.00     0.00
	  1 dirname                  0.00     0.00
	  1 dmesg                    0.00     0.00
	  1 dmidecode                0.00     0.00
	  1 grep                     0.00     0.00
	  1 ifconfig                 0.00     0.00
	  1 ip                       0.00     0.00
	  1 lsmod                    0.00     0.00
	  1 mktemp                   0.00     0.00
	  1 ps                       0.00     0.00
	  1 qdbus                    0.00     0.00
	  1 readlink                 0.00     0.00
	  1 realpath                 0.00     0.00
	  1 sed                      0.00     0.00
	  1 sort                     0.00     0.00
	  1 stty                     0.00     0.00
	  1 systemctl                0.00     0.00
	  1 template.sh              0.00     0.00
	  1 wc                       0.00     0.00
	  1 xrandr                   0.00     0.00
0 processes running
108 maximum processes