
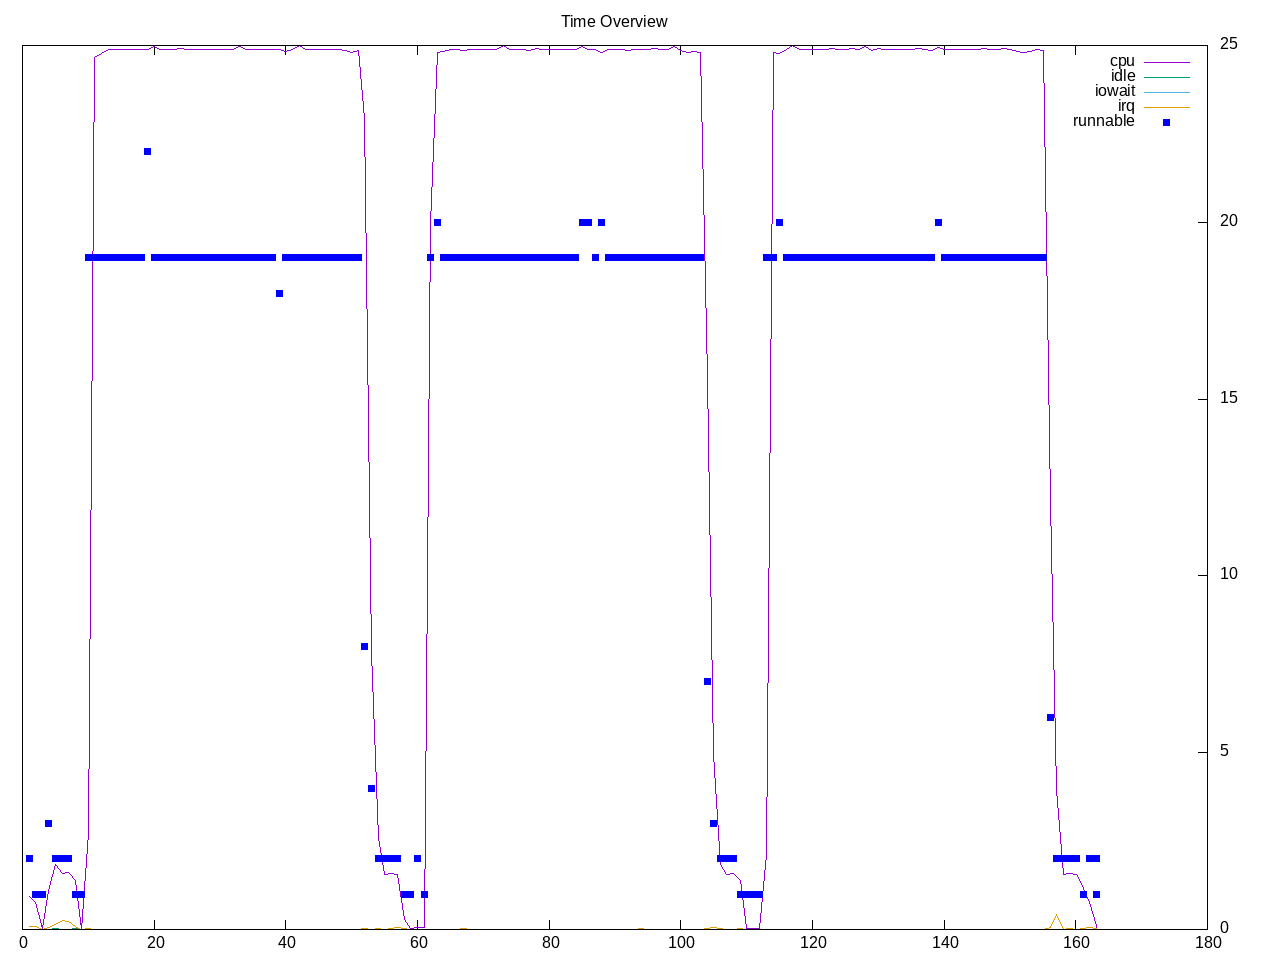
This workload builds mesa with Meson/Ninja. There is one build and it completes within a minute. Looks like a classic parallel compile followed by a link step.
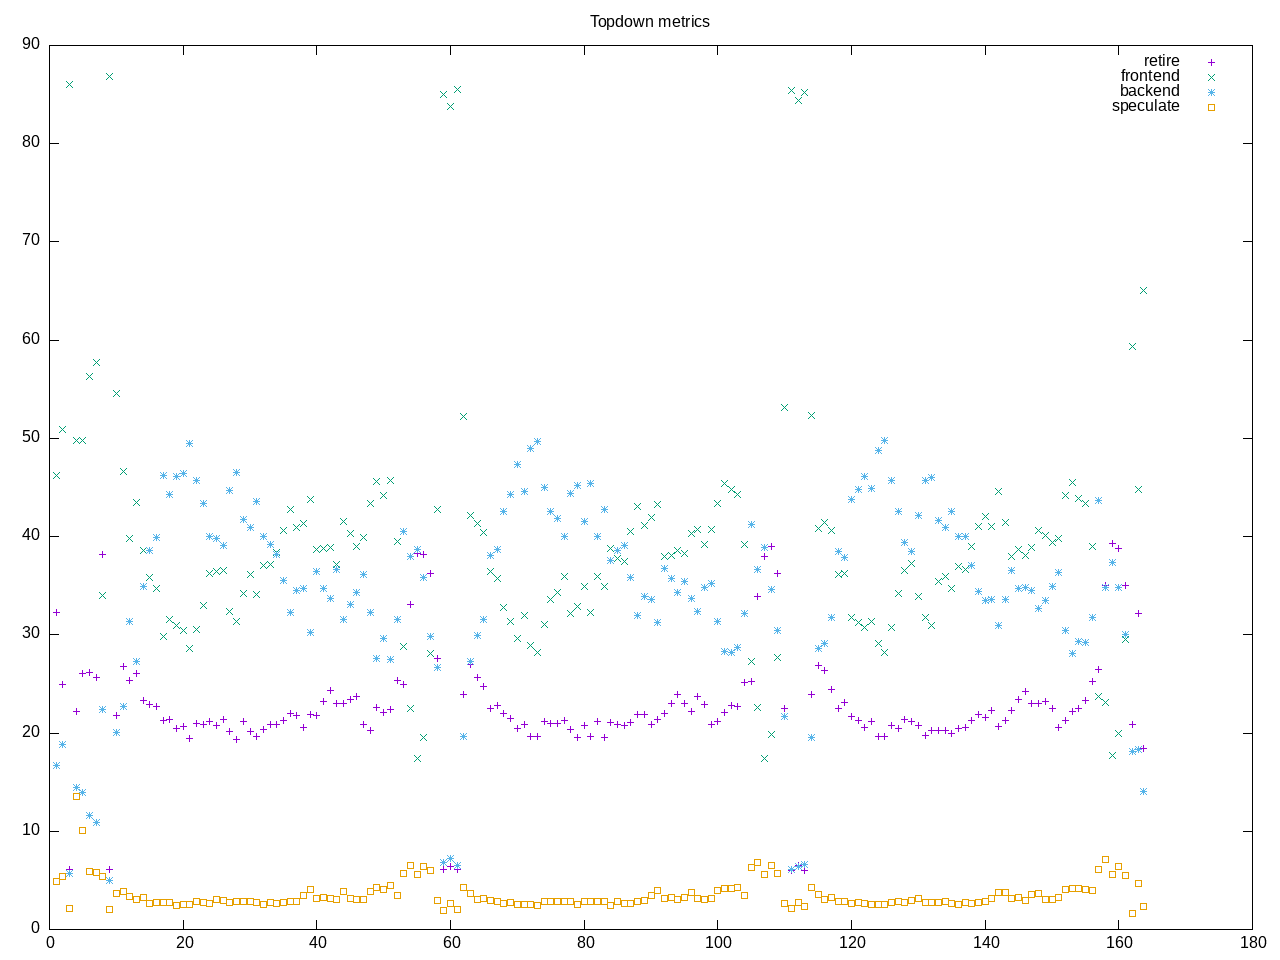
Topdown profile shows a mix of frontend and backend stalls and a relatively low retirement rate.
AMD metrics shows little floating point, and a matched frontend and backend stalls.
elapsed              163.906
on_cpu               0.790          # 12.63 / 16 cores
utime                1886.195
stime                184.596
nvcsw                56848          # 30.87%
nivcsw               127332         # 69.13%
inblock              0              # 0.00/sec
onblock              1388432        # 8470.91/sec
cpu-clock            2071048415957  # 2071.048 seconds
task-clock           2071106212462  # 2071.106 seconds
page faults          46543416       # 22472.733/sec
context switches     175524         # 84.749/sec
cpu migrations       10132          # 4.892/sec
major page faults    227            # 0.110/sec
minor page faults    46543189       # 22472.623/sec
alignment faults     0              # 0.000/sec
emulation faults     0              # 0.000/sec
branches             1908130912209  # 209.412 branches per 1000 inst
branch misses        40968023376    # 2.15% branch miss
conditional          1480230238727  # 162.451 conditional branches per 1000 inst
indirect             40444519371    # 4.439 indirect branches per 1000 inst
cpu-cycles           8202524114175  # 3.13 GHz
instructions         9044347511904  # 1.10 IPC
slots                16590148343382 #
retiring             2965706690130  # 17.9% (22.1%)
-- ucode             3755874833     #     0.0%
-- fastpath          2961950815297  #    17.9%
frontend             5025041411180  # 30.3% (37.4%)
-- latency           3597710893644  #    21.7%
-- bandwidth         1427330517536  #     8.6%
backend              5007168083459  # 30.2% (37.3%)
-- cpu               516986356812   #     3.1%
-- memory            4490181726647  #    27.1%
speculation          426799538910   #  2.6% ( 3.2%)
-- branch mispredict 420334664273   #     2.5%
-- pipeline restart  6464874637     #     0.0%
smt-contention       3165401829088  # 19.1% ( 0.0%)
cpu-cycles           8203295377763  # 3.12 GHz
instructions         9043102000155  # 1.10 IPC
instructions         3031177228591  # 42.544 l2 access per 1000 inst
l2 hit from l1       110789101776   # 18.69% l2 miss
l2 miss from l1      14472622849    #
l2 hit from l2 pf    8540442057     #
l3 hit from l2 pf    4207616137     #
l3 miss from l2 pf   5421033171     #
instructions         3032329413889  # 27.021 float per 1000 inst
float 512            3821           # 0.000 AVX-512 per 1000 inst
float 256            21829          # 0.000 AVX-256 per 1000 inst
float 128            81936088066    # 27.021 AVX-128 per 1000 inst
float MMX            0              # 0.000 MMX per 1000 inst
float scalar         242            # 0.000 scalar per 1000 inst
instructions         2700323        #
opcache              994769         # 368.389 opcache per 1000 inst
opcache miss         529578         # 53.2% opcache miss rate
l1 dTLB miss         7107           # 2.632 L1 dTLB per 1000 inst
l2 dTLB miss         1281           # 0.474 L2 dTLB per 1000 inst
instructions         2728917        #
icache               1334652        # 489.078 icache per 1000 inst
icache miss          113690         #  8.5% icache miss rate
l1 iTLB miss         9              # 0.003 L1 iTLB per 1000 inst
l2 iTLB miss         0              # 0.000 L2 iTLB per 1000 inst
tlb flush            19             # 0.007 TLB flush per 1000 inst
Intel metrics
elapsed              184.657
on_cpu               0.809          # 12.94 / 16 cores
utime                2241.613
stime                148.765
nvcsw                62568          # 32.87%
nivcsw               127758         # 67.13%
inblock              80336          # 435.05/sec
onblock              1376936        # 7456.72/sec
cpu-clock            2390480847282  # 2390.481 seconds
task-clock           2390536091411  # 2390.536 seconds
page faults          46530259       # 19464.362/sec
context switches     181420         # 75.891/sec
cpu migrations       9724           # 4.068/sec
major page faults    356            # 0.149/sec
minor page faults    46529903       # 19464.213/sec
alignment faults     0              # 0.000/sec
emulation faults     0              # 0.000/sec
branches             1887470376627  # 207.923 branches per 1000 inst
branch misses        31867530246    # 1.69% branch miss
conditional          1887470750355  # 207.923 conditional branches per 1000 inst
indirect             345061524941   # 38.012 indirect branches per 1000 inst
slots                11549890613120 #
retiring             4718273251825  # 40.9% (40.9%)
-- ucode             332523494430   #     2.9%
-- fastpath          4385749757395  #    38.0%
frontend             3969971068077  # 34.4% (34.4%)
-- latency           1939167474365  #    16.8%
-- bandwidth         2030803593712  #    17.6%
backend              1474722638981  # 12.8% (12.8%) low
-- cpu               517748601643   #     4.5%
-- memory            956974037338   #     8.3%
speculation          1398329649193  # 12.1% (12.1%) high
-- branch mispredict 1345271527912  #    11.6%
-- pipeline restart  53058121281    #     0.5%
smt-contention       0              #  0.0% ( 0.0%)
cpu-cycles           4624134244003  # 1.59 GHz
instructions         6236380120473  # 1.35 IPC
l2 access            223293941969   # 44.844 l2 access per 1000 inst
l2 miss              58309315082    # 26.11% l2 miss
cpu-cycles           3684561267847  # 32.2% memory latency
load stalls          1147424510193  #  7.3% l1 bound
l1 miss              878932569967   #  9.4% l2 bound
l2 miss              534380656444   #  3.0% l3 bound
l3 miss              424413292847   # 11.5% dram bound
store_stalls         37966466834    #  1.0% store bound
Process overview shows most time in the compiler front ends with more C than C++.
11662 processes
	2192 cc1                   1436.56    95.98
	380 cc1plus                340.45    35.68
	138 python3                 38.39     1.64
	114 meson                   25.38     2.85
	 68 clinfo                  18.50     5.34
	2560 as                       6.20     0.43
	106 dpkg-architectu          2.42     0.26
	 18 m4                       2.13     0.00
	 38 vulkaninfo               1.49     0.95
	 75 ld                       1.02     0.58
	  1 xz                       0.79     0.03
	 16 ninja                    0.52     0.75
	  4 vulkani:disk$0           0.15     0.10
	  6 glxinfo:gdrv0            0.10     0.04
	  6 glxinfo:gl0              0.10     0.04
	  4 cmake                    0.09     0.04
	 46 ar                       0.08     0.24
	  2 llvmpipe-0               0.08     0.05
	  2 llvmpipe-1               0.08     0.05
	  2 llvmpipe-10              0.08     0.05
	  2 llvmpipe-11              0.08     0.05
	  2 llvmpipe-12              0.08     0.05
	  2 llvmpipe-13              0.08     0.05
	  2 llvmpipe-14              0.08     0.05
	  2 llvmpipe-15              0.08     0.05
	  2 llvmpipe-2               0.08     0.05
	  2 llvmpipe-3               0.08     0.05
	  2 llvmpipe-4               0.08     0.05
	  2 llvmpipe-5               0.08     0.05
	  2 llvmpipe-6               0.08     0.05
	  2 llvmpipe-7               0.08     0.05
	  2 llvmpipe-8               0.08     0.05
	  2 llvmpipe-9               0.08     0.05
	  6 php                      0.07     0.11
	 10 bison                    0.07     0.00
	  6 clang                    0.06     0.06
	  2 glxinfo                  0.06     0.02
	  2 glxinfo:cs0              0.05     0.02
	  2 glxinfo:disk$0           0.05     0.02
	  2 glxinfo:sh0              0.05     0.02
	  2 glxinfo:shlo0            0.05     0.02
	  3 rocminfo                 0.03     0.00
	  1 tar                      0.02     0.40
	  1 lspci                    0.01     0.02
	 46 rm                       0.00     0.25
	  3 cp                       0.00     0.02
	2753 sh                       0.00     0.00
	2211 cc                       0.00     0.00
	393 c++                      0.00     0.00
	119 gcc                      0.00     0.00
	 75 collect2                 0.00     0.00
	 47 pkg-config               0.00     0.00
	 46 gcc-ar                   0.00     0.00
	 27 flex                     0.00     0.00
	  8 gsettings                0.00     0.00
	  8 stat                     0.00     0.00
	  8 systemd-detect-          0.00     0.00
	  8 uname                    0.00     0.00
	  6 llvm-link                0.00     0.00
	  5 gmain                    0.00     0.00
	  5 phoronix-test-s          0.00     0.00
	  4 bash                     0.00     0.00
	  3 build-mesa               0.00     0.00
	  3 dconf worker             0.00     0.00
	  3 git                      0.00     0.00
	  3 nm                       0.00     0.00
	  3 readelf                  0.00     0.00
	  2 lscpu                    0.00     0.00
	  2 output.exe               0.00     0.00
	  2 python                   0.00     0.00
	  2 sanitycheckc.ex          0.00     0.00
	  2 sanitycheckcpp.          0.00     0.00
	  2 which                    0.00     0.00
	  2 xset                     0.00     0.00
	  1 date                     0.00     0.00
	  1 dirname                  0.00     0.00
	  1 dmesg                    0.00     0.00
	  1 dmidecode                0.00     0.00
	  1 grep                     0.00     0.00
	  1 ifconfig                 0.00     0.00
	  1 ip                       0.00     0.00
	  1 lsmod                    0.00     0.00
	  1 mktemp                   0.00     0.00
	  1 ps                       0.00     0.00
	  1 qdbus                    0.00     0.00
	  1 readlink                 0.00     0.00
	  1 realpath                 0.00     0.00
	  1 sed                      0.00     0.00
	  1 sort                     0.00     0.00
	  1 stty                     0.00     0.00
	  1 systemctl                0.00     0.00
	  1 template.sh              0.00     0.00
	  1 wc                       0.00     0.00
	  1 xrandr                   0.00     0.00
0 processes running
66 maximum processes