
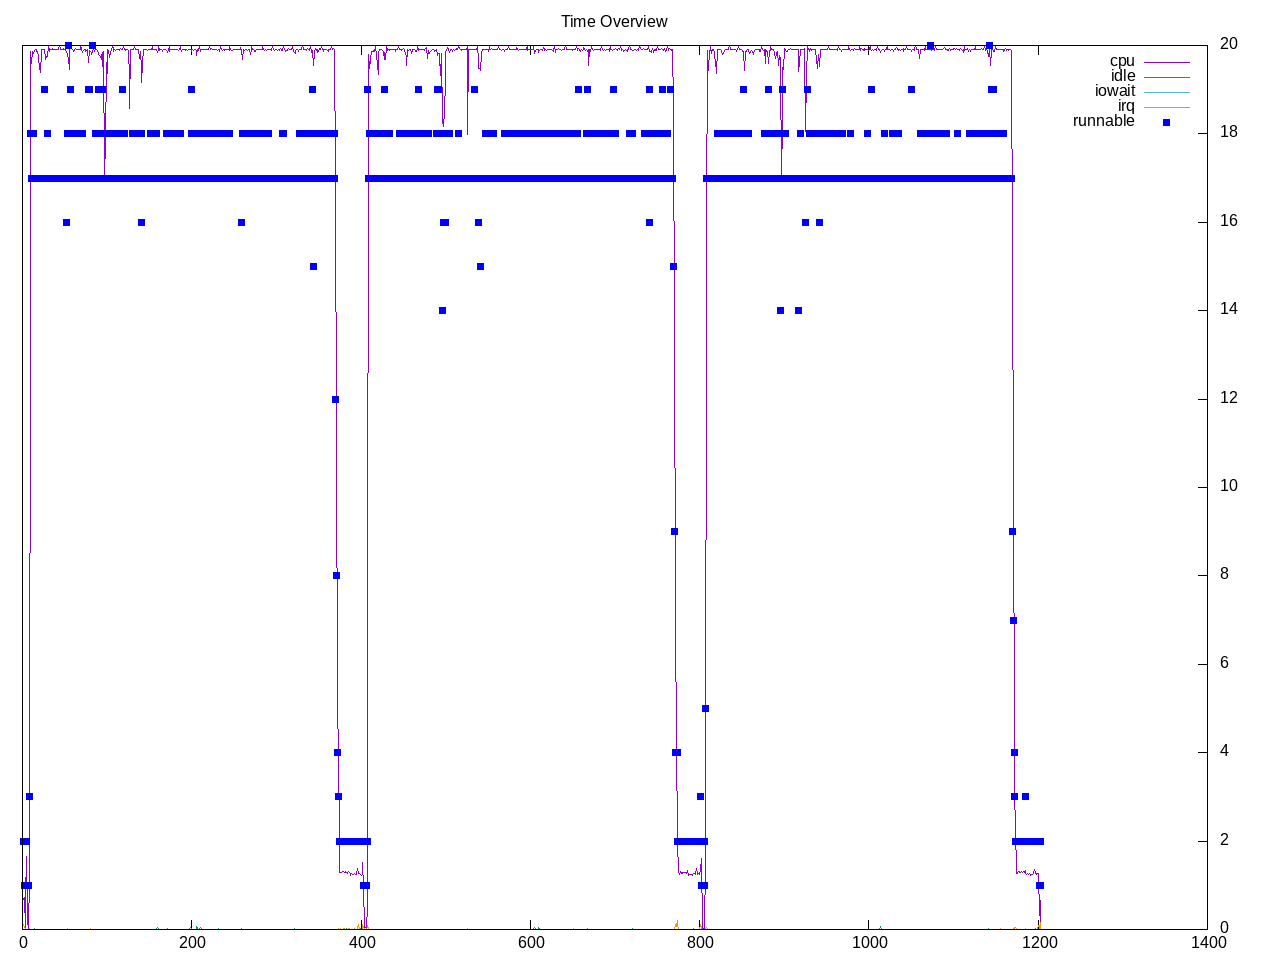
Another build-centric benchmark dominated by compiler front end and mostly parallel followed by a link phase.
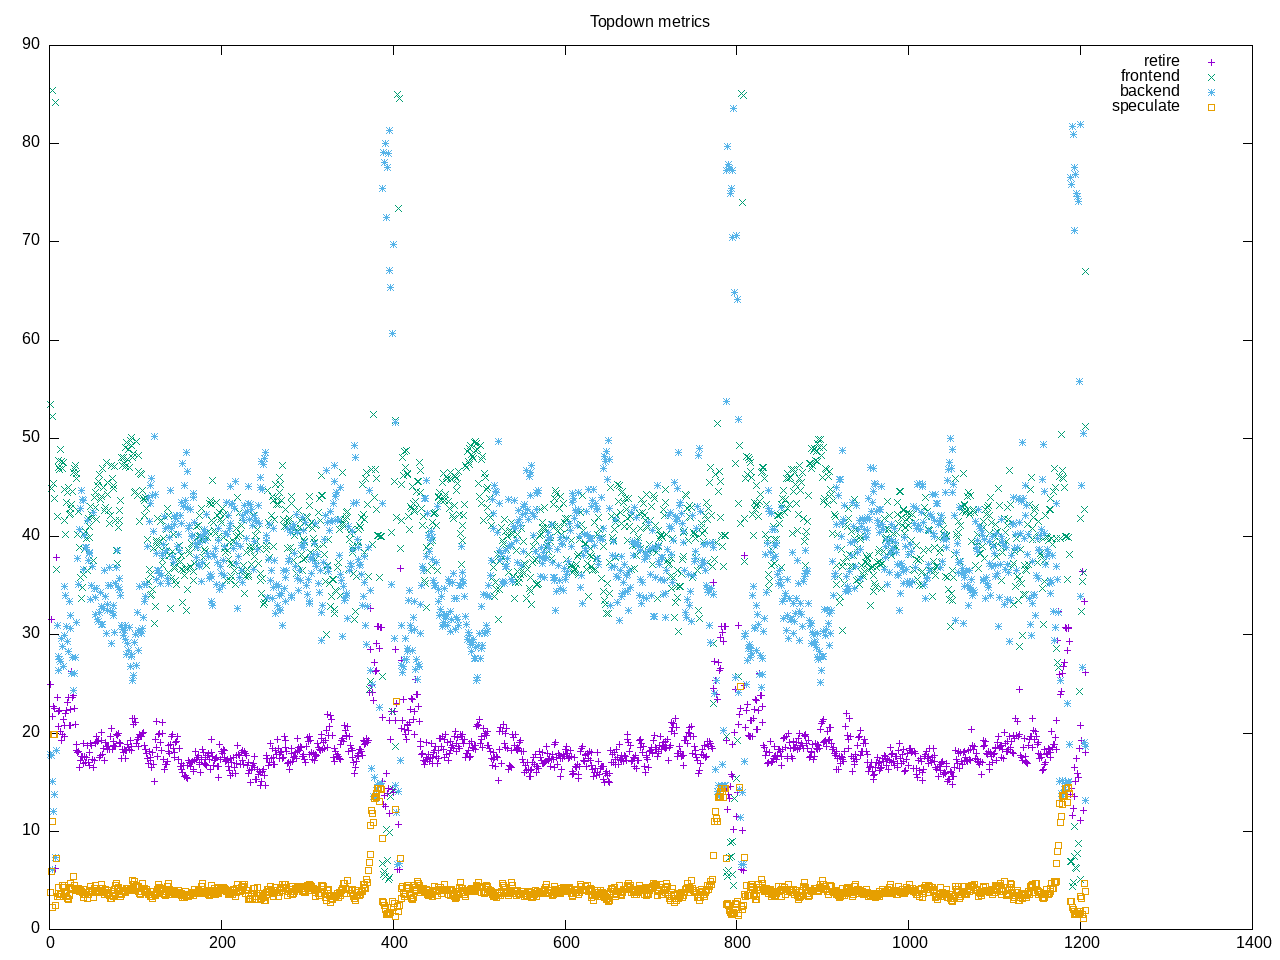
Topdown metrics show a ramp on speculation during link phase and blend of frontend/backend stalls.
AMD metrics shows little floating point, many branches and an IPC around 1.0.
elapsed              1209.646
on_cpu               0.906          # 14.50 / 16 cores
utime                16519.900
stime                1014.098
nvcsw                870298         # 46.35%
nivcsw               1007364        # 53.65%
inblock              0              # 0.00/sec
onblock              13716552       # 11339.32/sec
cpu-clock            17535509773276 # 17535.510 seconds
task-clock           17535816122214 # 17535.816 seconds
page faults          288202538      # 16435.080/sec
context switches     1860166        # 106.078/sec
cpu migrations       31998          # 1.825/sec
major page faults    97             # 0.006/sec
minor page faults    288202435      # 16435.074/sec
alignment faults     0              # 0.000/sec
emulation faults     0              # 0.000/sec
branches             13626065868231 # 209.661 branches per 1000 inst
branch misses        407816179504   # 2.99% branch miss
conditional          10644722639658 # 163.788 conditional branches per 1000 inst
indirect             257241607611   # 3.958 indirect branches per 1000 inst
cpu-cycles           70873262391853 # 3.66 GHz
instructions         64803873990344 # 0.91 IPC
slots                142119680279160 #
retiring             20893216343412 # 14.7% (18.2%)
-- ucode             15145956491    #     0.0%
-- fastpath          20878070386921 #    14.7%
frontend             46491196377863 # 32.7% (40.5%)
-- latency           35103877522542 #    24.7%
-- bandwidth         11387318855321 #     8.0%
backend              42764303377268 # 30.1% (37.3%)
-- cpu               4115333414431  #     2.9%
-- memory            38648969962837 #    27.2%
speculation          4525168748685  #  3.2% ( 3.9%)
-- branch mispredict 4476737300689  #     3.1%
-- pipeline restart  48431447996    #     0.0%
smt-contention       27445668415324 # 19.3% ( 0.0%)
cpu-cycles           70835468080231 # 3.66 GHz
instructions         64799283068727 # 0.91 IPC
instructions         21624883792394 # 53.559 l2 access per 1000 inst
l2 hit from l1       1002069490231  # 20.77% l2 miss
l2 miss from l1      161270628693   #
l2 hit from l2 pf    76862127113    #
l3 hit from l2 pf    34127710700    #
l3 miss from l2 pf   45151540732    #
instructions         21625304394577 # 21.554 float per 1000 inst
float 512            8922           # 0.000 AVX-512 per 1000 inst
float 256            122666         # 0.000 AVX-256 per 1000 inst
float 128            466116004804   # 21.554 AVX-128 per 1000 inst
float MMX            0              # 0.000 MMX per 1000 inst
float scalar         9              # 0.000 scalar per 1000 inst
Intel metrics
elapsed              1465.669
on_cpu               0.914          # 14.62 / 16 cores
utime                20583.894
stime                845.980
nvcsw                883632         # 46.18%
nivcsw               1029627        # 53.82%
inblock              110096         # 75.12/sec
onblock              13705448       # 9350.98/sec
cpu-clock            21430771564660 # 21430.772 seconds
task-clock           21431106614784 # 21431.107 seconds
page faults          288122656      # 13444.133/sec
context switches     1897821        # 88.555/sec
cpu migrations       31810          # 1.484/sec
major page faults    368            # 0.017/sec
minor page faults    288122282      # 13444.116/sec
alignment faults     0              # 0.000/sec
emulation faults     0              # 0.000/sec
branches             13534763529091 # 208.570 branches per 1000 inst
branch misses        362219734664   # 2.68% branch miss
conditional          13534764395363 # 208.570 conditional branches per 1000 inst
indirect             2456189343681  # 37.850 indirect branches per 1000 inst
slots                99044278024226 #
retiring             33495619918716 # 33.8% (33.8%)
-- ucode             2284626889225  #     2.3%
-- fastpath          31210993029491 #    31.5%
frontend             37200365452806 # 37.6% (37.6%)
-- latency           20617705320680 #    20.8%
-- bandwidth         16582660132126 #    16.7%
backend              13671188180151 # 13.8% (13.8%)
-- cpu               4628471163944  #     4.7%
-- memory            9042717016207  #     9.1%
speculation          14912895461976 # 15.1% (15.1%)
-- branch mispredict 14528811066191 #    14.7%
-- pipeline restart  384084395785   #     0.4%
smt-contention       0              #  0.0% ( 0.0%)
cpu-cycles           41887296280751 # 1.80 GHz
instructions         47005368323008 # 1.12 IPC
l2 access            2026495261939  # 56.492 l2 access per 1000 inst
l2 miss              544754847070   # 26.88% l2 miss
Process overview shows C++ frontend with less C.
27046 processes
	5016 cc1plus              15838.86   772.51
	 51 scons                 1466.35   106.62
	1368 cc1                    340.15    14.94
	6384 as                     120.25    15.40
	 68 clinfo                  17.04     5.99
	  3 ld                       7.94     2.62
	  3 xz                       3.41     0.11
	156 msgfmt                   2.41     0.10
	 38 vulkaninfo               1.52     0.77
	174 ar                       1.12     5.43
	174 ranlib                   1.00     5.69
	  6 php                      0.20     0.10
	  4 vulkani:disk$0           0.16     0.09
	  6 glxinfo:gdrv0            0.14     0.10
	  2 llvmpipe-0               0.08     0.05
	  2 llvmpipe-1               0.08     0.05
	  2 llvmpipe-10              0.08     0.05
	  2 llvmpipe-11              0.08     0.05
	  2 llvmpipe-12              0.08     0.05
	  2 llvmpipe-13              0.08     0.05
	  2 llvmpipe-14              0.08     0.05
	  2 llvmpipe-15              0.08     0.05
	  2 llvmpipe-3               0.08     0.05
	  2 llvmpipe-4               0.08     0.05
	  2 llvmpipe-5               0.08     0.05
	  2 llvmpipe-6               0.08     0.05
	  2 llvmpipe-7               0.08     0.05
	  2 llvmpipe-8               0.08     0.05
	  2 llvmpipe-9               0.08     0.05
	  2 llvmpipe-2               0.08     0.04
	  3 tar                      0.07     1.28
	  6 clang                    0.07     0.05
	  2 glxinfo                  0.06     0.04
	  2 glxinfo:cs0              0.06     0.04
	  2 glxinfo:disk$0           0.06     0.04
	  2 glxinfo:sh0              0.06     0.04
	  2 glxinfo:shlo0            0.06     0.04
	  4 rm                       0.01     1.17
	  1 lspci                    0.00     0.03
	7006 sh                       0.00     0.00
	5038 g++                      0.00     0.00
	1392 gcc                      0.00     0.00
	  8 gsettings                0.00     0.00
	  8 stat                     0.00     0.00
	  8 systemd-detect-          0.00     0.00
	  6 llvm-link                0.00     0.00
	  6 swig                     0.00     0.00
	  5 gmain                    0.00     0.00
	  5 phoronix-test-s          0.00     0.00
	  4 bash                     0.00     0.00
	  3 build-godot              0.00     0.00
	  3 collect2                 0.00     0.00
	  3 dconf worker             0.00     0.00
	  3 mv                       0.00     0.00
	  3 pkg-config               0.00     0.00
	  3 rocminfo                 0.00     0.00
	  2 cc                       0.00     0.00
	  2 lscpu                    0.00     0.00
	  2 uname                    0.00     0.00
	  2 which                    0.00     0.00
	  2 xset                     0.00     0.00
	  1 date                     0.00     0.00
	  1 dirname                  0.00     0.00
	  1 dmesg                    0.00     0.00
	  1 dmidecode                0.00     0.00
	  1 grep                     0.00     0.00
	  1 ifconfig                 0.00     0.00
	  1 ip                       0.00     0.00
	  1 lsmod                    0.00     0.00
	  1 mktemp                   0.00     0.00
	  1 ps                       0.00     0.00
	  1 python                   0.00     0.00
	  1 python3                  0.00     0.00
	  1 qdbus                    0.00     0.00
	  1 readlink                 0.00     0.00
	  1 realpath                 0.00     0.00
	  1 sed                      0.00     0.00
	  1 sort                     0.00     0.00
	  1 stty                     0.00     0.00
	  1 systemctl                0.00     0.00
	  1 template.sh              0.00     0.00
	  1 wc                       0.00     0.00
	  1 xrandr                   0.00     0.00
3 processes running
94 maximum processes