
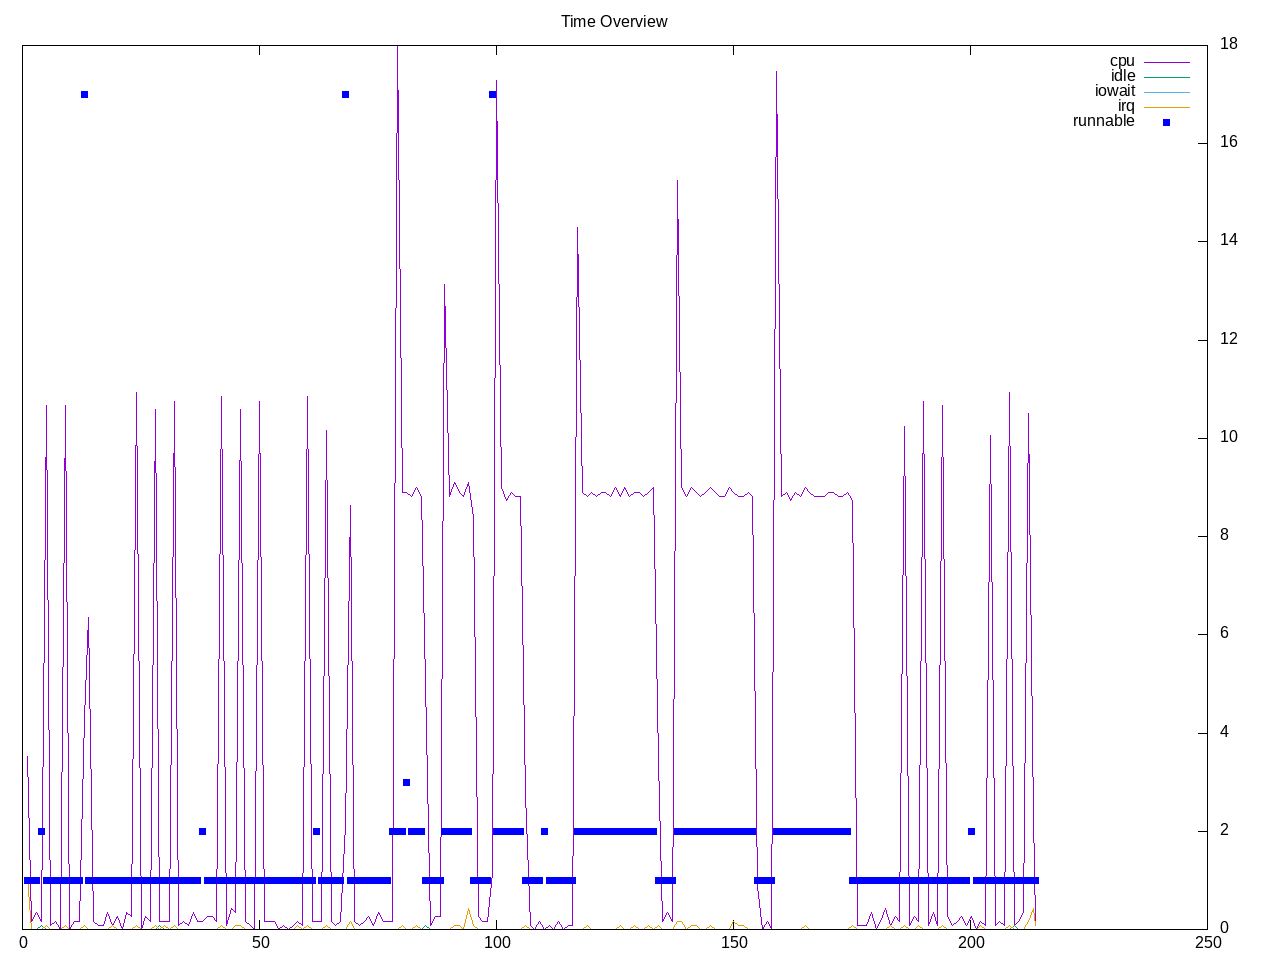
A suite of Python HPC benchmarks that run on both the CPU and the GPU. There are multiple backends but my system seemed to only have numpy available with JAX, Numba and Aesara missing and Tensorflow and Pytorch not chosen. So two workloads from twelve to run. This workload looks single-threaded in middle of the chart with edges being JAX, Numba and Aesara attempts.
Topdown profile shows a mix between workload attempts with frontend stalls on failing cases and backend stalls on passing ones.
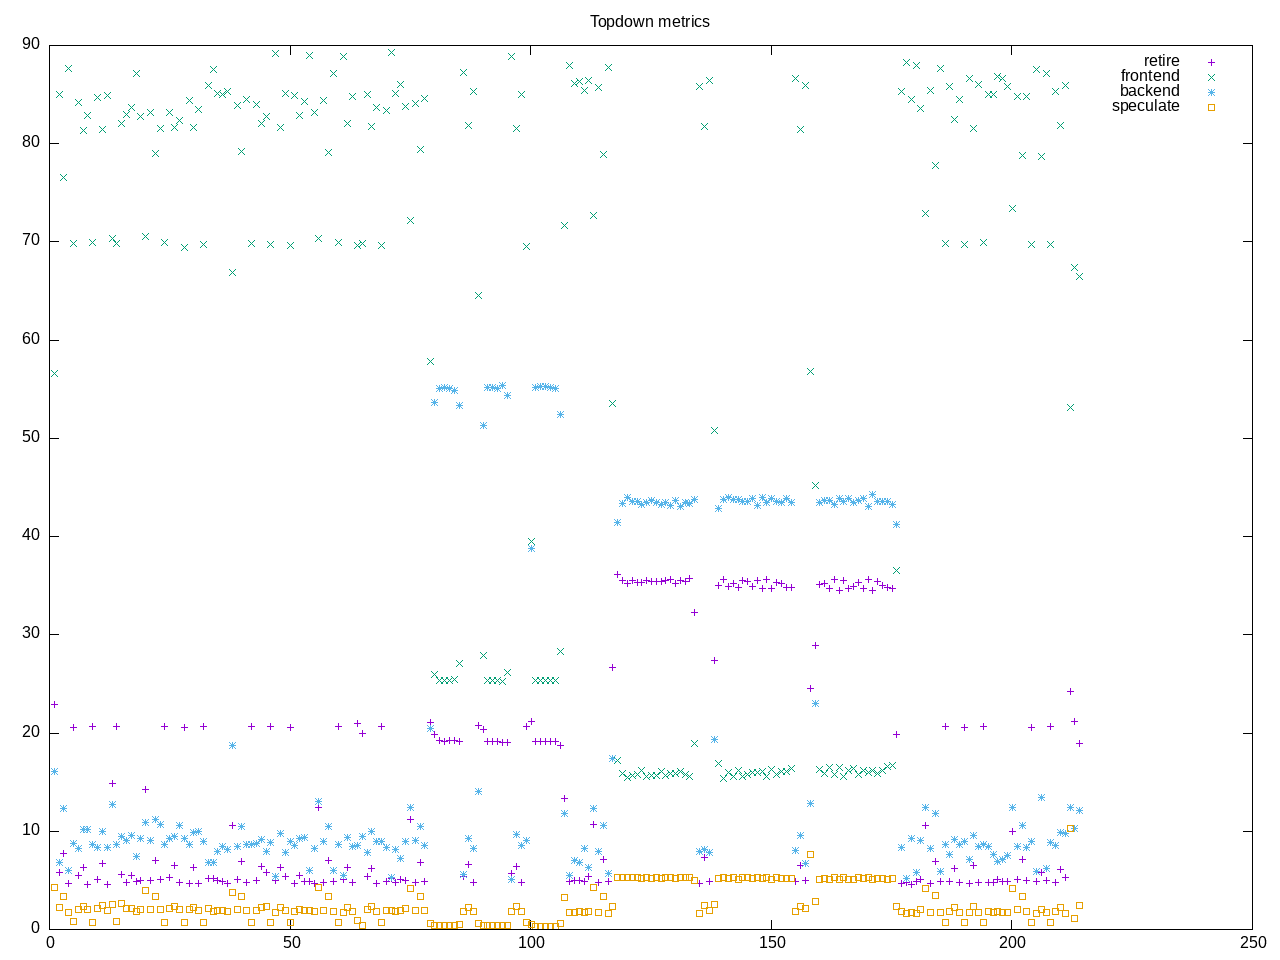
AMD metrics include some floating point and balance of frontend and backend stalls. I expect this can vary depending on backends chosen.
elapsed              214.590
on_cpu               0.029          # 0.46 / 16 cores
utime                65.401
stime                33.947
nvcsw                2373           # 70.79%
nivcsw               979            # 29.21%
inblock              0              # 0.00/sec
onblock              2256           # 10.51/sec
cpu-clock            99401250819    # 99.401 seconds
task-clock           99408371231    # 99.408 seconds
page faults          9395772        # 94516.909/sec
context switches     4242           # 42.672/sec
cpu migrations       222            # 2.233/sec
major page faults    0              # 0.000/sec
minor page faults    9395772        # 94516.909/sec
alignment faults     0              # 0.000/sec
emulation faults     0              # 0.000/sec
branches             103193296965   # 153.981 branches per 1000 inst
branch misses        4321031643     # 4.19% branch miss
conditional          61129993121    # 91.216 conditional branches per 1000 inst
indirect             10014830714    # 14.944 indirect branches per 1000 inst
cpu-cycles           421731065390   # 0.12 GHz
instructions         662316153608   # 1.57 IPC
slots                852041413506   #
retiring             239696482165   # 28.1% (29.0%)
-- ucode             1192405255     #     0.1%
-- fastpath          238504076910   #    28.0%
frontend             235886914660   # 27.7% (28.6%)
-- latency           182114380362   #    21.4%
-- bandwidth         53772534298    #     6.3%
backend              321872190110   # 37.8% (39.0%)
-- cpu               119350501661   #    14.0%
-- memory            202521688449   #    23.8%
speculation          28443856449    #  3.3% ( 3.4%)
-- branch mispredict 28180477317    #     3.3%
-- pipeline restart  263379132      #     0.0%
smt-contention       26141421008    #  3.1% ( 0.0%)
cpu-cycles           420627774223   # 0.12 GHz
instructions         667713898623   # 1.59 IPC
instructions         221072463900   # 81.519 l2 access per 1000 inst
l2 hit from l1       9622992118     # 31.34% l2 miss
l2 miss from l1      512043469      #
l2 hit from l2 pf    3262559785     #
l3 hit from l2 pf    3743710843     #
l3 miss from l2 pf   1392296327     #
instructions         222193823037   # 108.414 float per 1000 inst
float 512            58             # 0.000 AVX-512 per 1000 inst
float 256            95640867       # 0.430 AVX-256 per 1000 inst
float 128            23993315635    # 107.984 AVX-128 per 1000 inst
float MMX            0              # 0.000 MMX per 1000 inst
float scalar         40             # 0.000 scalar per 1000 inst
instructions         2376781        #
opcache              893250         # 375.823 opcache per 1000 inst
opcache miss         473918         # 53.1% opcache miss rate
l1 dTLB miss         4172           # 1.755 L1 dTLB per 1000 inst
l2 dTLB miss         1012           # 0.426 L2 dTLB per 1000 inst
instructions         2402871        #
icache               1176420        # 489.589 icache per 1000 inst
icache miss          108062         #  9.2% icache miss rate
l1 iTLB miss         10             # 0.004 L1 iTLB per 1000 inst
l2 iTLB miss         0              # 0.000 L2 iTLB per 1000 inst
tlb flush            20             # 0.008 TLB flush per 1000 inst
Intel metrics
elapsed              237.303
on_cpu               0.032          # 0.51 / 16 cores
utime                91.367
stime                29.632
nvcsw                2776           # 4.58%
nivcsw               57898          # 95.42%
inblock              30536          # 128.68/sec
onblock              2200           # 9.27/sec
cpu-clock            121049310913   # 121.049 seconds
task-clock           121056968018   # 121.057 seconds
page faults          9552684        # 78910.650/sec
context switches     61654          # 509.297/sec
cpu migrations       388            # 3.205/sec
major page faults    240            # 1.983/sec
minor page faults    9552444        # 78908.667/sec
alignment faults     0              # 0.000/sec
emulation faults     0              # 0.000/sec
branches             124270109121   # 151.128 branches per 1000 inst
branch misses        1427179445     # 1.15% branch miss
conditional          124270133921   # 151.128 conditional branches per 1000 inst
indirect             18073500647    # 21.980 indirect branches per 1000 inst
slots                2221669248344  #
retiring             747027275446   # 33.6% (33.6%)
-- ucode             73452005367    #     3.3%
-- fastpath          673575270079   #    30.3%
frontend             279668953965   # 12.6% (12.6%)
-- latency           122976164207   #     5.5%
-- bandwidth         156692789758   #     7.1%
backend              996700033973   # 44.9% (44.9%)
-- cpu               314848326319   #    14.2%
-- memory            681851707654   #    30.7%
speculation          205285930989   #  9.2% ( 9.2%)
-- branch mispredict 193227678611   #     8.7%
-- pipeline restart  12058252378    #     0.5%
smt-contention       0              #  0.0% ( 0.0%)
cpu-cycles           398681714399   # 0.11 GHz
instructions         745549574653   # 1.87 IPC
l2 access            45007184463    # 60.675 l2 access per 1000 inst
l2 miss              25658347372    # 57.01% l2 miss
cpu-cycles           397444517269   # 35.9% memory latency
load stalls          106883580882   #  0.0% l1 bound
l1 miss              123115394313   # 14.8% l2 bound
l2 miss              64305341449    #  6.9% l3 bound
l3 miss              36690735023    #  9.2% dram bound
store_stalls         35742162866    #  9.0% store bound
Process summary highlights these are python driven tests.
661 processes
	385 python3               1031.50   534.99
	 38 vulkaninfo               1.51     1.34
	  6 glxinfo:gdrv0            0.19     0.07
	  6 glxinfo:gl0              0.19     0.07
	  4 vulkani:disk$0           0.16     0.15
	  6 php                      0.11     0.14
	  2 glxinfo                  0.09     0.03
	  2 glxinfo:cs0              0.09     0.03
	  2 glxinfo:disk$0           0.09     0.03
	  2 glxinfo:sh0              0.09     0.03
	  2 glxinfo:shlo0            0.09     0.03
	  2 llvmpipe-0               0.08     0.07
	  2 llvmpipe-1               0.08     0.07
	  2 llvmpipe-10              0.08     0.07
	  2 llvmpipe-11              0.08     0.07
	  2 llvmpipe-12              0.08     0.07
	  2 llvmpipe-13              0.08     0.07
	  2 llvmpipe-14              0.08     0.07
	  2 llvmpipe-15              0.08     0.07
	  2 llvmpipe-2               0.08     0.07
	  2 llvmpipe-3               0.08     0.07
	  2 llvmpipe-4               0.08     0.07
	  2 llvmpipe-5               0.08     0.07
	  2 llvmpipe-6               0.08     0.07
	  2 llvmpipe-7               0.08     0.07
	  2 llvmpipe-8               0.08     0.07
	  2 llvmpipe-9               0.08     0.07
	  1 lspci                    0.01     0.02
	  1 ps                       0.00     0.01
	 70 sh                       0.00     0.00
	 24 pyhpc                    0.00     0.00
	 12 gcc                      0.00     0.00
	 10 gsettings                0.00     0.00
	  8 stat                     0.00     0.00
	  8 systemd-detect-          0.00     0.00
	  5 phoronix-test-s          0.00     0.00
	  3 dconf worker             0.00     0.00
	  3 gmain                    0.00     0.00
	  2 clinfo                   0.00     0.00
	  2 lscpu                    0.00     0.00
	  2 uname                    0.00     0.00
	  2 which                    0.00     0.00
	  2 xset                     0.00     0.00
	  1 cc                       0.00     0.00
	  1 date                     0.00     0.00
	  1 dirname                  0.00     0.00
	  1 dmesg                    0.00     0.00
	  1 dmidecode                0.00     0.00
	  1 grep                     0.00     0.00
	  1 ifconfig                 0.00     0.00
	  1 ip                       0.00     0.00
	  1 lsmod                    0.00     0.00
	  1 mktemp                   0.00     0.00
	  1 readlink                 0.00     0.00
	  1 realpath                 0.00     0.00
	  1 sed                      0.00     0.00
	  1 sort                     0.00     0.00
	  1 stty                     0.00     0.00
	  1 systemctl                0.00     0.00
	  1 template.sh              0.00     0.00
	  1 wc                       0.00     0.00
	  1 xrandr                   0.00     0.00
0 processes running
47 maximum processes
Example execution block
      130168) pyhpc            cpu=3 start=78.30 finish=84.94
        130169) python3          cpu=12 start=78.30 finish=84.94
          130170) python3          cpu=13 start=78.33 finish=84.93
          130171) python3          cpu=6 start=78.33 finish=84.93
          130172) python3          cpu=15 start=78.33 finish=84.93
          130173) python3          cpu=0 start=78.33 finish=84.93
          130174) python3          cpu=9 start=78.33 finish=84.93
          130175) python3          cpu=2 start=78.33 finish=84.93
          130176) python3          cpu=11 start=78.33 finish=84.93
          130177) python3          cpu=4 start=78.33 finish=84.93
          130178) python3          cpu=14 start=78.34 finish=84.93
          130179) python3          cpu=7 start=78.34 finish=84.93
          130180) python3          cpu=8 start=78.34 finish=84.93
          130181) python3          cpu=1 start=78.34 finish=84.93
          130182) python3          cpu=5 start=78.34 finish=84.93
          130183) python3          cpu=10 start=78.34 finish=84.93
          130184) python3          cpu=3 start=78.34 finish=84.93
Overall a test that can be elaborated further to really exercise particular backends, though also not long running.