
A set of computing benchmarks that use OpenCL, OpenML and CUDA. The OpenCL ones fail leaving X workloads. A total of four workloads run correctly.
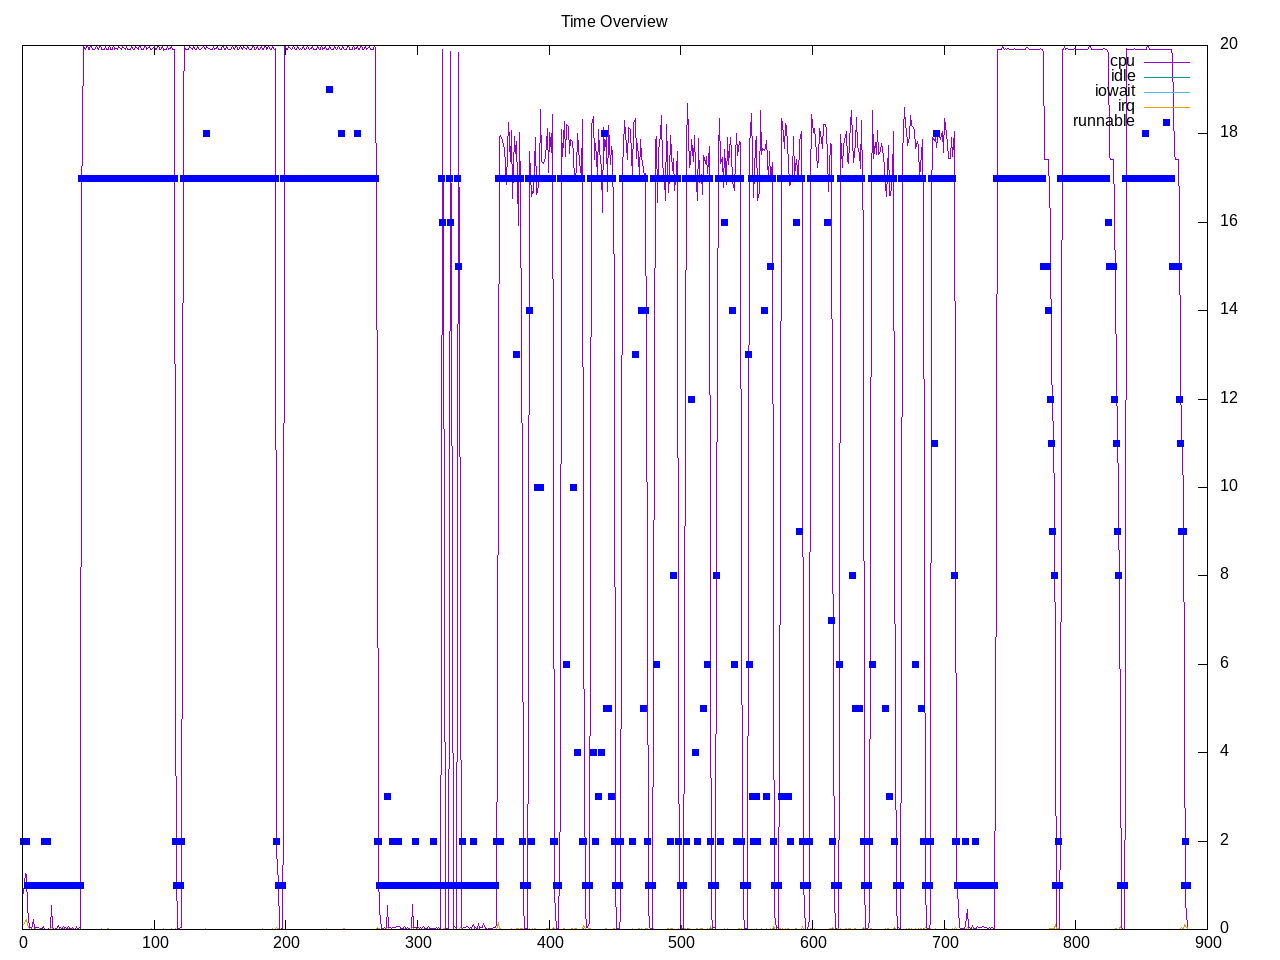
Topdown profile show workloads dominated by backend stalls.
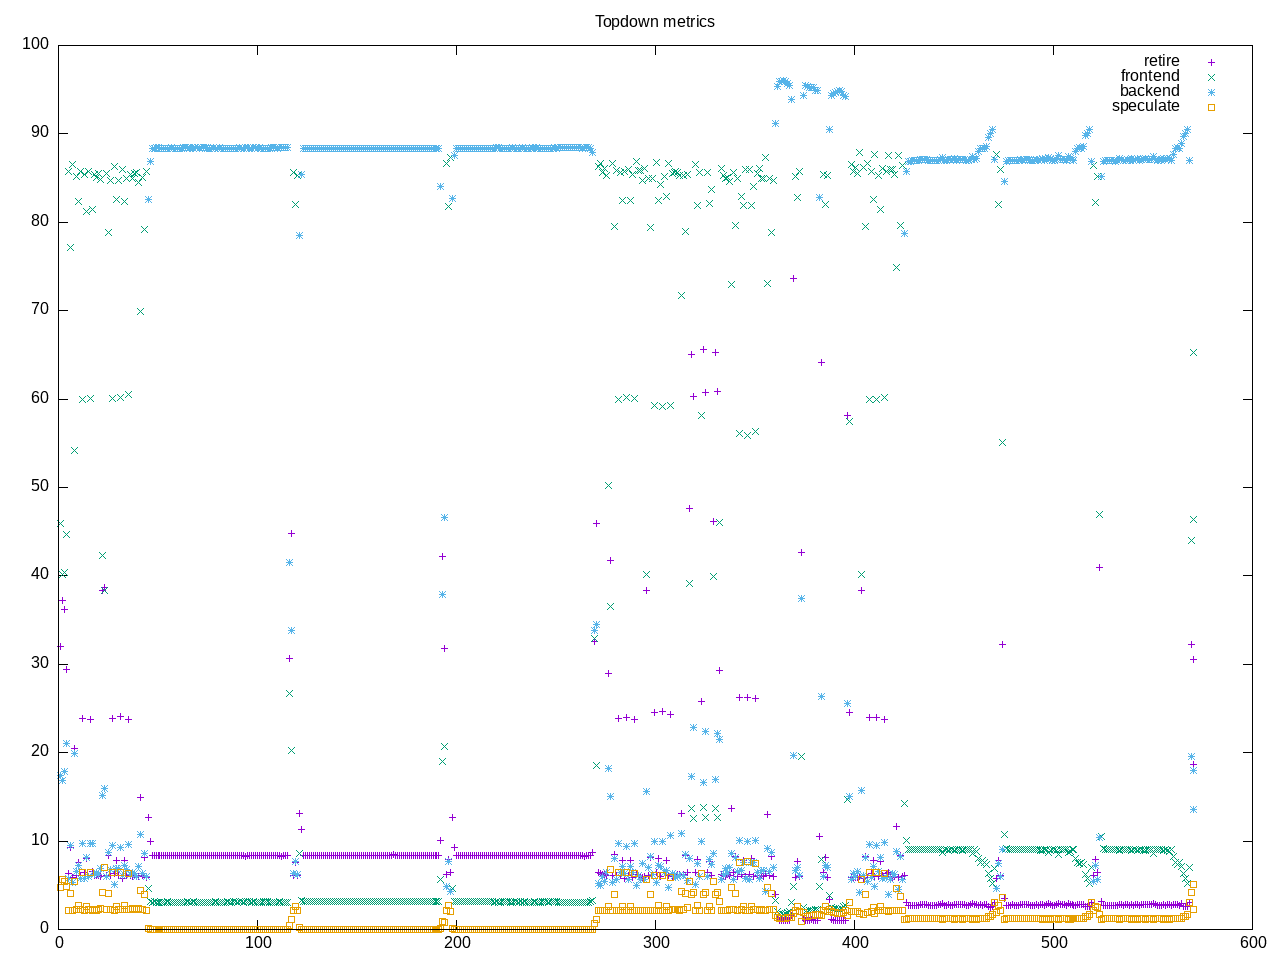
AMD metrics confirm high backend stalls and low factors of other stalls and retirement rates. This is floating point code with a low IPC.
elapsed              581.377
on_cpu               0.648          # 10.37 / 16 cores
utime                6019.004
stime                8.001
nvcsw                11085          # 16.04%
nivcsw               58007          # 83.96%
inblock              0              # 0.00/sec
onblock              618240         # 1063.41/sec
cpu-clock            6028754320350  # 6028.754 seconds
task-clock           6028877226692  # 6028.877 seconds
page faults          2529117        # 419.500/sec
context switches     71602          # 11.877/sec
cpu migrations       1516           # 0.251/sec
major page faults    13             # 0.002/sec
minor page faults    2529104        # 419.498/sec
alignment faults     0              # 0.000/sec
emulation faults     0              # 0.000/sec
branches             356376744888   # 41.762 branches per 1000 inst
branch misses        5808698352     # 1.63% branch miss
conditional          311127182240   # 36.460 conditional branches per 1000 inst
indirect             6537032472     # 0.766 indirect branches per 1000 inst
cpu-cycles           26789856580851 # 2.91 GHz
instructions         8523753717315  # 0.32 IPC low
slots                53574576334074 #
retiring             3037285457309  #  5.7% ( 6.9%) low
-- ucode             30795275761    #     0.1%
-- fastpath          3006490181548  #     5.6%
frontend             2105424630950  #  3.9% ( 4.8%) low
-- latency           1145189084004  #     2.1%
-- bandwidth         960235546946   #     1.8%
backend              38648611175245 # 72.1% (87.7%) high
-- cpu               17650289931049 #    32.9%
-- memory            20998321244196 #    39.2%
speculation          254667013033   #  0.5% ( 0.6%) low
-- branch mispredict 167646250146   #     0.3%
-- pipeline restart  87020762887    #     0.2%
smt-contention       9528539434241  # 17.8% ( 0.0%)
cpu-cycles           26694322086662 # 2.91 GHz
instructions         8523373024551  # 0.32 IPC low
instructions         2839498090258  # 49.711 l2 access per 1000 inst
l2 hit from l1       109922376042   # 29.68% l2 miss
l2 miss from l1      23104420522    #
l2 hit from l2 pf    12447739921    #
l3 hit from l2 pf    1892129919     #
l3 miss from l2 pf   16891383017    #
instructions         2839703362814  # 335.613 float per 1000 inst
float 512            126            # 0.000 AVX-512 per 1000 inst
float 256            926            # 0.000 AVX-256 per 1000 inst
float 128            953042328671   # 335.613 AVX-128 per 1000 inst
float MMX            0              # 0.000 MMX per 1000 inst
float scalar         5              # 0.000 scalar per 1000 inst
instructions         8524876284215  #
opcache              971449144496   # 113.955 opcache per 1000 inst
opcache miss         18397630060    #  1.9% opcache miss rate
l1 dTLB miss         19074903429    # 2.238 L1 dTLB per 1000 inst
l2 dTLB miss         15094481558    # 1.771 L2 dTLB per 1000 inst
instructions         8520906203159  #
icache               26149384533    # 3.069 icache per 1000 inst
icache miss          2194992940     #  8.4% icache miss rate
l1 iTLB miss         54453575       # 0.006 L1 iTLB per 1000 inst
l2 iTLB miss         0              # 0.000 L2 iTLB per 1000 inst
tlb flush            2101941        # 0.000 TLB flush per 1000 inst
Intel metrics show the L3 portion of memory stalls is the largest.
elapsed              1375.760
on_cpu               0.801          # 12.81 / 16 cores
utime                17614.523
stime                9.219
nvcsw                8620           # 6.50%
nivcsw               123986         # 93.50%
inblock              744            # 0.54/sec
onblock              804440         # 584.72/sec
cpu-clock            17625758069268 # 17625.758 seconds
task-clock           17625905653801 # 17625.906 seconds
page faults          4638836        # 263.183/sec
context switches     139046         # 7.889/sec
cpu migrations       4590           # 0.260/sec
major page faults    1              # 0.000/sec
minor page faults    4638835        # 263.183/sec
alignment faults     0              # 0.000/sec
emulation faults     0              # 0.000/sec
branches             419343046573   # 20.778 branches per 1000 inst
branch misses        4547421869     # 1.08% branch miss
conditional          419343085101   # 20.778 conditional branches per 1000 inst
indirect             67921372342    # 3.365 indirect branches per 1000 inst
slots                136495034123360 #
retiring             7814481448059  #  5.7% ( 5.7%) low
-- ucode             1698017378425  #     1.2%
-- fastpath          6116464069634  #     4.5%
frontend             5269661840749  #  3.9% ( 3.9%) low
-- latency           4422139728561  #     3.2%
-- bandwidth         847522112188   #     0.6%
backend              122695895540374 # 89.9% (89.9%) high
-- cpu               24290445256795 #    17.8%
-- memory            98405450283579 #    72.1%
speculation          1063790694054  #  0.8% ( 0.8%) low
-- branch mispredict 830124740747   #     0.6%
-- pipeline restart  233665953307   #     0.2%
smt-contention       0              #  0.0% ( 0.0%)
cpu-cycles           35539188290105 # 1.96 GHz
instructions         11454483768790 # 0.32 IPC low
l2 access            305084043503   # 38.065 l2 access per 1000 inst
l2 miss              118297250080   # 38.78% l2 miss
cpu-cycles           43478714436613 # 73.5% memory latency
load stalls          27281801869658 # 24.9% l1 bound
l1 miss              16441424261761 #  1.0% l2 bound
l2 miss              16022798500216 # 30.8% l3 bound
l3 miss              2650993519337  #  6.1% dram bound
store_stalls         4674882882278  # 10.8% store bound
Process overview shows different processes per workload.
1086 processes
	 48 lbm                  54292.96    24.48
	 48 mri-gridding         32846.56    11.68
	 48 stencil               6022.24     6.72
	 48 cutcp                 1348.80     4.48
	408 clinfo                  98.72    36.61
	 42 python2                  6.09     1.72
	 38 vulkaninfo               0.39     1.52
	  6 php                      0.09     0.32
	  6 glxinfo:gdrv0            0.08     0.10
	  6 glxinfo:gl0              0.08     0.10
	  3 ld                       0.05     0.03
	  4 vulkani:disk$0           0.04     0.16
	  6 clang                    0.04     0.05
	  2 glxinfo                  0.04     0.04
	  2 glxinfo:cs0              0.04     0.04
	  2 glxinfo:disk$0           0.04     0.04
	  2 glxinfo:sh0              0.04     0.04
	  2 glxinfo:shlo0            0.04     0.04
	  3 rocminfo                 0.03     0.00
	  2 llvmpipe-0               0.02     0.08
	  2 llvmpipe-1               0.02     0.08
	  2 llvmpipe-10              0.02     0.08
	  2 llvmpipe-11              0.02     0.08
	  2 llvmpipe-12              0.02     0.08
	  2 llvmpipe-13              0.02     0.08
	  2 llvmpipe-14              0.02     0.08
	  2 llvmpipe-15              0.02     0.08
	  2 llvmpipe-2               0.02     0.08
	  2 llvmpipe-3               0.02     0.08
	  2 llvmpipe-4               0.02     0.08
	  2 llvmpipe-5               0.02     0.08
	  2 llvmpipe-6               0.02     0.08
	  2 llvmpipe-7               0.02     0.08
	  2 llvmpipe-8               0.02     0.08
	  2 llvmpipe-9               0.02     0.08
	  1 lspci                    0.01     0.02
	145 sh                       0.00     0.00
	 60 make                     0.00     0.00
	 30 parboil                  0.00     0.00
	 13 gcc                      0.00     0.00
	 12 gsettings                0.00     0.00
	  8 stat                     0.00     0.00
	  8 systemd-detect-          0.00     0.00
	  6 llvm-link                0.00     0.00
	  5 phoronix-test-s          0.00     0.00
	  3 c++                      0.00     0.00
	  3 collect2                 0.00     0.00
	  3 gmain                    0.00     0.00
	  2 cc                       0.00     0.00
	  2 lscpu                    0.00     0.00
	  2 uname                    0.00     0.00
	  2 which                    0.00     0.00
	  2 xset                     0.00     0.00
	  1 date                     0.00     0.00
	  1 dconf worker             0.00     0.00
	  1 dirname                  0.00     0.00
	  1 dmesg                    0.00     0.00
	  1 dmidecode                0.00     0.00
	  1 grep                     0.00     0.00
	  1 ifconfig                 0.00     0.00
	  1 ip                       0.00     0.00
	  1 lsmod                    0.00     0.00
	  1 mktemp                   0.00     0.00
	  1 ps                       0.00     0.00
	  1 python                   0.00     0.00
	  1 python3                  0.00     0.00
	  1 qdbus                    0.00     0.00
	  1 readlink                 0.00     0.00
	  1 realpath                 0.00     0.00
	  1 sed                      0.00     0.00
	  1 sort                     0.00     0.00
	  1 stty                     0.00     0.00
	  1 systemctl                0.00     0.00
	  1 template.sh              0.00     0.00
	  1 wc                       0.00     0.00
	  1 xrandr                   0.00     0.00
0 processes running
47 maximum processes
An example computation block
      938107) parboil          cpu=7 start=121.12 finish=193.82
        938108) python2          cpu=8 start=121.12 finish=193.82
          938109) make             cpu=9 start=121.13 finish=121.14
          938110) make             cpu=10 start=121.14 finish=192.13
            938111) lbm              cpu=11 start=121.14 finish=192.13
              938112) lbm              cpu=13 start=121.14 finish=192.13
              938113) lbm              cpu=9 start=121.14 finish=192.13
              938114) lbm              cpu=4 start=121.14 finish=192.13
              938115) lbm              cpu=14 start=121.14 finish=192.13
              938116) lbm              cpu=7 start=121.14 finish=192.13
              938117) lbm              cpu=8 start=121.14 finish=192.13
              938118) lbm              cpu=10 start=121.14 finish=192.13
              938119) lbm              cpu=5 start=121.14 finish=192.13
              938120) lbm              cpu=12 start=121.14 finish=192.13
              938121) lbm              cpu=1 start=121.14 finish=192.13
              938122) lbm              cpu=15 start=121.14 finish=192.13
              938123) lbm              cpu=6 start=121.14 finish=192.13
              938124) lbm              cpu=0 start=121.14 finish=192.13
              938125) lbm              cpu=2 start=121.14 finish=192.13
              938126) lbm              cpu=3 start=121.14 finish=192.13