
nwchem is a computational chemistry package. It does not run successfully on AMD, running for ~2000 seconds before giving an error:
        The test quit with a non-zero exit status.
        E: dlerror: libelf.so.0: cannot open shared object file: No such file or directory
I couldn’t find libelf.so.0 anywhere. I tried putting i a link to libelf.so.1 and then got a different error
       The test quit with a non-zero exit status.
        E: MPI_ABORT was invoked on rank 3 in communicator MPI COMMUNICATOR 3 DUP FROM 0
It does run to completion with successful result on Intel CPU. A total of ~10,600 seconds.
It also runs successfully on my AMD 5950X system suggesting some form of software configuration issue.
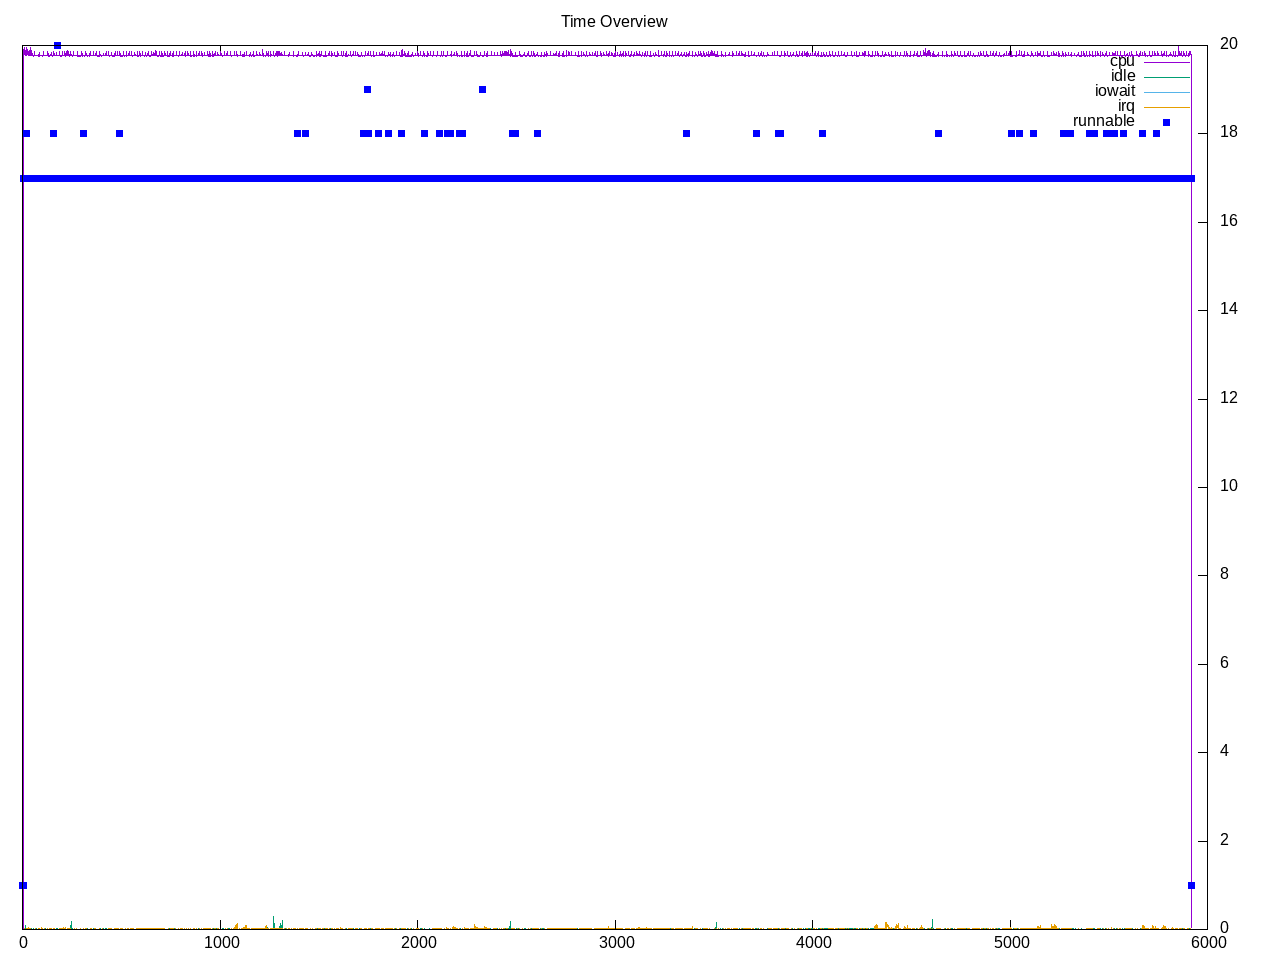
So below is a mixed report with Intel and AMD 5950X. Almost all the time running on all half the cores.
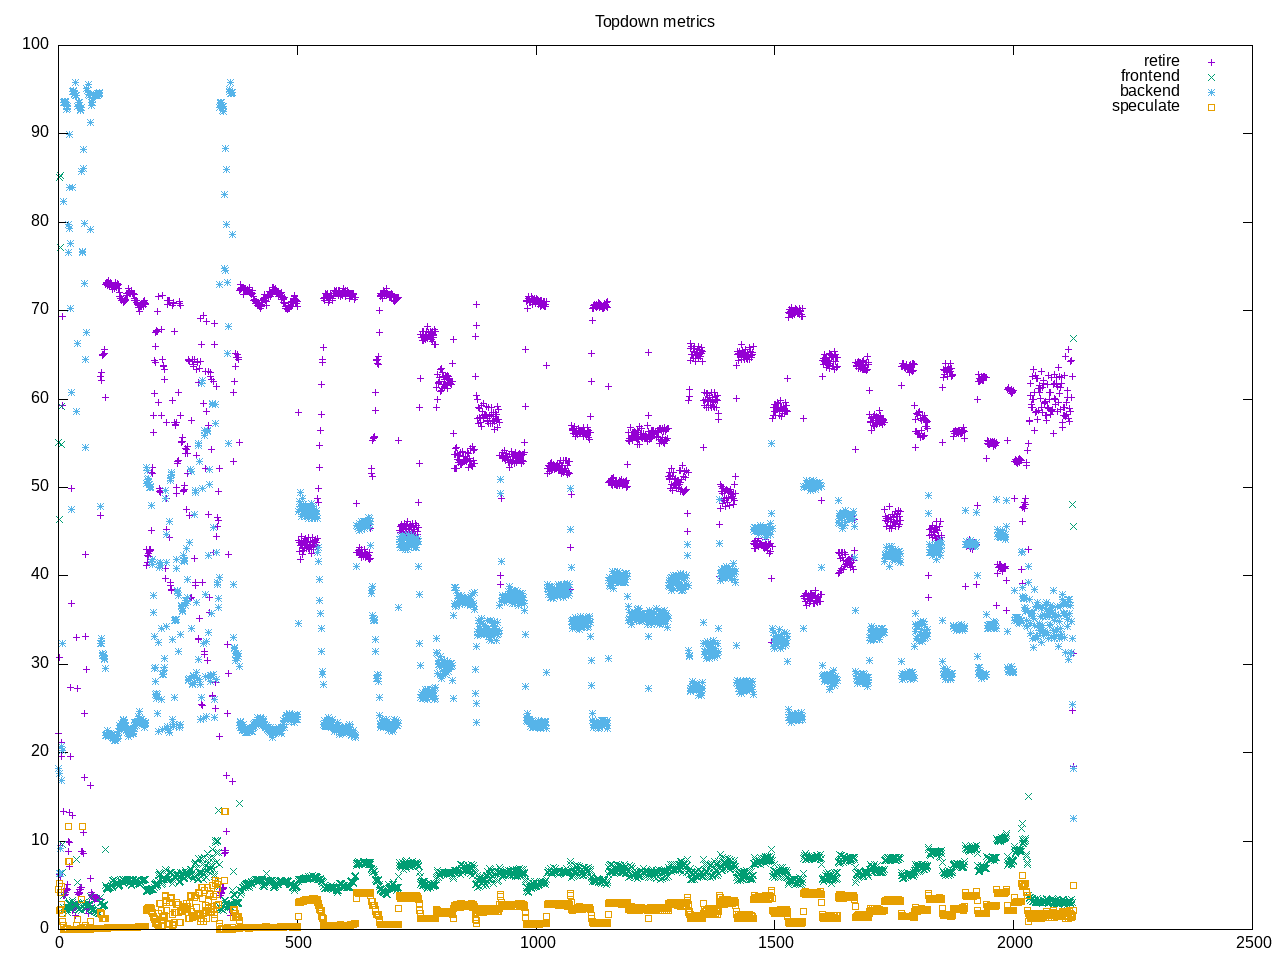
Topdown information was unavailable for 5950X, so below is Intel. It looks like it goes through some phases and is generally higher on retirement with some backend memory stalls.
AMD metrics. The way things crashed suggests we didn’t get an on-cpu metric.
elapsed              2107.596
on_cpu               0.000          # 0.00 / 16 cores
utime                1.093
stime                0.909
nvcsw                3372           # 89.14%
nivcsw               411            # 10.86%
inblock              0              # 0.00/sec
onblock              33792          # 16.03/sec
cpu-clock            16785304831788 # 16785.305 seconds
task-clock           16785348796091 # 16785.349 seconds
page faults          2128677        # 126.818/sec
context switches     48966          # 2.917/sec
cpu migrations       14815          # 0.883/sec
major page faults    239            # 0.014/sec
minor page faults    2128438        # 126.803/sec
alignment faults     0              # 0.000/sec
emulation faults     0              # 0.000/sec
branches             33479246026435 # 148.312 branches per 1000 inst
branch misses        127458036324   # 0.38% branch miss
conditional          24030811610464 # 106.455 conditional branches per 1000 inst
indirect             2579309668769  # 11.426 indirect branches per 1000 inst
cpu-cycles           68037069124892 # 2.04 GHz
instructions         220813779609057 # 3.25 IPC
slots                136078686006336 #
retiring             73750537214329 # 54.2% (54.2%)
-- ucode             73060690357    #     0.1%
-- fastpath          73677476523972 #    54.1%
frontend             8061338973687  #  5.9% ( 5.9%)
-- latency           3680832821736  #     2.7%
-- bandwidth         4380506151951  #     3.2%
backend              51412720610197 # 37.8% (37.8%)
-- cpu               11216925558536 #     8.2%
-- memory            40195795051661 #    29.5%
speculation          2804155947285  #  2.1% ( 2.1%)
-- branch mispredict 2735326057178  #     2.0%
-- pipeline restart  68829890107    #     0.1%
smt-contention       49897448637    #  0.0% ( 0.0%)
cpu-cycles           69546700318571 # 2.05 GHz
instructions         226896874160851 # 3.26 IPC
instructions         75649382586142 # 18.173 l2 access per 1000 inst
l2 hit from l1       874618649578   # 11.94% l2 miss
l2 miss from l1      61119177290    #
l2 hit from l2 pf    397180972301   #
l3 hit from l2 pf    77188601452    #
l3 miss from l2 pf   25794341549    #
instructions         75638056388884 # 127.044 float per 1000 inst
float 512            62             # 0.000 AVX-512 per 1000 inst
float 256            428            # 0.000 AVX-256 per 1000 inst
float 128            9609391251278  # 127.044 AVX-128 per 1000 inst
float MMX            0              # 0.000 MMX per 1000 inst
float scalar         6              # 0.000 scalar per 1000 inst
Intel metrics which should be more reliable. This shows it running on all cores without hyperthreading. It is otherwise a high-IPC code for both AMD and Intel processors.
elapsed              10630.268
on_cpu               0.749          # 11.99 / 16 cores
utime                127385.070
stime                67.039
nvcsw                31742          # 17.85%
nivcsw               146085         # 82.15%
inblock              772168         # 72.64/sec
onblock              2151752        # 202.42/sec
cpu-clock            127453492566651 # 127453.493 seconds
task-clock           127453630675965 # 127453.631 seconds
page faults          3561720        # 27.945/sec
context switches     230770         # 1.811/sec
cpu migrations       55849          # 0.438/sec
major page faults    2836           # 0.022/sec
minor page faults    3558884        # 27.923/sec
alignment faults     0              # 0.000/sec
emulation faults     0              # 0.000/sec
branches             135096634141195 # 144.395 branches per 1000 inst
branch misses        757304758313   # 0.56% branch miss
conditional          135096634154123 # 144.395 conditional branches per 1000 ins
t
indirect             48506429686542 # 51.845 indirect branches per 1000 inst
slots                1029829342912016 #
retiring             618366506443086 # 60.0% (60.0%)
-- ucode             31525787099198 #     3.1%
-- fastpath          586840719343888 #    57.0%
frontend             137399065336360 # 13.3% (13.3%)
-- latency           29711672373497 #     2.9%
-- bandwidth         107687392962863 #    10.5%
backend              227323923911572 # 22.1% (22.1%)
-- cpu               82567509824558 #     8.0%
-- memory            144756414087014 #    14.1%
speculation          39269377439642 #  3.8% ( 3.8%)
-- branch mispredict 36835817310632 #     3.6%
-- pipeline restart  2433560129010  #     0.2%
smt-contention       0              #  0.0% ( 0.0%)
cpu-cycles           515977732254096 # 2.19 GHz
instructions         2164504183925904 # 4.19 IPC
l2 access            5524495591811  # 7.655 l2 access per 1000 inst
l2 miss              1488213950053  # 26.94% l2 miss