
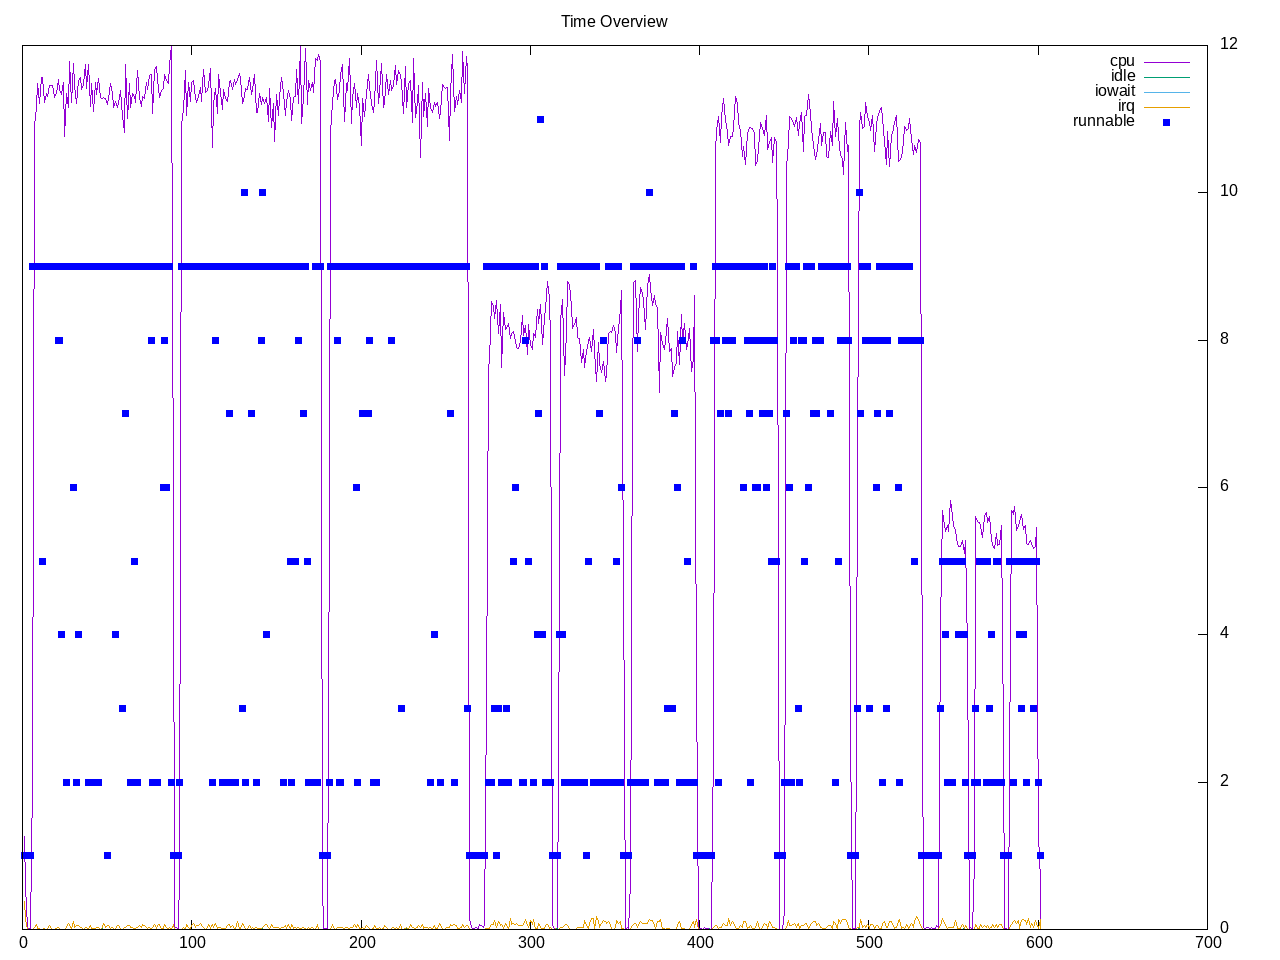
Video encoding using the Google libvpx library. There are four workloads, two for each of two speed levels and then for 4K and 1080p decoding. Looks like variable numbers of processes though one per physical core.
Topdown profil has slight differences in workloads, though fairly high retirement rate with backend stalls being the largest limiter.
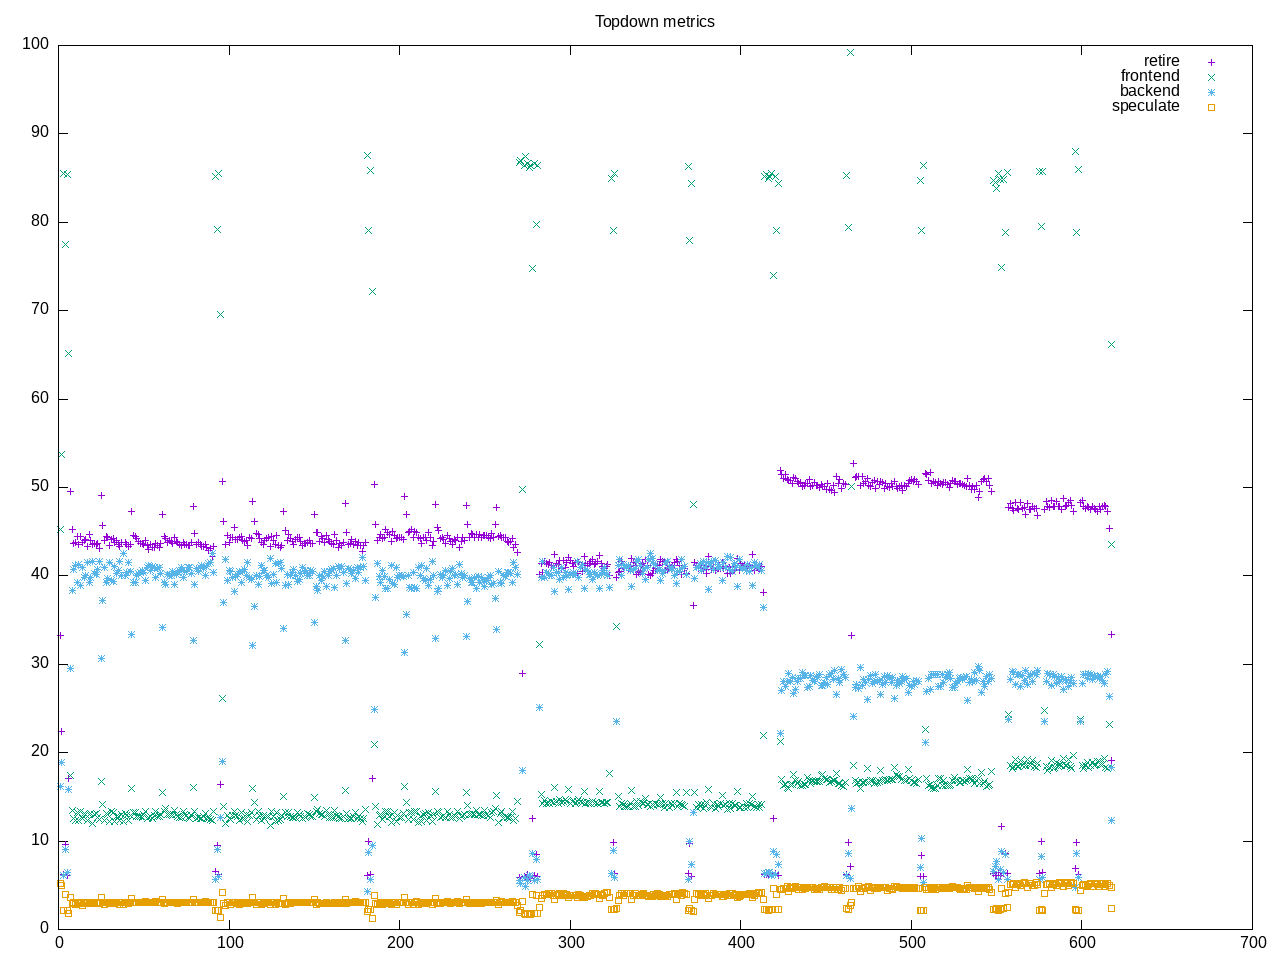
AMD metrics show floating point code with some memory bound stalls. There are few branches, though still branch misprediction.
elapsed              623.409
on_cpu               0.311          # 4.97 / 16 cores
utime                3048.837
stime                48.411
nvcsw                3637285        # 99.86%
nivcsw               5119           # 0.14%
inblock              0              # 0.00/sec
onblock              15512          # 24.88/sec
cpu-clock            3089203964534  # 3089.204 seconds
task-clock           3091077405978  # 3091.077 seconds
page faults          2123880        # 687.100/sec
context switches     3645325        # 1179.306/sec
cpu migrations       3420           # 1.106/sec
major page faults    2              # 0.001/sec
minor page faults    2123878        # 687.100/sec
alignment faults     0              # 0.000/sec
emulation faults     0              # 0.000/sec
branches             1721188727239  # 52.252 branches per 1000 inst
branch misses        26850172244    # 1.56% branch miss
conditional          1385965910144  # 42.075 conditional branches per 1000 inst
indirect             56654184709    # 1.720 indirect branches per 1000 inst
cpu-cycles           12148882895870 # 1.24 GHz
instructions         32948907414886 # 2.71 IPC
slots                24279285092832 #
retiring             11013916606615 # 45.4% (45.6%)
-- ucode             20225750600    #     0.1%
-- fastpath          10993690856015 #    45.3%
frontend             3545739782724  # 14.6% (14.7%)
-- latency           1451506674132  #     6.0%
-- bandwidth         2094233108592  #     8.6%
backend              8701349022251  # 35.8% (36.0%)
-- cpu               3205982477495  #    13.2%
-- memory            5495366544756  #    22.6%
speculation          891925444057   #  3.7% ( 3.7%)
-- branch mispredict 844250791145   #     3.5%
-- pipeline restart  47674652912    #     0.2%
smt-contention       126338239440   #  0.5% ( 0.0%)
cpu-cycles           12134150872890 # 1.24 GHz
instructions         32940470679251 # 2.71 IPC
instructions         10979290279131 # 40.403 l2 access per 1000 inst
l2 hit from l1       383961375679   # 16.06% l2 miss
l2 miss from l1      52653668633    #
l2 hit from l2 pf    41052024947    #
l3 hit from l2 pf    14381078758    #
l3 miss from l2 pf   4198549610     #
instructions         10981114496824 # 243.225 float per 1000 inst
float 512            58             # 0.000 AVX-512 per 1000 inst
float 256            514            # 0.000 AVX-256 per 1000 inst
float 128            2670880984964  # 243.225 AVX-128 per 1000 inst
float MMX            0              # 0.000 MMX per 1000 inst
float scalar         2469           # 0.000 scalar per 1000 inst
instructions         2686249        #
opcache              993457         # 369.831 opcache per 1000 inst
opcache miss         533742         # 53.7% opcache miss rate
l1 dTLB miss         6511           # 2.424 L1 dTLB per 1000 inst
l2 dTLB miss         1193           # 0.444 L2 dTLB per 1000 inst
instructions         2738555        #
icache               1323391        # 483.244 icache per 1000 inst
icache miss          110104         #  8.3% icache miss rate
l1 iTLB miss         6              # 0.002 L1 iTLB per 1000 inst
l2 iTLB miss         0              # 0.000 L2 iTLB per 1000 inst
tlb flush            19             # 0.007 TLB flush per 1000 inst
Intel metrics show L2 cache as most active stalls for memory
elapsed              1393.848
on_cpu               0.320          # 5.12 / 16 cores
utime                7051.575
stime                81.121
nvcsw                5955297        # 98.67%
nivcsw               80192          # 1.33%
inblock              20984032       # 15054.75/sec
onblock              5464           # 3.92/sec
cpu-clock            7093046110780  # 7093.046 seconds
task-clock           7096878999736  # 7096.879 seconds
page faults          2495483        # 351.631/sec
context switches     6042276        # 851.399/sec
cpu migrations       163180         # 22.993/sec
major page faults    2861           # 0.403/sec
minor page faults    2492622        # 351.228/sec
alignment faults     0              # 0.000/sec
emulation faults     0              # 0.000/sec
branches             2459209749628  # 50.743 branches per 1000 inst
branch misses        44820326405    # 1.82% branch miss
conditional          2459209765468  # 50.743 conditional branches per 1000 inst
indirect             620204202405   # 12.797 indirect branches per 1000 inst
slots                49219054467146 #
retiring             23760356174046 # 48.3% (48.3%)
-- ucode             1008550311918  #     2.0%
-- fastpath          22751805862128 #    46.2%
frontend             6378237707292  # 13.0% (13.0%)
-- latency           3046542845679  #     6.2%
-- bandwidth         3331694861613  #     6.8%
backend              16273030130206 # 33.1% (33.1%)
-- cpu               9088240401088  #    18.5%
-- memory            7184789729118  #    14.6%
speculation          3130243686700  #  6.4% ( 6.4%)
-- branch mispredict 2944870071324  #     6.0%
-- pipeline restart  185373615376   #     0.4%
smt-contention       0              #  0.0% ( 0.0%)
cpu-cycles           16282458738408 # 1.01 GHz
instructions         44439229330649 # 2.73 IPC
l2 access            902938123881   # 39.431 l2 access per 1000 inst
l2 miss              264018120167   # 29.24% l2 miss
cpu-cycles           8391353786130  # 21.0% memory latency
load stalls          1601500730217  #  0.0% l1 bound
l1 miss              1707146006108  # 12.4% l2 bound
l2 miss              668404285722   #  4.3% l3 bound
l3 miss              305217164369   #  3.6% dram bound
store_stalls         158271209456   #  1.9% store bound
Process overview shows vpxenc as the primary process
450 processes
	 96 vpxenc               23832.39   254.91
	 68 clinfo                  17.20     5.33
	 38 vulkaninfo               1.14     1.14
	  4 vulkani:disk$0           0.12     0.12
	  6 glxinfo:gdrv0            0.10     0.04
	  6 glxinfo:gl0              0.10     0.04
	  6 clang                    0.10     0.01
	  6 php                      0.07     0.17
	  2 llvmpipe-0               0.06     0.06
	  2 llvmpipe-1               0.06     0.06
	  2 llvmpipe-10              0.06     0.06
	  2 llvmpipe-11              0.06     0.06
	  2 llvmpipe-12              0.06     0.06
	  2 llvmpipe-13              0.06     0.06
	  2 llvmpipe-14              0.06     0.06
	  2 llvmpipe-15              0.06     0.06
	  2 llvmpipe-2               0.06     0.06
	  2 llvmpipe-3               0.06     0.06
	  2 llvmpipe-4               0.06     0.06
	  2 llvmpipe-5               0.06     0.06
	  2 llvmpipe-6               0.06     0.06
	  2 llvmpipe-7               0.06     0.06
	  2 llvmpipe-8               0.06     0.06
	  2 llvmpipe-9               0.06     0.06
	  2 glxinfo                  0.06     0.02
	  2 glxinfo:cs0              0.06     0.02
	  2 glxinfo:disk$0           0.06     0.02
	  2 glxinfo:sh0              0.06     0.02
	  2 glxinfo:shlo0            0.06     0.02
	  3 rocminfo                 0.03     0.00
	  1 lspci                    0.00     0.02
	 88 sh                       0.00     0.00
	 13 gcc                      0.00     0.00
	 13 gsettings                0.00     0.00
	  8 stat                     0.00     0.00
	  8 systemd-detect-          0.00     0.00
	  6 llvm-link                0.00     0.00
	  5 phoronix-test-s          0.00     0.00
	  2 cc                       0.00     0.00
	  2 gmain                    0.00     0.00
	  2 lscpu                    0.00     0.00
	  2 uname                    0.00     0.00
	  2 which                    0.00     0.00
	  2 xset                     0.00     0.00
	  1 date                     0.00     0.00
	  1 dconf worker             0.00     0.00
	  1 dirname                  0.00     0.00
	  1 dmesg                    0.00     0.00
	  1 dmidecode                0.00     0.00
	  1 grep                     0.00     0.00
	  1 ifconfig                 0.00     0.00
	  1 ip                       0.00     0.00
	  1 lsmod                    0.00     0.00
	  1 mktemp                   0.00     0.00
	  1 ps                       0.00     0.00
	  1 qdbus                    0.00     0.00
	  1 readlink                 0.00     0.00
	  1 realpath                 0.00     0.00
	  1 sed                      0.00     0.00
	  1 sort                     0.00     0.00
	  1 stty                     0.00     0.00
	  1 systemctl                0.00     0.00
	  1 template.sh              0.00     0.00
	  1 wc                       0.00     0.00
	  1 xrandr                   0.00     0.00
0 processes running
47 maximum processes
Computation structure is straightforward.
      333831) vpxenc           cpu=11 start=6.65  finish=91.46
        333832) vpxenc           cpu=11 start=6.66  finish=91.46
          333833) vpxenc           cpu=2 start=7.15  finish=91.41
          333834) vpxenc           cpu=12 start=7.15  finish=91.41
          333835) vpxenc           cpu=7 start=7.16  finish=91.41
          333836) vpxenc           cpu=1 start=7.16  finish=91.41
          333837) vpxenc           cpu=5 start=7.16  finish=91.41
          333838) vpxenc           cpu=6 start=7.16  finish=91.41
          333839) vpxenc           cpu=0 start=7.17  finish=91.41