
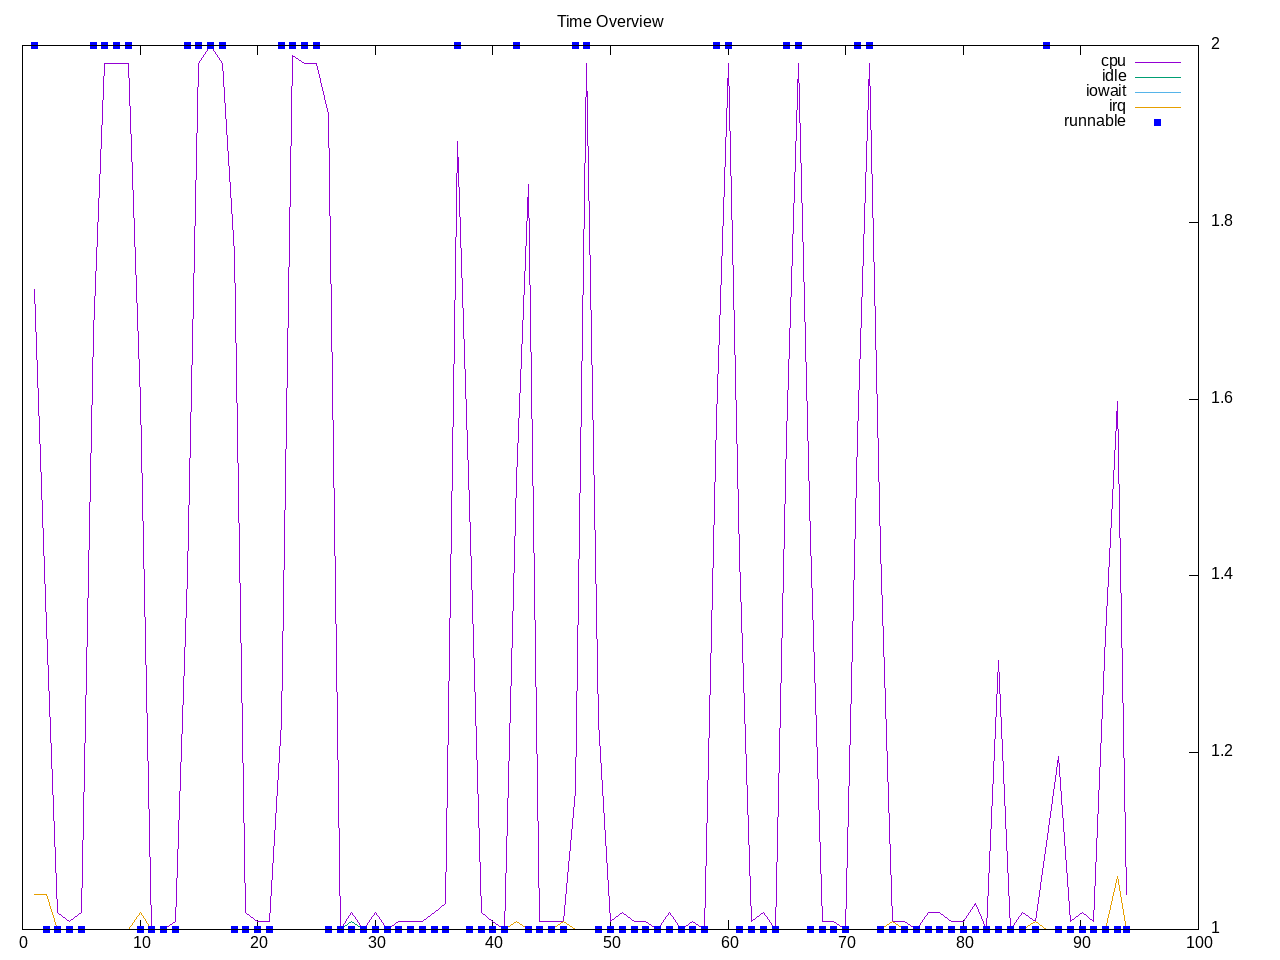
Testing a cryptographic library. The test is single-threaded and runs quickly.
Topdown profile has sparse output but some sections with higher backend stalls.
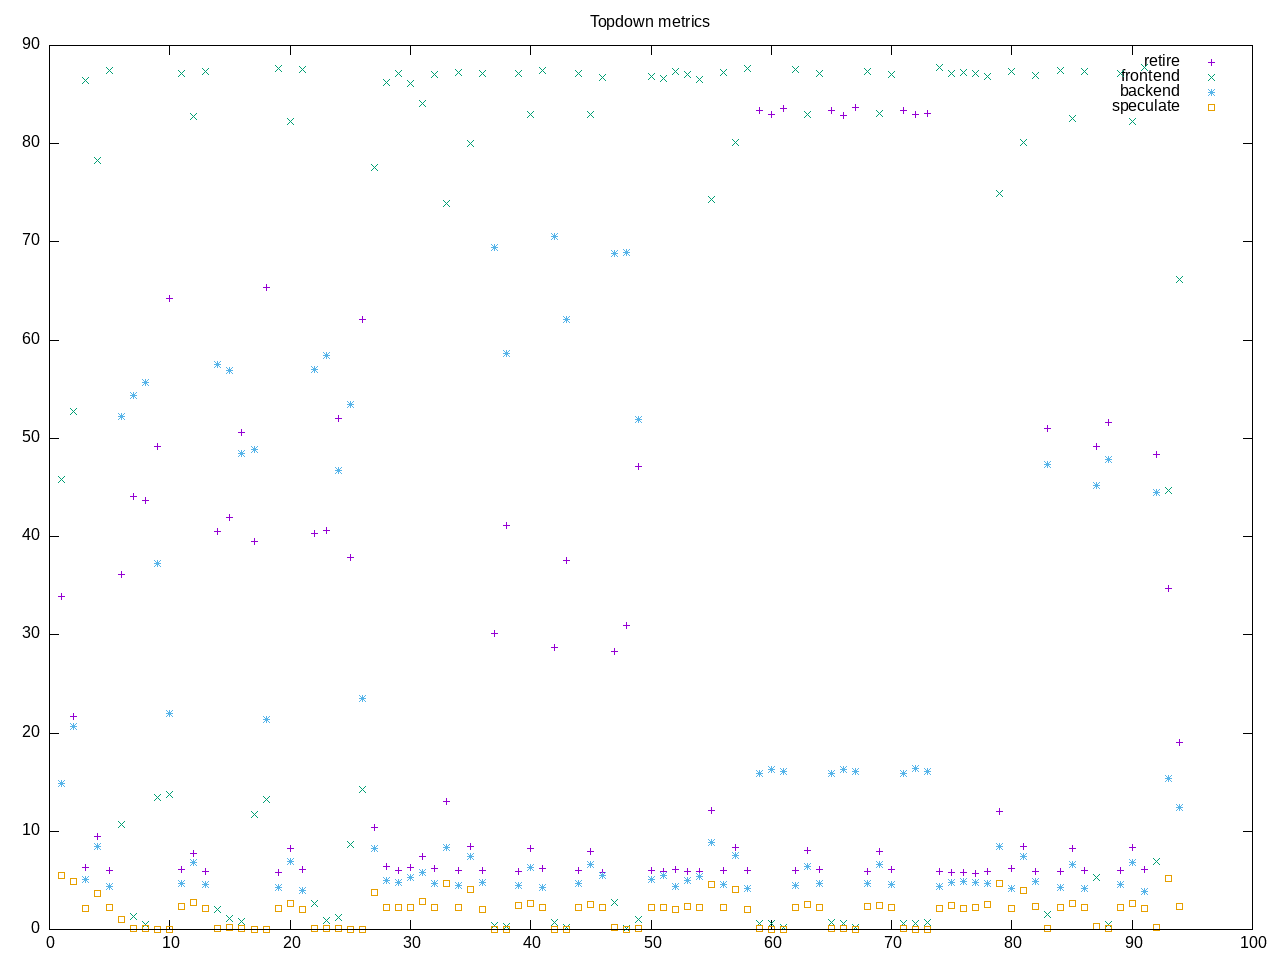
AMD metrics suggest more cpu-stalls than memory stalls.
elapsed              94.220
on_cpu               0.017          # 0.27 / 16 cores
utime                24.435
stime                0.831
nvcsw                1618           # 84.71%
nivcsw               292            # 15.29%
inblock              0              # 0.00/sec
onblock              14016          # 148.76/sec
cpu-clock            25298928290    # 25.299 seconds
task-clock           25302154587    # 25.302 seconds
page faults          149643         # 5914.239/sec
context switches     2182           # 86.238/sec
cpu migrations       223            # 8.813/sec
major page faults    2              # 0.079/sec
minor page faults    149641         # 5914.160/sec
alignment faults     0              # 0.000/sec
emulation faults     0              # 0.000/sec
branches             12740465932    # 43.051 branches per 1000 inst
branch misses        86402205       # 0.68% branch miss
conditional          9430797976     # 31.867 conditional branches per 1000 inst
indirect             794097045      # 2.683 indirect branches per 1000 inst
cpu-cycles           99053264199    # 0.07 GHz
instructions         293958110541   # 2.97 IPC
slots                201017705694   #
retiring             107853876305   # 53.7% (53.7%)
-- ucode             2437762483     #     1.2%
-- fastpath          105416113822   #    52.4%
frontend             12455300921    #  6.2% ( 6.2%)
-- latency           4433151924     #     2.2%
-- bandwidth         8022148997     #     4.0%
backend              80056377689    # 39.8% (39.8%)
-- cpu               66843608534    #    33.3%
-- memory            13212769155    #     6.6%
speculation          642511928      #  0.3% ( 0.3%) low
-- branch mispredict 635813643      #     0.3%
-- pipeline restart  6698285        #     0.0%
smt-contention       9414965        #  0.0% ( 0.0%)
cpu-cycles           99031464468    # 0.07 GHz
instructions         294049097735   # 2.97 IPC
instructions         98761582757    # 1.350 l2 access per 1000 inst
l2 hit from l1       114558171      # 17.55% l2 miss
l2 miss from l1      13343998       #
l2 hit from l2 pf    8732172        #
l3 hit from l2 pf    4360538        #
l3 miss from l2 pf   5701902        #
instructions         98703762781    # 465.071 float per 1000 inst
float 512            59             # 0.000 AVX-512 per 1000 inst
float 256            434            # 0.000 AVX-256 per 1000 inst
float 128            45904276555    # 465.071 AVX-128 per 1000 inst
float MMX            0              # 0.000 MMX per 1000 inst
float scalar         0              # 0.000 scalar per 1000 inst
instructions         295851927697   #
opcache              24579101623    # 83.079 opcache per 1000 inst
opcache miss         607511905      #  2.5% opcache miss rate
l1 dTLB miss         26086132       # 0.088 L1 dTLB per 1000 inst
l2 dTLB miss         4936000        # 0.017 L2 dTLB per 1000 inst
instructions         295862657534   #
icache               1326635578     # 4.484 icache per 1000 inst
icache miss          169783857      # 12.8% icache miss rate
l1 iTLB miss         9336024        # 0.032 L1 iTLB per 1000 inst
l2 iTLB miss         0              # 0.000 L2 iTLB per 1000 inst
tlb flush            17842          # 0.000 TLB flush per 1000 inst
Intel metrics confirm floating point code with little l2 access.
elapsed              93.642
on_cpu               0.017          # 0.27 / 16 cores
utime                24.866
stime                0.434
nvcsw                1478           # 87.61%
nivcsw               209            # 12.39%
inblock              16             # 0.17/sec
onblock              2736           # 29.22/sec
cpu-clock            25324784526    # 25.325 seconds
task-clock           25328463591    # 25.328 seconds
page faults          136213         # 5377.863/sec
context switches     1965           # 77.581/sec
cpu migrations       272            # 10.739/sec
major page faults    0              # 0.000/sec
minor page faults    136213         # 5377.863/sec
alignment faults     0              # 0.000/sec
emulation faults     0              # 0.000/sec
branches             13320342900    # 42.997 branches per 1000 inst
branch misses        29709033       # 0.22% branch miss
conditional          13320354356    # 42.997 conditional branches per 1000 inst
indirect             957564149      # 3.091 indirect branches per 1000 inst
slots                568223492150   #
retiring             310611767324   # 54.7% (54.7%) high
-- ucode             8196156117     #     1.4%
-- fastpath          302415611207   #    53.2%
frontend             23950086249    #  4.2% ( 4.2%) low
-- latency           5362441166     #     0.9%
-- bandwidth         18587645083    #     3.3%
backend              230251712207   # 40.5% (40.5%)
-- cpu               212720773829   #    37.4%
-- memory            17530938378    #     3.1%
speculation          4451426739     #  0.8% ( 0.8%) low
-- branch mispredict 4284503346     #     0.8%
-- pipeline restart  166923393      #     0.0%
smt-contention       0              #  0.0% ( 0.0%)
cpu-cycles           94690767500    # 0.06 GHz
instructions         309962466792   # 3.27 IPC high
l2 access            255595421      # 0.825 l2 access per 1000 inst
l2 miss              80138123       # 31.35% l2 miss
cpu-cycles           94563596930    #  4.1% memory latency
load stalls          3773421162     #  3.3% l1 bound
l1 miss              637484752      #  0.4% l2 bound
l2 miss              292673964      #  0.1% l3 bound
l3 miss              193375032      #  0.2% dram bound
store_stalls         76788507       #  0.1% store bound
Process overview shows benchmark overhead nearly as high as the nettle-benchmark process.
360 processes
	 12 nettle-benchmar         23.32     0.00
	 68 clinfo                  19.76     6.66
	 38 vulkaninfo               1.86     1.14
	  4 vulkani:disk$0           0.19     0.12
	  2 llvmpipe-0               0.10     0.06
	  2 llvmpipe-1               0.10     0.06
	  2 llvmpipe-10              0.10     0.06
	  2 llvmpipe-11              0.10     0.06
	  2 llvmpipe-12              0.10     0.06
	  2 llvmpipe-13              0.10     0.06
	  2 llvmpipe-14              0.10     0.06
	  2 llvmpipe-15              0.10     0.06
	  2 llvmpipe-2               0.10     0.06
	  2 llvmpipe-3               0.10     0.06
	  2 llvmpipe-4               0.10     0.06
	  2 llvmpipe-5               0.10     0.06
	  2 llvmpipe-6               0.10     0.06
	  2 llvmpipe-7               0.10     0.06
	  2 llvmpipe-8               0.10     0.06
	  2 llvmpipe-9               0.10     0.06
	  6 php                      0.07     0.12
	  6 clang                    0.05     0.07
	  3 rocminfo                 0.00     0.03
	  1 lspci                    0.00     0.03
	 89 sh                       0.00     0.00
	 14 gsettings                0.00     0.00
	 13 gcc                      0.00     0.00
	 12 nettle                   0.00     0.00
	  8 stat                     0.00     0.00
	  8 systemd-detect-          0.00     0.00
	  6 llvm-link                0.00     0.00
	  5 phoronix-test-s          0.00     0.00
	  4 glxinfo                  0.00     0.00
	  2 cc                       0.00     0.00
	  2 lscpu                    0.00     0.00
	  2 setterm                  0.00     0.00
	  2 uname                    0.00     0.00
	  2 which                    0.00     0.00
	  1 date                     0.00     0.00
	  1 dconf worker             0.00     0.00
	  1 dirname                  0.00     0.00
	  1 dmesg                    0.00     0.00
	  1 dmidecode                0.00     0.00
	  1 gmain                    0.00     0.00
	  1 grep                     0.00     0.00
	  1 ifconfig                 0.00     0.00
	  1 ip                       0.00     0.00
	  1 lsmod                    0.00     0.00
	  1 mktemp                   0.00     0.00
	  1 ps                       0.00     0.00
	  1 qdbus                    0.00     0.00
	  1 readlink                 0.00     0.00
	  1 realpath                 0.00     0.00
	  1 sed                      0.00     0.00
	  1 sort                     0.00     0.00
	  1 stty                     0.00     0.00
	  1 systemctl                0.00     0.00
	  1 template.sh              0.00     0.00
	  1 wc                       0.00     0.00
0 processes running
47 maximum processes
Computation blocks
      1025300) nettle           cpu=8 start=5.52  finish=9.66
        1025301) nettle-benchmar  cpu=15 start=5.53  finish=9.65
      1025302) nettle           cpu=4 start=13.66 finish=17.81
        1025303) nettle-benchmar  cpu=13 start=13.66 finish=17.81
      1025304) nettle           cpu=11 start=21.82 finish=25.97
        1025305) nettle-benchmar  cpu=12 start=21.82 finish=25.97
      1025306) sh               cpu=11 start=25.97 finish=25.97
        1025307) sh               cpu=12 start=25.97 finish=25.97
      1025309) nettle           cpu=3 start=36.17 finish=37.55
        1025310) nettle-benchmar  cpu=4 start=36.17 finish=37.55
      1025311) nettle           cpu=3 start=41.56 finish=42.92
        1025312) nettle-benchmar  cpu=4 start=41.56 finish=42.92
      1025313) nettle           cpu=3 start=46.93 finish=48.29
        1025314) nettle-benchmar  cpu=12 start=46.93 finish=48.29
      1025315) sh               cpu=3 start=48.29 finish=48.29
        1025316) sh               cpu=12 start=48.29 finish=48.29
      1025317) nettle           cpu=3 start=58.48 finish=60.51
        1025318) nettle-benchmar  cpu=12 start=58.49 finish=60.51
      1025319) nettle           cpu=11 start=64.51 finish=66.51
        1025320) nettle-benchmar  cpu=12 start=64.52 finish=66.51
      1025321) nettle           cpu=11 start=70.52 finish=72.52
        1025322) nettle-benchmar  cpu=12 start=70.52 finish=72.52
      1025323) sh               cpu=11 start=72.52 finish=72.52
        1025324) sh               cpu=12 start=72.52 finish=72.52
      1025325) nettle           cpu=3 start=82.71 finish=83.00
        1025326) nettle-benchmar  cpu=5 start=82.71 finish=83.00
      1025327) nettle           cpu=3 start=87.00 finish=87.29
        1025328) nettle-benchmar  cpu=4 start=87.00 finish=87.29
      1025329) nettle           cpu=3 start=91.29 finish=91.58
        1025330) nettle-benchmar  cpu=12 start=91.30 finish=91.58