
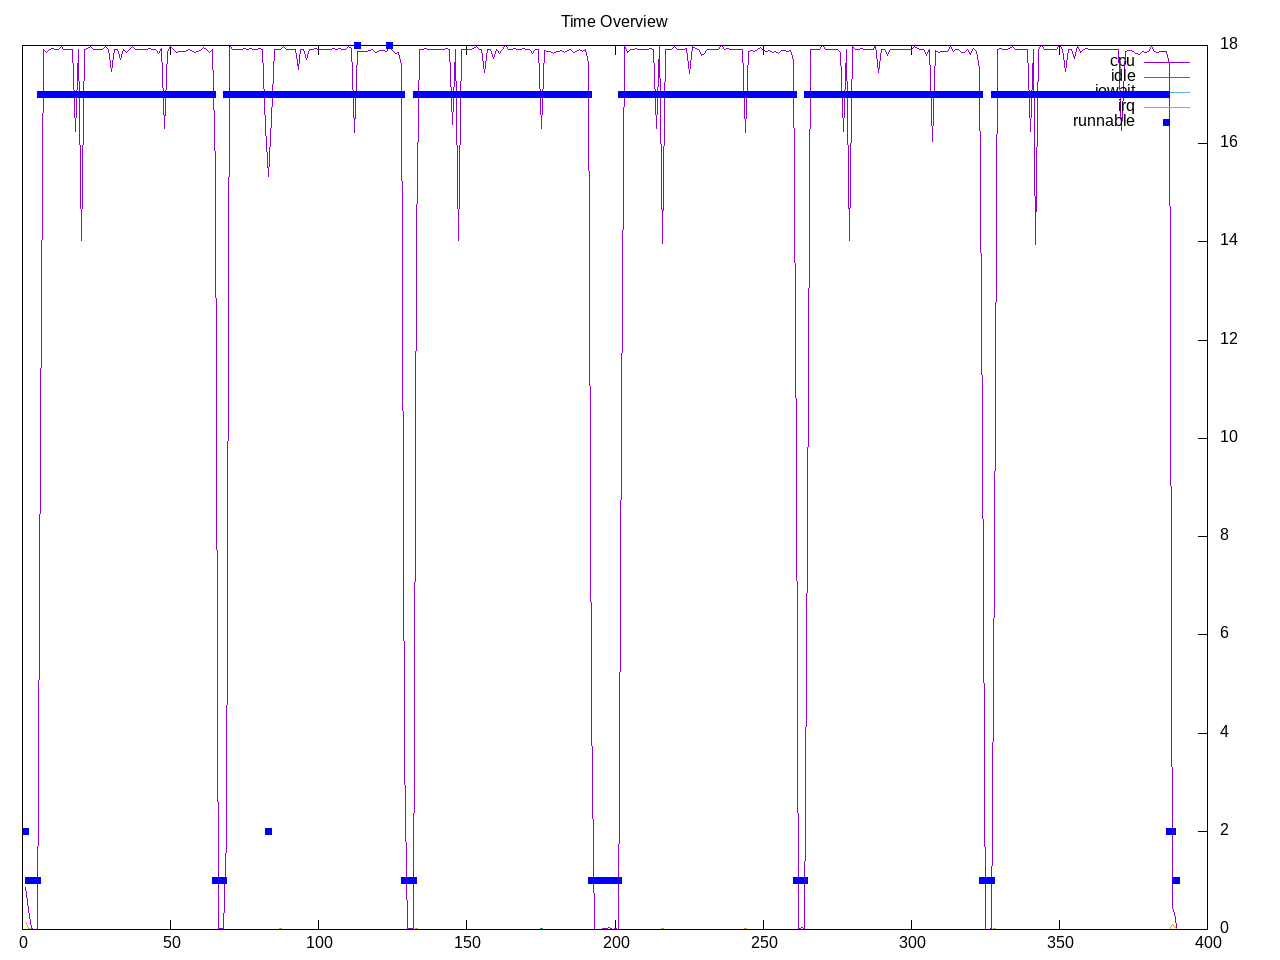
ncnn is a neural network framework from Tencent. This test works through a dozen different neural networks first on CPU and then on Vulkan GPU. Each individual case runs quickly so that ~60 second period only runs on average a neural net for five seconds before going to the next one. It looks like we are taking advantage of all cores.
Topdown profile shows on average we are dominated by backend stalls, except for a few of the last network being slightly less so. The CPU and GPU profiles are similar, so perhaps my “Vulkan GPU” tests really are CPU tests as well.
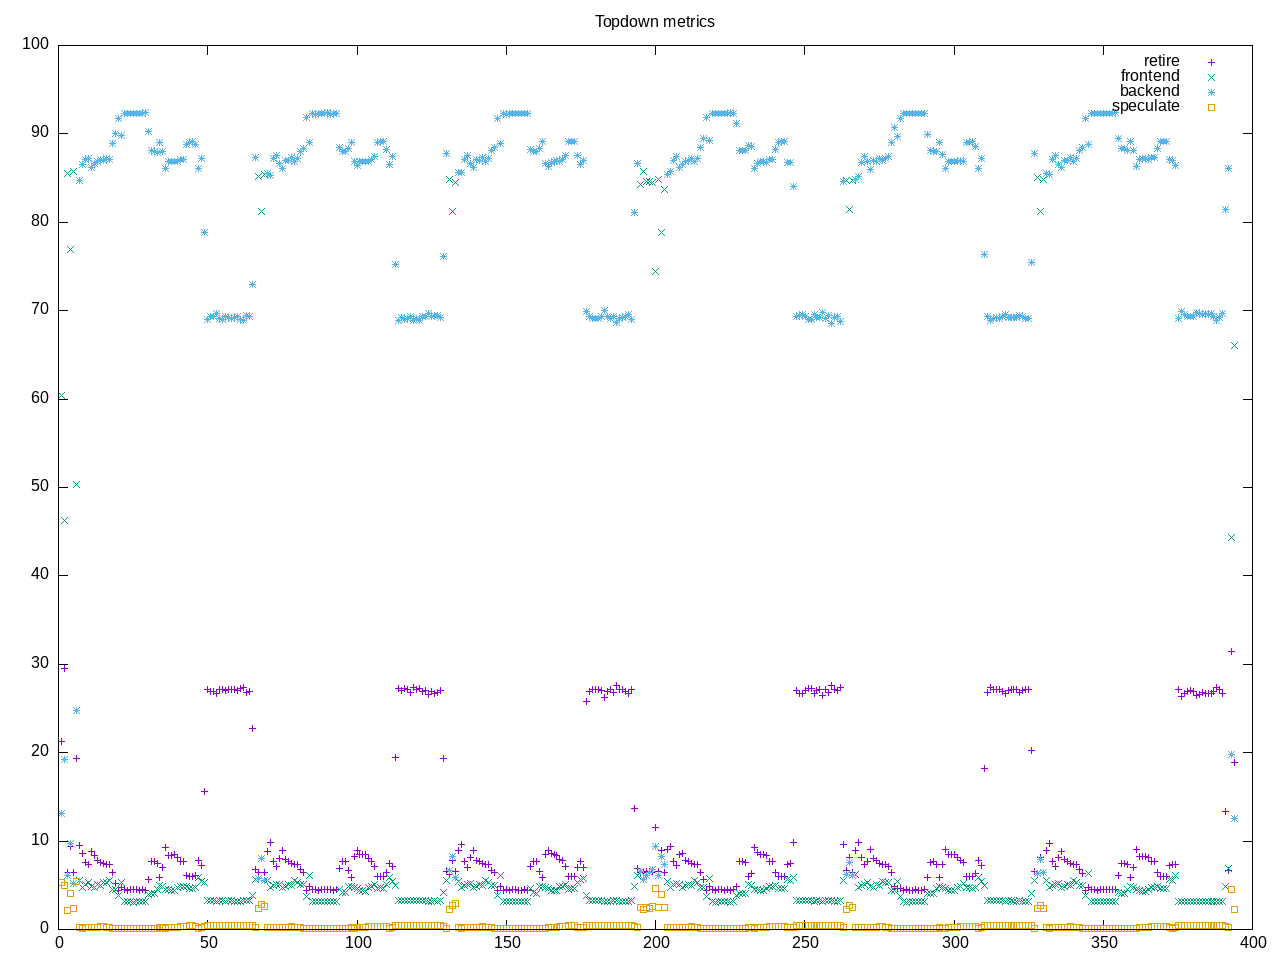
AMD metrics show a workload high in backend stalls and low in both retiring rate and frontend stalls. There are few floating point instructions (using int8?).
elapsed              1946.111
on_cpu               0.924          # 14.78 / 16 cores
utime                28665.305
stime                97.446
nvcsw                1458053        # 82.31%
nivcsw               313322         # 17.69%
inblock              0              # 0.00/sec
onblock              17848          # 9.17/sec
cpu-clock            28772710292348 # 28772.710 seconds
task-clock           28773501421019 # 28773.501 seconds
page faults          17841468       # 620.066/sec
context switches     1780869        # 61.893/sec
cpu migrations       715            # 0.025/sec
major page faults    2079           # 0.072/sec
minor page faults    17839389       # 619.994/sec
alignment faults     0              # 0.000/sec
emulation faults     0              # 0.000/sec
branches             7400706707040  # 129.148 branches per 1000 inst
branch misses        22112539866    # 0.30% branch miss
conditional          7306720045682  # 127.508 conditional branches per 1000 inst
indirect             9788450464     # 0.171 indirect branches per 1000 inst
cpu-cycles           24435176519386 # 3.85 GHz
instructions         11449051374995 # 0.47 IPC low
slots                48868759359042 #
retiring             4017392153178  #  8.2% (11.1%) low
-- ucode             52206341384    #     0.1%
-- fastpath          3965185811794  #     8.1%
frontend             1521688467294  #  3.1% ( 4.2%) low
-- latency           584270471004   #     1.2%
-- bandwidth         937417996290   #     1.9%
backend              30426520761785 # 62.3% (84.4%) high
-- cpu               15311691089077 #    31.3%
-- memory            15114829672708 #    30.9%
speculation          83894665674    #  0.2% ( 0.2%) low
-- branch mispredict 64506051329    #     0.1%
-- pipeline restart  19388614345    #     0.0%
smt-contention       12819183408457 # 26.2% ( 0.0%)
cpu-cycles           24319189058245 # 3.85 GHz
instructions         11439573868940 # 0.47 IPC low
instructions         3817148970093  # 129.638 l2 access per 1000 inst
l2 hit from l1       313108322322   # 28.43% l2 miss
l2 miss from l1      15187002493    #
l2 hit from l2 pf    56261875456    #
l3 hit from l2 pf    109448230684   #
l3 miss from l2 pf   16030874460    #
instructions         3814302904658  # 15.070 float per 1000 inst
float 512            62             # 0.000 AVX-512 per 1000 inst
float 256            8826           # 0.000 AVX-256 per 1000 inst
float 128            57480143661    # 15.070 AVX-128 per 1000 inst
float MMX            0              # 0.000 MMX per 1000 inst
float scalar         0              # 0.000 scalar per 1000 inst
Intel metrics
elapsed              2809.052
on_cpu               0.949          # 15.18 / 16 cores
utime                42567.071
stime                76.882
nvcsw                2200133        # 85.22%
nivcsw               381476         # 14.78%
inblock              8432           # 3.00/sec
onblock              4912           # 1.75/sec
cpu-clock            42647720312779 # 42647.720 seconds
task-clock           42648149083383 # 42648.149 seconds
page faults          18818807       # 441.257/sec
context switches     2595429        # 60.857/sec
cpu migrations       61584          # 1.444/sec
major page faults    1942           # 0.046/sec
minor page faults    18816865       # 441.212/sec
alignment faults     0              # 0.000/sec
emulation faults     0              # 0.000/sec
branches             4804748523665  # 49.759 branches per 1000 inst
branch misses        22716229759    # 0.47% branch miss
conditional          4804748550129  # 49.759 conditional branches per 1000 inst
indirect             2009633101318  # 20.812 indirect branches per 1000 inst
slots                235806293789726 #
retiring             48622809170505 # 20.6% (20.6%)
-- ucode             3412287001594  #     1.4%
-- fastpath          45210522168911 #    19.2%
frontend             17158999336433 #  7.3% ( 7.3%)
-- latency           13837393028606 #     5.9%
-- bandwidth         3321606307827  #     1.4%
backend              168582773381581 # 71.5% (71.5%) high
-- cpu               124294100887241 #    52.7%
-- memory            44288672494340 #    18.8%
speculation          1609099917873  #  0.7% ( 0.7%) low
-- branch mispredict 1470207468290  #     0.6%
-- pipeline restart  138892449583   #     0.1%
smt-contention       0              #  0.0% ( 0.0%)
cpu-cycles           90957267456764 # 2.96 GHz
instructions         63982684727203 # 0.70 IPC
l2 access            2072680943817  # 59.690 l2 access per 1000 inst
l2 miss              855274244675   # 41.26% l2 miss
Process overview is simile with 96 benchcnn processes.
452 processes
	 96 benchncnn            91381.12   284.48
	 68 clinfo                  16.28     6.65
	 38 vulkaninfo               0.95     1.34
	  6 glxinfo:gdrv0            0.15     0.00
	  6 glxinfo:gl0              0.15     0.00
	  6 php                      0.14     0.08
	  4 vulkani:disk$0           0.10     0.15
	  2 glxinfo                  0.08     0.00
	  2 glxinfo:cs0              0.08     0.00
	  2 glxinfo:disk$0           0.08     0.00
	  2 glxinfo:sh0              0.08     0.00
	  2 glxinfo:shlo0            0.08     0.00
	  6 clang                    0.06     0.06
	  2 llvmpipe-0               0.05     0.08
	  2 llvmpipe-10              0.05     0.08
	  2 llvmpipe-11              0.05     0.08
	  2 llvmpipe-12              0.05     0.08
	  2 llvmpipe-13              0.05     0.08
	  2 llvmpipe-14              0.05     0.08
	  2 llvmpipe-15              0.05     0.08
	  2 llvmpipe-2               0.05     0.08
	  2 llvmpipe-3               0.05     0.08
	  2 llvmpipe-4               0.05     0.08
	  2 llvmpipe-5               0.05     0.08
	  2 llvmpipe-6               0.05     0.08
	  2 llvmpipe-7               0.05     0.08
	  2 llvmpipe-8               0.05     0.08
	  2 llvmpipe-9               0.05     0.08
	  2 llvmpipe-1               0.05     0.07
	  3 rocminfo                 0.03     0.00
	  1 lspci                    0.00     0.02
	  1 ps                       0.00     0.01
	 84 sh                       0.00     0.00
	 13 gcc                      0.00     0.00
	  9 gsettings                0.00     0.00
	  8 stat                     0.00     0.00
	  8 systemd-detect-          0.00     0.00
	  6 llvm-link                0.00     0.00
	  6 ncnn                     0.00     0.00
	  5 phoronix-test-s          0.00     0.00
	  4 gmain                    0.00     0.00
	  3 dconf worker             0.00     0.00
	  2 cc                       0.00     0.00
	  2 lscpu                    0.00     0.00
	  2 uname                    0.00     0.00
	  2 which                    0.00     0.00
	  2 xset                     0.00     0.00
	  1 date                     0.00     0.00
	  1 dirname                  0.00     0.00
	  1 dmesg                    0.00     0.00
	  1 dmidecode                0.00     0.00
	  1 grep                     0.00     0.00
	  1 ifconfig                 0.00     0.00
	  1 ip                       0.00     0.00
	  1 lsmod                    0.00     0.00
	  1 mktemp                   0.00     0.00
	  1 qdbus                    0.00     0.00
	  1 readlink                 0.00     0.00
	  1 realpath                 0.00     0.00
	  1 sed                      0.00     0.00
	  1 sort                     0.00     0.00
	  1 stty                     0.00     0.00
	  1 systemctl                0.00     0.00
	  1 template.sh              0.00     0.00
	  1 wc                       0.00     0.00
	  1 xrandr                   0.00     0.00
0 processes running
47 maximum processes
The core computation blocks
      1129043) ncnn             cpu=12 start=5.50  finish=66.00
        1129044) benchncnn        cpu=6 start=5.50  finish=66.00
          1129045) benchncnn        cpu=0 start=5.51  finish=66.00
          1129046) benchncnn        cpu=11 start=5.51  finish=66.00
          1129047) benchncnn        cpu=9 start=5.51  finish=66.00
          1129048) benchncnn        cpu=10 start=5.51  finish=66.00
          1129049) benchncnn        cpu=15 start=5.51  finish=66.00
          1129050) benchncnn        cpu=14 start=5.51  finish=66.00
          1129051) benchncnn        cpu=4 start=5.51  finish=66.00
          1129052) benchncnn        cpu=13 start=5.51  finish=66.00
          1129053) benchncnn        cpu=7 start=5.51  finish=66.00
          1129054) benchncnn        cpu=8 start=5.51  finish=66.00
          1129055) benchncnn        cpu=3 start=5.51  finish=66.00
          1129056) benchncnn        cpu=1 start=5.51  finish=66.00
          1129057) benchncnn        cpu=2 start=5.51  finish=66.00
          1129058) benchncnn        cpu=12 start=5.51  finish=66.00
          1129059) benchncnn        cpu=5 start=5.51  finish=66.00