
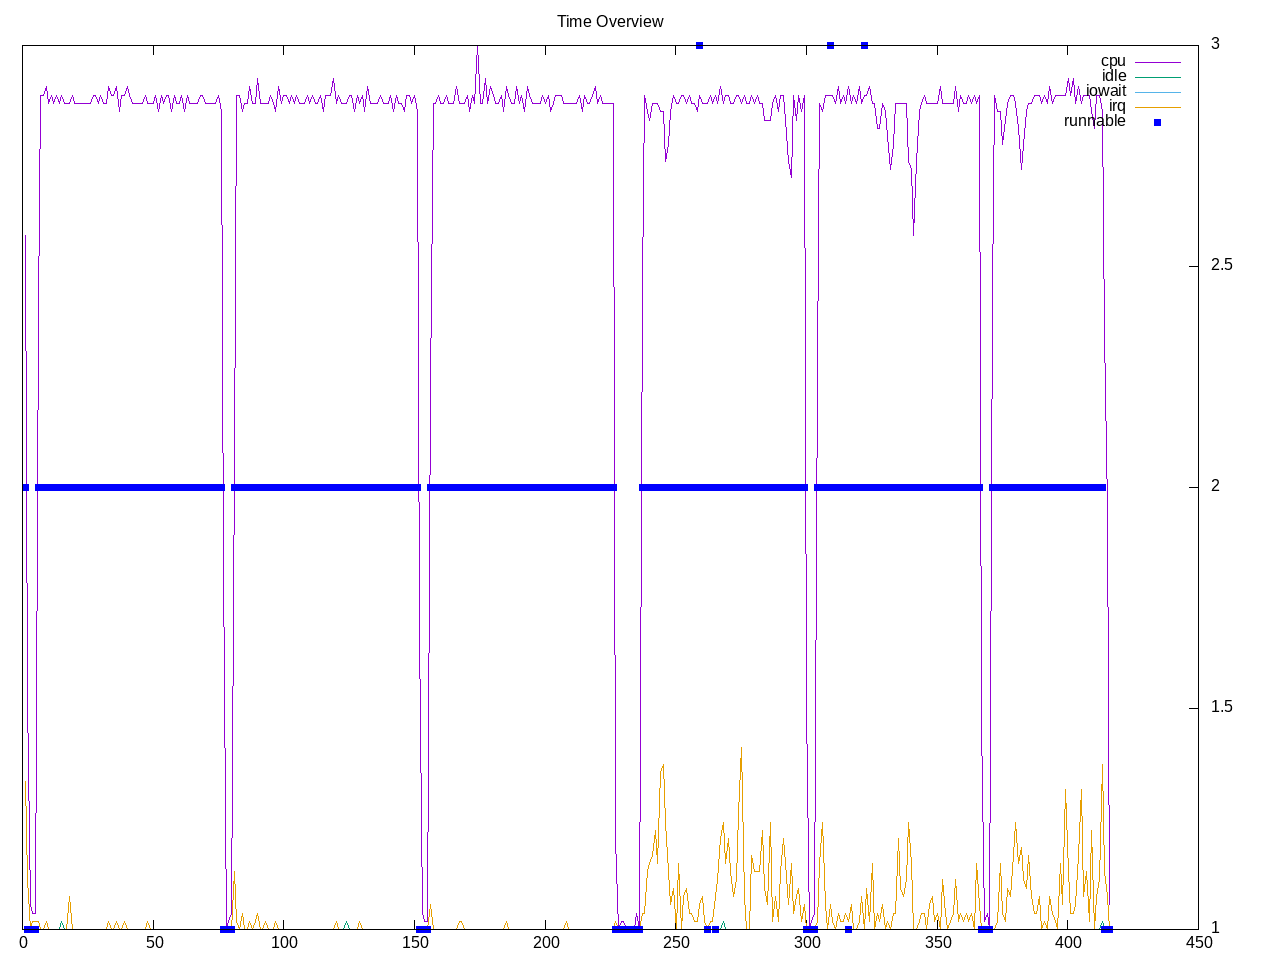
The perl benchmark suite. This is a single-threaded test with two subtests listed. The second test is much more interrupt driven than the first.
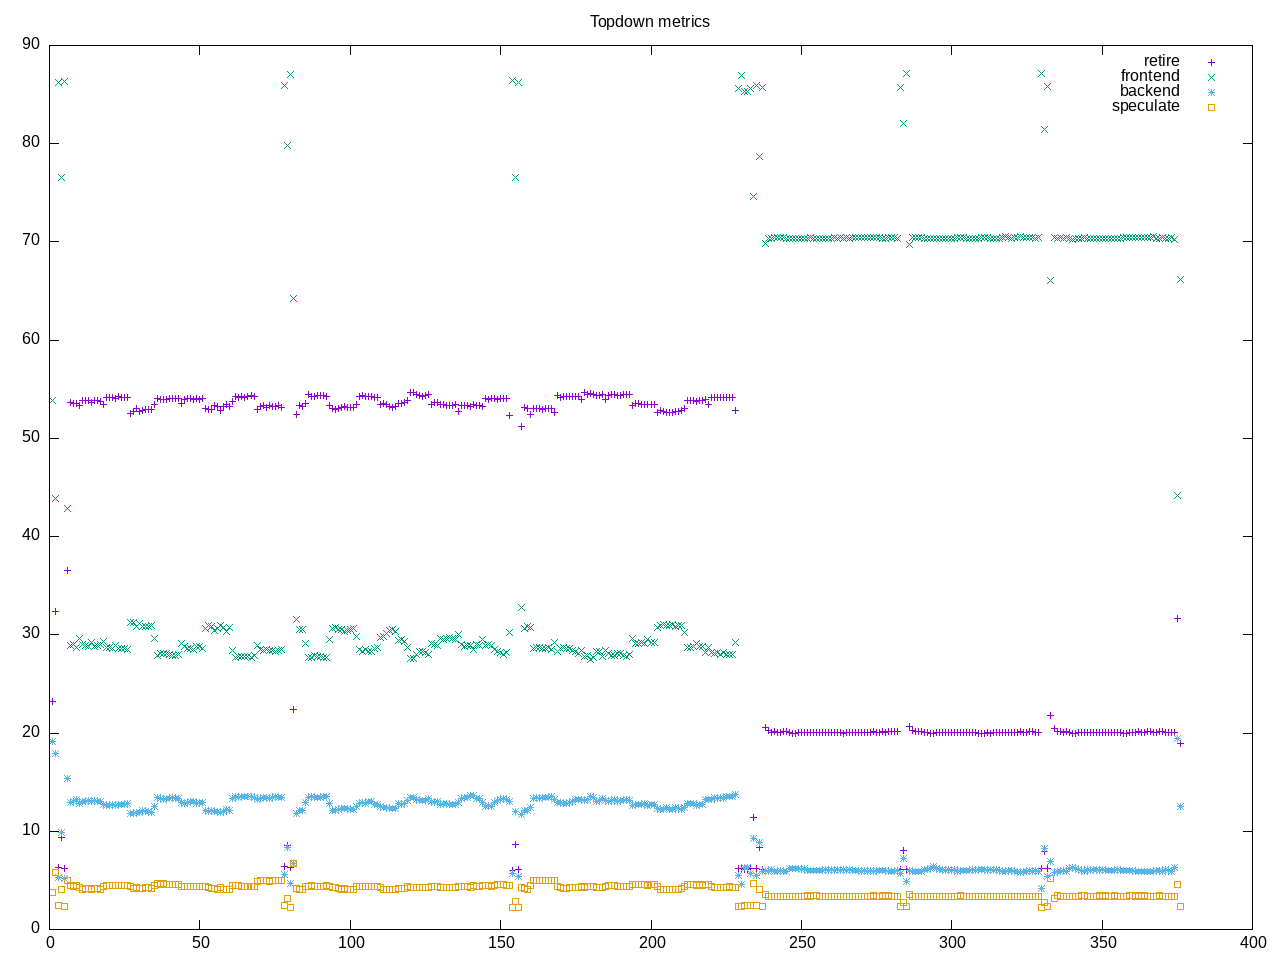
Topdown profile also shows differences with the first benchmark having a high retirement rate and the second having a high frontend stall rate.
AMD metrics are a composite of two workloads. Overall floating point is low as is L2 access.
elapsed              393.151
on_cpu               0.057          # 0.91 / 16 cores
utime                281.243
stime                77.235
nvcsw                146367         # 95.13%
nivcsw               7498           # 4.87%
inblock              0              # 0.00/sec
onblock              14528          # 36.95/sec
cpu-clock            354854029072   # 354.854 seconds
task-clock           354867210755   # 354.867 seconds
page faults          18496906       # 52123.458/sec
context switches     83613          # 235.618/sec
cpu migrations       2298           # 6.476/sec
major page faults    3              # 0.008/sec
minor page faults    18496903       # 52123.449/sec
alignment faults     0              # 0.000/sec
emulation faults     0              # 0.000/sec
branches             691501746318   # 186.096 branches per 1000 inst
branch misses        13327756183    # 1.93% branch miss
conditional          484691666677   # 130.440 conditional branches per 1000 inst
indirect             44447829490    # 11.962 indirect branches per 1000 inst
cpu-cycles           1076880134024  # 0.18 GHz
instructions         3057392583806  # 2.84 IPC
slots                2566636010466  #
retiring             1188139623335  # 46.3% (46.3%)
-- ucode             4079568996     #     0.2%
-- fastpath          1184060054339  #    46.1%
frontend             975034079341   # 38.0% (38.0%)
-- latency           728146780536   #    28.4%
-- bandwidth         246887298805   #     9.6%
backend              296796004508   # 11.6% (11.6%) low
-- cpu               43356948714    #     1.7%
-- memory            253439055794   #     9.9%
speculation          106212861083   #  4.1% ( 4.1%)
-- branch mispredict 103879449591   #     4.0%
-- pipeline restart  2333411492     #     0.1%
smt-contention       452600354      #  0.0% ( 0.0%)
cpu-cycles           1033369601417  # 0.18 GHz
instructions         3141334841769  # 3.04 IPC high
instructions         1187298261309  # 20.856 l2 access per 1000 inst
l2 hit from l1       23345989103    # 10.43% l2 miss
l2 miss from l1      1847949041     #
l2 hit from l2 pf    681645278      #
l3 hit from l2 pf    632360154      #
l3 miss from l2 pf   102782631      #
instructions         1207708553181  # 3.234 float per 1000 inst
float 512            23791          # 0.000 AVX-512 per 1000 inst
float 256            500            # 0.000 AVX-256 per 1000 inst
float 128            3905597522     # 3.234 AVX-128 per 1000 inst
float MMX            0              # 0.000 MMX per 1000 inst
float scalar         0              # 0.000 scalar per 1000 inst
Intel metrics
elapsed              416.979
on_cpu               0.057          # 0.91 / 16 cores
utime                319.135
stime                60.147
nvcsw                214839         # 93.50%
nivcsw               14944          # 6.50%
inblock              448            # 1.07/sec
onblock              3272           # 7.85/sec
cpu-clock            364426344499   # 364.426 seconds
task-clock           365307251906   # 365.307 seconds
page faults          27145131       # 74307.671/sec
context switches     125281         # 342.947/sec
cpu migrations       2929           # 8.018/sec
major page faults    4              # 0.011/sec
minor page faults    27145127       # 74307.660/sec
alignment faults     0              # 0.000/sec
emulation faults     0              # 0.000/sec
branches             618685659451   # 183.140 branches per 1000 inst
branch misses        5287747462     # 0.85% branch miss
conditional          618689074587   # 183.142 conditional branches per 1000 inst
indirect             38653208080    # 11.442 indirect branches per 1000 inst
slots                7018106393480  #
retiring             3226244304670  # 46.0% (46.0%)
-- ucode             171221187428   #     2.4%
-- fastpath          3055023117242  #    43.5%
frontend             2262702074842  # 32.2% (32.2%)
-- latency           1089959647773  #    15.5%
-- bandwidth         1172742427069  #    16.7%
backend              799287594536   # 11.4% (11.4%) low
-- cpu               538113600915   #     7.7%
-- memory            261173993621   #     3.7%
speculation          745634247889   # 10.6% (10.6%) high
-- branch mispredict 670876346091   #     9.6%
-- pipeline restart  74757901798    #     1.1%
smt-contention       0              #  0.0% ( 0.0%)
cpu-cycles           1173997874459  # 0.17 GHz
instructions         3397452090713  # 2.89 IPC
l2 access            76989334669    # 22.683 l2 access per 1000 inst
l2 miss              13542478107    # 17.59% l2 miss
Process overview has 70,000+ instances of perl
73633 processes
	73226 perl                   203.83    21.64
	 68 clinfo                  17.21     5.32
	 38 vulkaninfo               0.96     1.15
	  4 vulkani:disk$0           0.10     0.12
	  6 php                      0.10     0.09
	  6 glxinfo:gdrv0            0.09     0.07
	  6 glxinfo:gl0              0.09     0.07
	  6 clang                    0.07     0.05
	  2 llvmpipe-0               0.05     0.06
	  2 llvmpipe-1               0.05     0.06
	  2 llvmpipe-10              0.05     0.06
	  2 llvmpipe-11              0.05     0.06
	  2 llvmpipe-12              0.05     0.06
	  2 llvmpipe-13              0.05     0.06
	  2 llvmpipe-14              0.05     0.06
	  2 llvmpipe-15              0.05     0.06
	  2 llvmpipe-2               0.05     0.06
	  2 llvmpipe-3               0.05     0.06
	  2 llvmpipe-4               0.05     0.06
	  2 llvmpipe-5               0.05     0.06
	  2 llvmpipe-6               0.05     0.06
	  2 llvmpipe-7               0.05     0.06
	  2 llvmpipe-8               0.05     0.06
	  2 llvmpipe-9               0.05     0.06
	  2 glxinfo                  0.05     0.03
	  2 glxinfo:cs0              0.05     0.03
	  2 glxinfo:disk$0           0.05     0.03
	  2 glxinfo:sh0              0.05     0.03
	  2 glxinfo:shlo0            0.05     0.03
	  3 rocminfo                 0.03     0.00
	  1 lspci                    0.00     0.02
	  1 ps                       0.00     0.01
	101 sh                       0.00     0.00
	 14 uname                    0.00     0.00
	 12 gcc                      0.00     0.00
	 10 gsettings                0.00     0.00
	  8 stat                     0.00     0.00
	  8 systemd-detect-          0.00     0.00
	  6 cat                      0.00     0.00
	  6 cp                       0.00     0.00
	  6 llvm-link                0.00     0.00
	  6 perl-benchmark           0.00     0.00
	  6 rm                       0.00     0.00
	  6 uptime                   0.00     0.00
	  5 phoronix-test-s          0.00     0.00
	  4 gmain                    0.00     0.00
	  2 dconf worker             0.00     0.00
	  2 lscpu                    0.00     0.00
	  2 which                    0.00     0.00
	  2 xset                     0.00     0.00
	  1 cc                       0.00     0.00
	  1 date                     0.00     0.00
	  1 dirname                  0.00     0.00
	  1 dmesg                    0.00     0.00
	  1 dmidecode                0.00     0.00
	  1 grep                     0.00     0.00
	  1 ifconfig                 0.00     0.00
	  1 ip                       0.00     0.00
	  1 lsmod                    0.00     0.00
	  1 mktemp                   0.00     0.00
	  1 qdbus                    0.00     0.00
	  1 readlink                 0.00     0.00
	  1 realpath                 0.00     0.00
	  1 sed                      0.00     0.00
	  1 sort                     0.00     0.00
	  1 stty                     0.00     0.00
	  1 systemctl                0.00     0.00
	  1 template.sh              0.00     0.00
	  1 wc                       0.00     0.00
	  1 xrandr                   0.00     0.00
0 processes running
47 maximum processes