
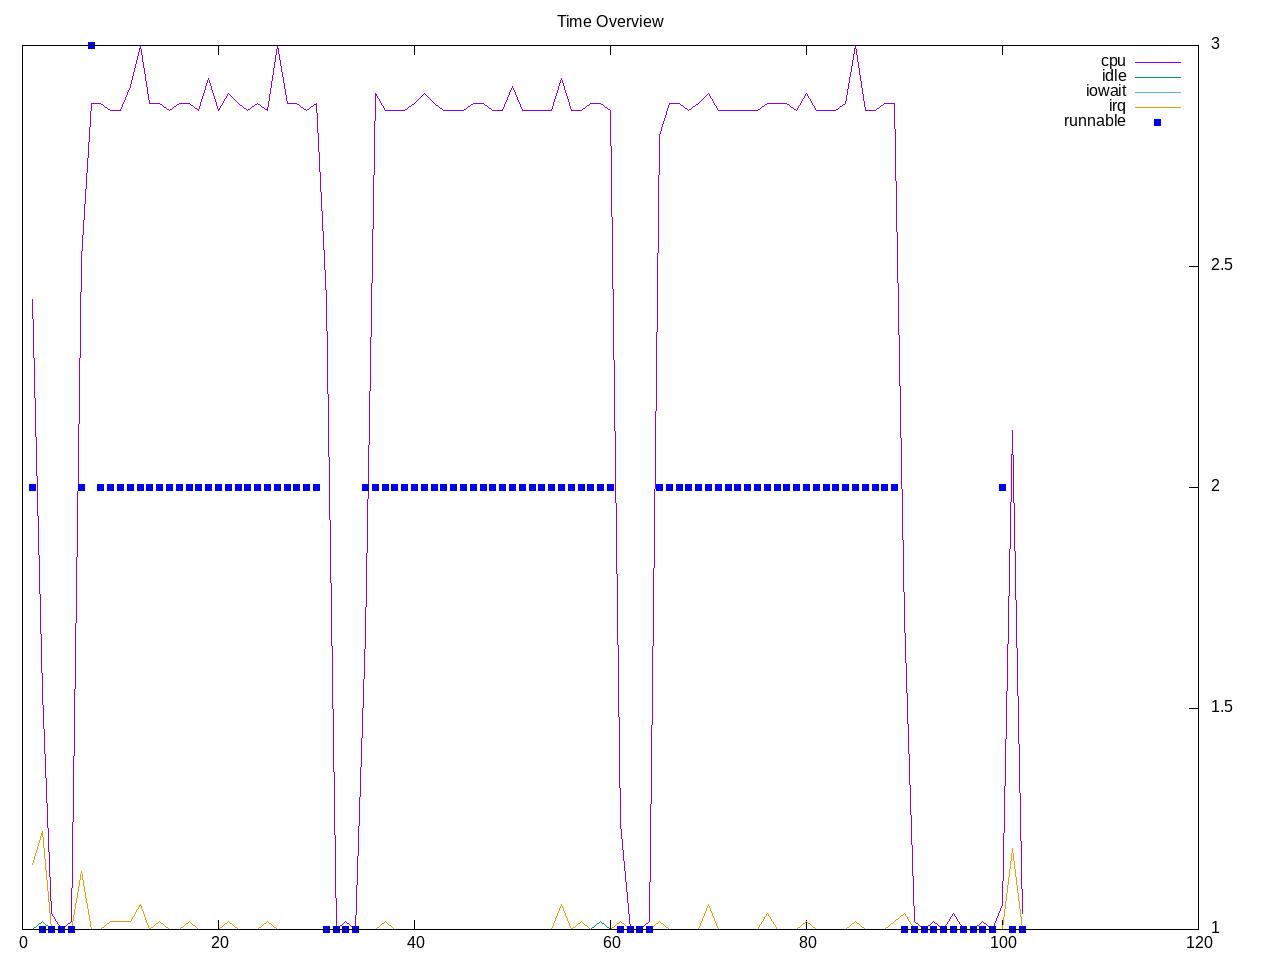
While the binding is in Java, the underlying routines are still in C and the profile is not much different from Scimark. There are six workloads and these are single-threaded.
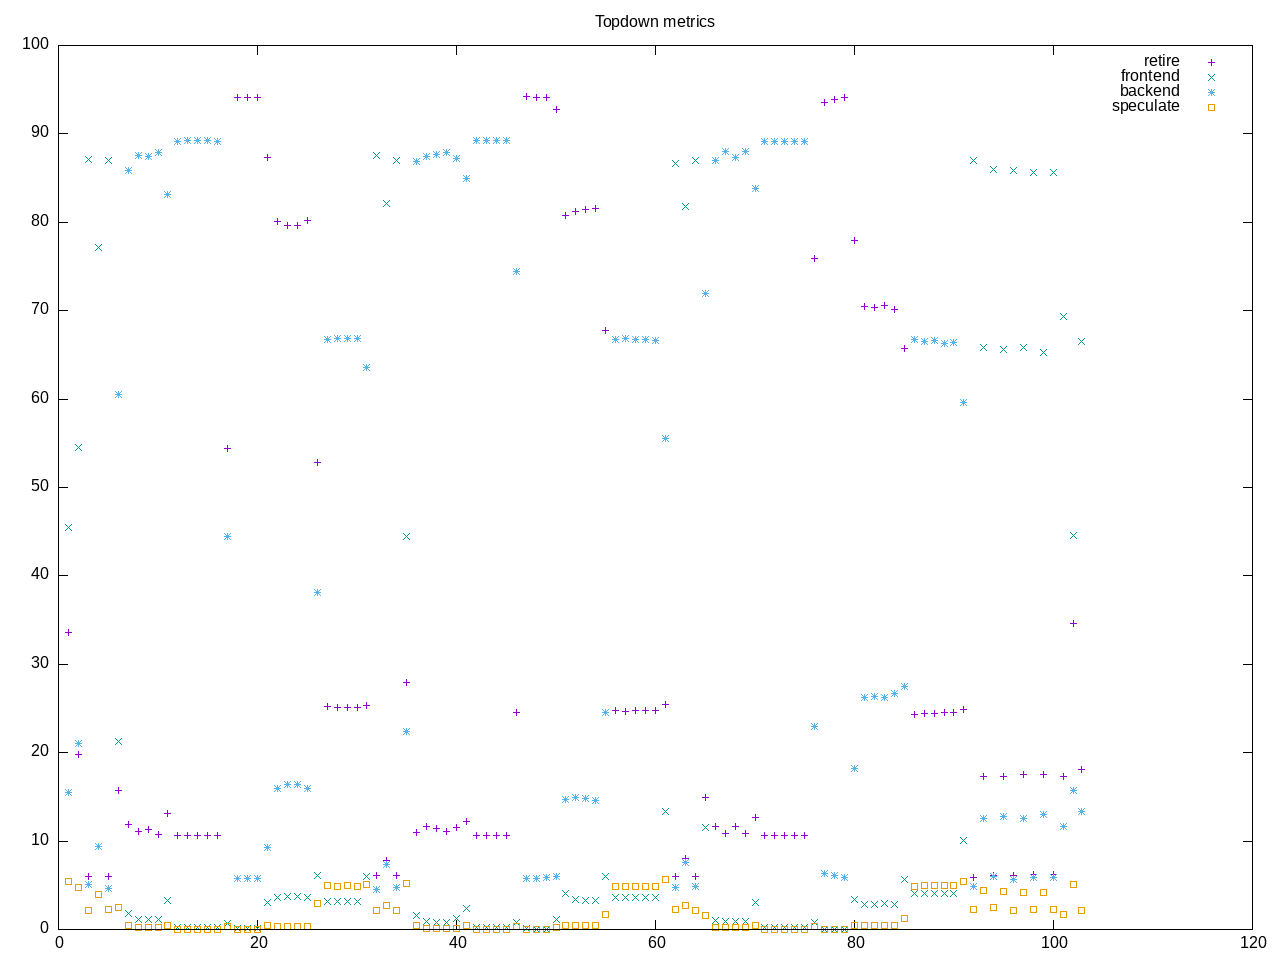
Topdown profile shows differences among the tests. The CPU version has one test with high branch misprediction, but this seems tamped down in the Java version.
AMD metrics confirm single threaded nature
elapsed              101.740
on_cpu               0.048          # 0.77 / 16 cores
utime                77.442
stime                1.123
nvcsw                6061           # 91.45%
nivcsw               567            # 8.55%
inblock              0              # 0.00/sec
onblock              12952          # 127.31/sec
cpu-clock            78566629032    # 78.567 seconds
task-clock           78574938696    # 78.575 seconds
page faults          243844         # 3103.330/sec
context switches     6966           # 88.654/sec
cpu migrations       323            # 4.111/sec
major page faults    2              # 0.025/sec
minor page faults    243835         # 3103.216/sec
alignment faults     0              # 0.000/sec
emulation faults     0              # 0.000/sec
branches             143175014666   # 150.673 branches per 1000 inst
branch misses        369747747      # 0.26% branch miss
conditional          137701502280   # 144.912 conditional branches per 1000 inst
indirect             290449316      # 0.306 indirect branches per 1000 inst
cpu-cycles           357048247322   # 0.22 GHz
instructions         947412030051   # 2.65 IPC
slots                716557155222   #
retiring             294626599862   # 41.1% (41.1%)
-- ucode             22043579       #     0.0%
-- fastpath          294604556283   #    41.1%
frontend             21243854500    #  3.0% ( 3.0%) low
-- latency           12986602212    #     1.8%
-- bandwidth         8257252288     #     1.2%
backend              391269290765   # 54.6% (54.6%)
-- cpu               208947620712   #    29.2%
-- memory            182321670053   #    25.4%
speculation          9364462889     #  1.3% ( 1.3%)
-- branch mispredict 8821180342     #     1.2%
-- pipeline restart  543282547      #     0.1%
smt-contention       52652075       #  0.0% ( 0.0%)
cpu-cycles           355730677372   # 0.22 GHz
instructions         948230791406   # 2.67 IPC
instructions         316779639994   # 59.416 l2 access per 1000 inst
l2 hit from l1       10828793760    # 38.61% l2 miss
l2 miss from l1      2792307207     #
l2 hit from l2 pf    3517655294     #
l3 hit from l2 pf    4354421742     #
l3 miss from l2 pf   120933830      #
instructions         316604203686   # 99.215 float per 1000 inst
float 512            50             # 0.000 AVX-512 per 1000 inst
float 256            648            # 0.000 AVX-256 per 1000 inst
float 128            31412029930    # 99.215 AVX-128 per 1000 inst
float MMX            0              # 0.000 MMX per 1000 inst
float scalar         28             # 0.000 scalar per 1000 inst
Intel metrics
elapsed              402.843
on_cpu               0.054          # 0.86 / 16 cores
utime                344.403
stime                1.434
nvcsw                18472          # 91.84%
nivcsw               1642           # 8.16%
inblock              60192          # 149.42/sec
onblock              4368           # 10.84/sec
cpu-clock            345661731035   # 345.662 seconds
task-clock           345681034487   # 345.681 seconds
page faults          515263         # 1490.574/sec
context switches     21940          # 63.469/sec
cpu migrations       869            # 2.514/sec
major page faults    403            # 1.166/sec
minor page faults    514835         # 1489.335/sec
alignment faults     0              # 0.000/sec
emulation faults     0              # 0.000/sec
branches             455720412495   # 148.354 branches per 1000 inst
branch misses        707526994      # 0.16% branch miss
conditional          455720433455   # 148.354 conditional branches per 1000 inst
indirect             916935931      # 0.298 indirect branches per 1000 inst
slots                1887837681326  #
retiring             733344951086   # 38.8% (38.8%)
-- ucode             44537182261    #     2.4%
-- fastpath          688807768825   #    36.5%
frontend             57289147523    #  3.0% ( 3.0%) low
-- latency           20966437018    #     1.1%
-- bandwidth         36322710505    #     1.9%
backend              1067027486646  # 56.5% (56.5%)
-- cpu               622814566378   #    33.0%
-- memory            444212920268   #    23.5%
speculation          18286255717    #  1.0% ( 1.0%) low
-- branch mispredict 18047855058    #     1.0%
-- pipeline restart  238400659      #     0.0%
smt-contention       0              #  0.0% ( 0.0%)
cpu-cycles           313647299514   # 0.17 GHz
instructions         767158407693   # 2.45 IPC
l2 access            37411980220    # 48.805 l2 access per 1000 inst
l2 miss              22747730612    # 60.80% l2 miss
Process profile gives us some of the JVM processes such as garbage collection
434 processes
	  8 java                   153.24     0.36
	  4 Finalizer               76.62     0.18
	  3 Common-Cleaner          76.59     0.17
	 68 clinfo                  20.52     5.98
	 38 vulkaninfo               1.14     1.52
	  4 vulkani:disk$0           0.12     0.16
	  6 php                      0.08     0.06
	  2 llvmpipe-0               0.06     0.08
	  2 llvmpipe-1               0.06     0.08
	  2 llvmpipe-10              0.06     0.08
	  2 llvmpipe-11              0.06     0.08
	  2 llvmpipe-12              0.06     0.08
	  2 llvmpipe-13              0.06     0.08
	  2 llvmpipe-14              0.06     0.08
	  2 llvmpipe-15              0.06     0.08
	  2 llvmpipe-2               0.06     0.08
	  2 llvmpipe-3               0.06     0.08
	  2 llvmpipe-4               0.06     0.08
	  2 llvmpipe-5               0.06     0.08
	  2 llvmpipe-6               0.06     0.08
	  2 llvmpipe-7               0.06     0.08
	  2 llvmpipe-8               0.06     0.08
	  2 llvmpipe-9               0.06     0.08
	  6 clang                    0.05     0.07
	  3 rocminfo                 0.03     0.00
	 13 C1 CompilerThre          0.00   186.19
	  4 C2 CompilerThre          0.00    76.62
	  4 G1 Conc#0                0.00    76.62
	  4 GC Thread#0              0.00    76.62
	  4 Reference Handl          0.00    76.62
	  4 Service Thread           0.00    76.62
	  4 Signal Dispatch          0.00    76.62
	  4 Sweeper thread           0.00    76.62
	  4 G1 Refine#0              0.00    76.61
	  4 VM Thread                0.00    76.61
	  3 GC Thread#1              0.00    76.59
	  3 GC Thread#2              0.00    76.59
	  3 GC Thread#3              0.00    76.59
	  3 GC Thread#4              0.00    76.59
	  3 GC Thread#5              0.00    76.59
	  3 GC Thread#6              0.00    76.59
	  3 GC Thread#7              0.00    76.59
	  3 GC Thread#8              0.00    76.59
	  3 GC Thread#9              0.00    76.59
	  1 lspci                    0.00     0.03
	  1 ps                       0.00     0.01
	 83 sh                       0.00     0.00
	 13 gsettings                0.00     0.00
	 12 gcc                      0.00     0.00
	  8 stat                     0.00     0.00
	  8 systemd-detect-          0.00     0.00
	  6 llvm-link                0.00     0.00
	  5 phoronix-test-s          0.00     0.00
	  4 G1 Main Marker           0.00     0.00
	  4 G1 Young RemSet          0.00     0.00
	  4 VM Periodic Tas          0.00     0.00
	  4 glxinfo                  0.00     0.00
	  3 java-scimark2            0.00     0.00
	  2 gmain                    0.00     0.00
	  2 lscpu                    0.00     0.00
	  2 setterm                  0.00     0.00
	  2 uname                    0.00     0.00
	  2 which                    0.00     0.00
	  1 cc                       0.00     0.00
	  1 date                     0.00     0.00
	  1 dconf worker             0.00     0.00
	  1 dirname                  0.00     0.00
	  1 dmesg                    0.00     0.00
	  1 dmidecode                0.00     0.00
	  1 grep                     0.00     0.00
	  1 ifconfig                 0.00     0.00
	  1 ip                       0.00     0.00
	  1 lsmod                    0.00     0.00
	  1 mktemp                   0.00     0.00
	  1 qdbus                    0.00     0.00
	  1 readlink                 0.00     0.00
	  1 realpath                 0.00     0.00
	  1 sed                      0.00     0.00
	  1 sort                     0.00     0.00
	  1 stty                     0.00     0.00
	  1 systemctl                0.00     0.00
	  1 template.sh              0.00     0.00
	  1 wc                       0.00     0.00
0 processes running
47 maximum processes
The computation block
      1804315) java-scimark2    cpu=10 start=34.81 finish=60.23
        1804316) java             cpu=4 start=34.81 finish=60.22
          1804317) java             cpu=5 start=34.81 finish=60.22
            1804318) GC Thread#0      cpu=-1 start=34.81 finish=60.22
            1804319) G1 Main Marker   cpu=0 start=34.82 finish=60.20
            1804320) G1 Conc#0        cpu=-1 start=34.82 finish=60.22
            1804321) G1 Refine#0      cpu=-1 start=34.82 finish=60.20
            1804322) G1 Young RemSet  cpu=0 start=34.82 finish=60.20
            1804323) VM Thread        cpu=-1 start=34.83 finish=60.22
              1804335) GC Thread#1      cpu=-1 start=54.74 finish=60.22
              1804336) GC Thread#2      cpu=-1 start=54.74 finish=60.22
              1804337) GC Thread#3      cpu=-1 start=54.74 finish=60.22
              1804338) GC Thread#4      cpu=-1 start=54.74 finish=60.22
              1804339) GC Thread#5      cpu=-1 start=54.74 finish=60.22
              1804340) GC Thread#6      cpu=-1 start=54.74 finish=60.22
              1804341) GC Thread#7      cpu=-1 start=54.74 finish=60.22
              1804342) GC Thread#8      cpu=-1 start=54.74 finish=60.22
              1804343) GC Thread#9      cpu=-1 start=54.74 finish=60.22
            1804324) Reference Handl  cpu=-1 start=34.83 finish=60.22
            1804325) Finalizer        cpu=15 start=34.83 finish=60.22
            1804326) Signal Dispatch  cpu=-1 start=34.83 finish=60.22
            1804327) Service Thread   cpu=-1 start=34.83 finish=60.22
            1804328) C2 CompilerThre  cpu=-1 start=34.83 finish=60.22
              1804331) C1 CompilerThre  cpu=-1 start=34.84 finish=45.13
                1804334) C1 CompilerThre  cpu=-1 start=34.86 finish=35.79
            1804329) C1 CompilerThre  cpu=-1 start=34.83 finish=60.22
              1804344) C1 CompilerThre  cpu=-1 start=60.20 finish=60.22
            1804330) Sweeper thread   cpu=-1 start=34.83 finish=60.22
            1804332) VM Periodic Tas  cpu=0 start=34.84 finish=60.20
            1804333) Common-Cleaner   cpu=13 start=34.84 finish=60.22