
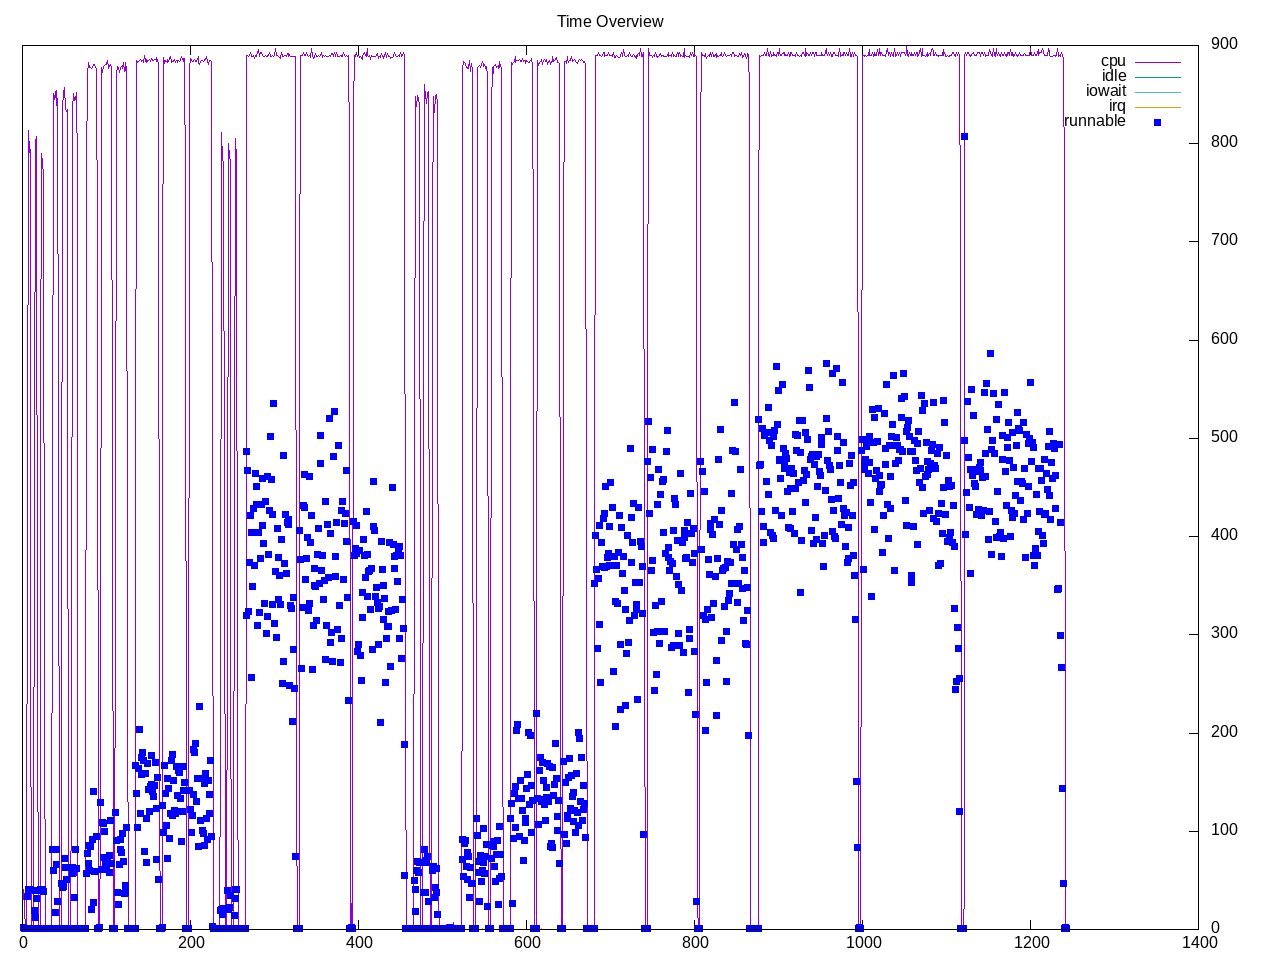
A test of the kernel scheduler. This uses varying amounts of threads and processes as shown in the progression below.
Topdown profile is dominated by frontend stalls with not many backend stalls. Retirement rate is consistent through different numbers of threads/processes.
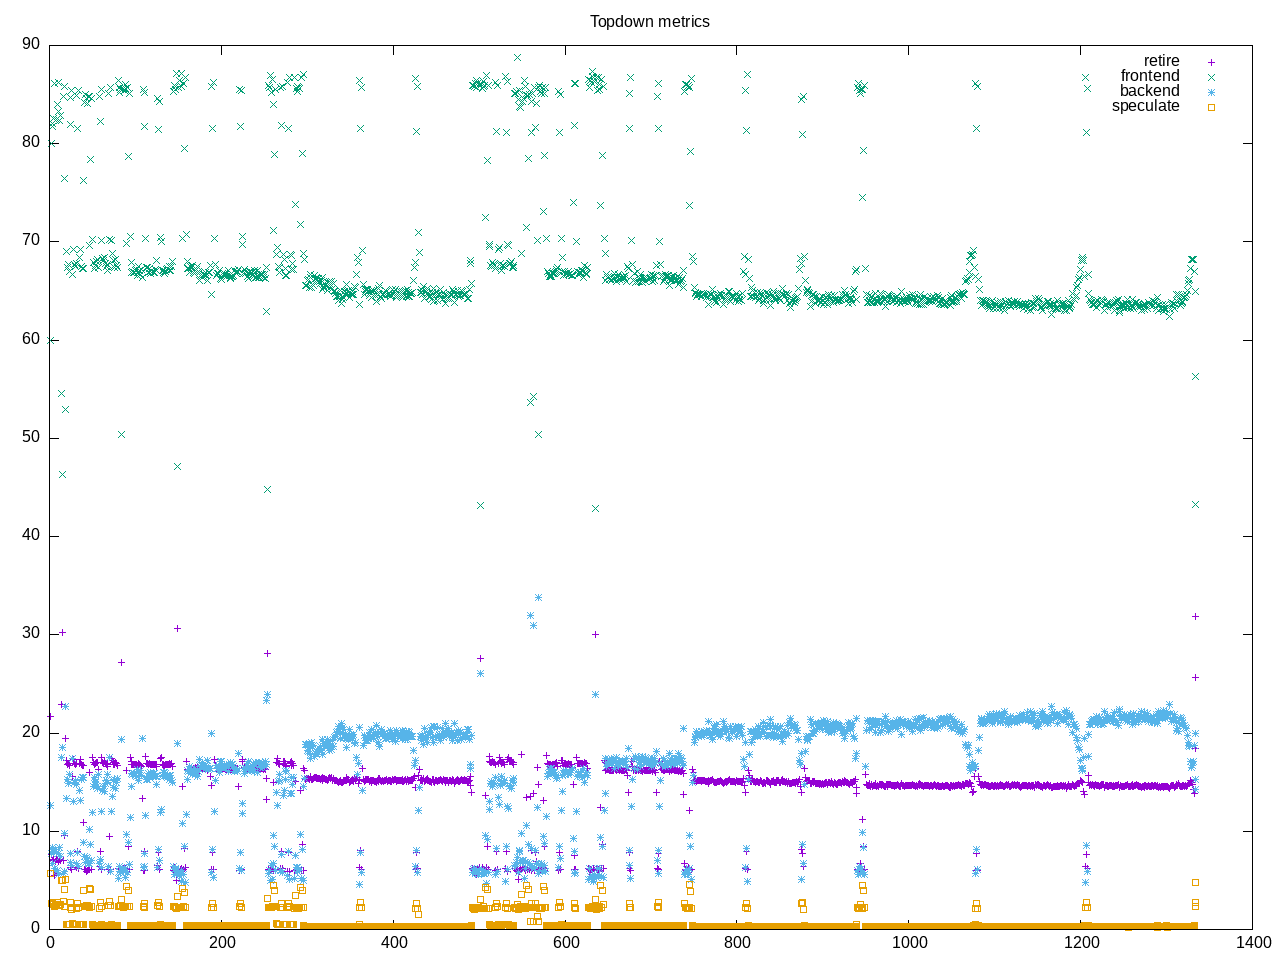
AMD metrics show little floating point or L2 access.
elapsed              3103.839
on_cpu               0.881          # 14.10 / 16 cores
utime                2834.004
stime                40925.639
nvcsw                685247592      # 76.91%
nivcsw               205745161      # 23.09%
inblock              0              # 0.00/sec
onblock              15128          # 4.87/sec
cpu-clock            43755689957976 # 43755.690 seconds
task-clock           43759705281147 # 43759.705 seconds
page faults          689472         # 15.756/sec
context switches     890984992      # 20360.854/sec
cpu migrations       82144359       # 1877.169/sec
major page faults    46             # 0.001/sec
minor page faults    689426         # 15.755/sec
alignment faults     0              # 0.000/sec
emulation faults     0              # 0.000/sec
branches             23501436824532 # 203.654 branches per 1000 inst
branch misses        3032522200893  # 12.90% branch miss
conditional          10698516228519 # 92.709 conditional branches per 1000 inst
indirect             239505493842   # 2.075 indirect branches per 1000 inst
cpu-cycles           91347428654789 # 3.38 GHz
instructions         60895739342932 # 0.67 IPC low
slots                181699842904956 #
retiring             24675428706414 # 13.6% (15.3%)
-- ucode             217739037199   #     0.1%
-- fastpath          24457689669215 #    13.5%
frontend             105015576147955 # 57.8% (65.2%) high
-- latency           88990652940450 #    49.0%
-- bandwidth         16024923207505 #     8.8%
backend              30804556660061 # 17.0% (19.1%)
-- cpu               7074311060381  #     3.9%
-- memory            23730245599680 #    13.1%
speculation          515827690784   #  0.3% ( 0.3%) low
-- branch mispredict 515481404909   #     0.3%
-- pipeline restart  346285875      #     0.0%
smt-contention       20687259190202 # 11.4% ( 0.0%)
cpu-cycles           90504608662935 # 3.21 GHz
instructions         61341111308824 # 0.68 IPC low
instructions         20314482395291 # 35.427 l2 access per 1000 inst
l2 hit from l1       575062511723   # 16.81% l2 miss
l2 miss from l1      70863633140    #
l2 hit from l2 pf    94475719768    #
l3 hit from l2 pf    35652924877    #
l3 miss from l2 pf   14483398129    #
instructions         20307336146846 # 21.070 float per 1000 inst
float 512            103            # 0.000 AVX-512 per 1000 inst
float 256            498            # 0.000 AVX-256 per 1000 inst
float 128            427884882765   # 21.070 AVX-128 per 1000 inst
float MMX            0              # 0.000 MMX per 1000 inst
float scalar         0              # 0.000 scalar per 1000 inst
Intel metrics
elapsed              1286.246
on_cpu               0.786          # 12.58 / 16 cores
utime                1244.302
stime                14940.373
nvcsw                276770340      # 81.39%
nivcsw               63265868       # 18.61%
inblock              600            # 0.47/sec
onblock              3176           # 2.47/sec
cpu-clock            16176082544622 # 16176.083 seconds
task-clock           16179007940539 # 16179.008 seconds
page faults          431645         # 26.679/sec
context switches     340031467      # 21016.830/sec
cpu migrations       41546880       # 2567.950/sec
major page faults    48             # 0.003/sec
minor page faults    431597         # 26.676/sec
alignment faults     0              # 0.000/sec
emulation faults     0              # 0.000/sec
branches             9419060412929  # 164.638 branches per 1000 inst
branch misses        44100542658    # 0.47% branch miss
conditional          9419061039425  # 164.638 conditional branches per 1000 inst
indirect             2849081581423  # 49.800 indirect branches per 1000 inst
slots                93413724946706 #
retiring             39970625421293 # 42.8% (42.8%)
-- ucode             7326098617840  #     7.8%
-- fastpath          32644526803453 #    34.9%
frontend             40717041467788 # 43.6% (43.6%)
-- latency           18873031629963 #    20.2%
-- bandwidth         21844009837825 #    23.4%
backend              9785979087670  # 10.5% (10.5%) low
-- cpu               3709347493414  #     4.0%
-- memory            6076631594256  #     6.5%
speculation          2982448418427  #  3.2% ( 3.2%)
-- branch mispredict 2689553597192  #     2.9%
-- pipeline restart  292894821235   #     0.3%
smt-contention       0              #  0.0% ( 0.0%)
cpu-cycles           48091671451085 # 2.48 GHz
instructions         53251990904221 # 1.11 IPC
l2 access            909727906941   # 33.186 l2 access per 1000 inst
l2 miss              327415399029   # 35.99% l2 miss
Process overview gives 1291 as maximum number of active processes.
28052 processes
	27628 hackbench_bin        163474.49 2273324.74
	 68 clinfo                  17.20     5.65
	 38 vulkaninfo               0.76     1.52
	  6 php                      0.18     0.41
	  6 glxinfo:gdrv0            0.09     0.10
	  6 glxinfo:gl0              0.09     0.10
	  6 clang                    0.09     0.03
	  4 vulkani:disk$0           0.08     0.16
	  2 glxinfo                  0.05     0.04
	  2 glxinfo:cs0              0.05     0.04
	  2 glxinfo:disk$0           0.05     0.04
	  2 glxinfo:sh0              0.05     0.04
	  2 glxinfo:shlo0            0.05     0.04
	  2 llvmpipe-0               0.04     0.08
	  2 llvmpipe-1               0.04     0.08
	  2 llvmpipe-10              0.04     0.08
	  2 llvmpipe-11              0.04     0.08
	  2 llvmpipe-12              0.04     0.08
	  2 llvmpipe-13              0.04     0.08
	  2 llvmpipe-14              0.04     0.08
	  2 llvmpipe-15              0.04     0.08
	  2 llvmpipe-2               0.04     0.08
	  2 llvmpipe-3               0.04     0.08
	  2 llvmpipe-4               0.04     0.08
	  2 llvmpipe-5               0.04     0.08
	  2 llvmpipe-6               0.04     0.08
	  2 llvmpipe-7               0.04     0.08
	  2 llvmpipe-8               0.04     0.08
	  2 llvmpipe-9               0.04     0.08
	  3 rocminfo                 0.03     0.00
	  1 lspci                    0.00     0.03
	  1 ps                       0.00     0.01
	102 sh                       0.00     0.00
	 56 hackbench                0.00     0.00
	 13 gcc                      0.00     0.00
	  8 gsettings                0.00     0.00
	  8 stat                     0.00     0.00
	  8 systemd-detect-          0.00     0.00
	  6 llvm-link                0.00     0.00
	  5 gmain                    0.00     0.00
	  5 phoronix-test-s          0.00     0.00
	  3 dconf worker             0.00     0.00
	  2 cc                       0.00     0.00
	  2 lscpu                    0.00     0.00
	  2 uname                    0.00     0.00
	  2 which                    0.00     0.00
	  2 xset                     0.00     0.00
	  1 date                     0.00     0.00
	  1 dirname                  0.00     0.00
	  1 dmesg                    0.00     0.00
	  1 dmidecode                0.00     0.00
	  1 grep                     0.00     0.00
	  1 ifconfig                 0.00     0.00
	  1 ip                       0.00     0.00
	  1 lsmod                    0.00     0.00
	  1 mktemp                   0.00     0.00
	  1 qdbus                    0.00     0.00
	  1 readlink                 0.00     0.00
	  1 realpath                 0.00     0.00
	  1 sed                      0.00     0.00
	  1 sort                     0.00     0.00
	  1 stty                     0.00     0.00
	  1 systemctl                0.00     0.00
	  1 template.sh              0.00     0.00
	  1 wc                       0.00     0.00
	  1 xrandr                   0.00     0.00
0 processes running
1291 maximum processes
Computation structure is straightforward
      2544825) hackbench        cpu=7 start=6.59  finish=10.49
        2544826) hackbench_bin    cpu=8 start=6.60  finish=10.49
          2544827) hackbench_bin    cpu=3 start=6.60  finish=10.49
          2544828) hackbench_bin    cpu=6 start=6.60  finish=10.49
          2544829) hackbench_bin    cpu=0 start=6.60  finish=10.49
          2544830) hackbench_bin    cpu=12 start=6.60  finish=10.49
          2544831) hackbench_bin    cpu=13 start=6.60  finish=10.49
          2544832) hackbench_bin    cpu=4 start=6.60  finish=10.49
          2544833) hackbench_bin    cpu=9 start=6.60  finish=10.49
          2544834) hackbench_bin    cpu=5 start=6.60  finish=10.49
          2544835) hackbench_bin    cpu=8 start=6.60  finish=10.49
          2544836) hackbench_bin    cpu=14 start=6.60  finish=10.49
          2544837) hackbench_bin    cpu=15 start=6.60  finish=10.49
          2544838) hackbench_bin    cpu=12 start=6.60  finish=10.49
          2544839) hackbench_bin    cpu=0 start=6.60  finish=10.49
          2544840) hackbench_bin    cpu=4 start=6.60  finish=10.49
          2544841) hackbench_bin    cpu=6 start=6.60  finish=10.49
          2544842) hackbench_bin    cpu=1 start=6.60  finish=10.49
          2544843) hackbench_bin    cpu=11 start=6.60  finish=10.49
          2544844) hackbench_bin    cpu=5 start=6.60  finish=10.49
          2544845) hackbench_bin    cpu=12 start=6.60  finish=10.49
          2544846) hackbench_bin    cpu=8 start=6.60  finish=10.49
          2544847) hackbench_bin    cpu=7 start=6.60  finish=10.49
          2544848) hackbench_bin    cpu=13 start=6.60  finish=10.46
          2544849) hackbench_bin    cpu=2 start=6.60  finish=10.45
          2544850) hackbench_bin    cpu=5 start=6.60  finish=10.48
          2544851) hackbench_bin    cpu=2 start=6.60  finish=10.45
          2544852) hackbench_bin    cpu=10 start=6.60  finish=10.48
          2544853) hackbench_bin    cpu=8 start=6.60  finish=10.41
          2544854) hackbench_bin    cpu=14 start=6.60  finish=10.44
          2544855) hackbench_bin    cpu=11 start=6.60  finish=10.46
          2544856) hackbench_bin    cpu=8 start=6.60  finish=10.46
          2544857) hackbench_bin    cpu=7 start=6.60  finish=10.42
          2544858) hackbench_bin    cpu=11 start=6.60  finish=10.48
          2544859) hackbench_bin    cpu=0 start=6.60  finish=10.40
          2544860) hackbench_bin    cpu=8 start=6.60  finish=10.43
          2544861) hackbench_bin    cpu=14 start=6.60  finish=10.45
          2544862) hackbench_bin    cpu=0 start=6.60  finish=10.44
          2544863) hackbench_bin    cpu=12 start=6.60  finish=10.48
          2544864) hackbench_bin    cpu=7 start=6.60  finish=10.47
          2544865) hackbench_bin    cpu=9 start=6.60  finish=10.49
          2544866) hackbench_bin    cpu=1 start=6.60  finish=10.45