
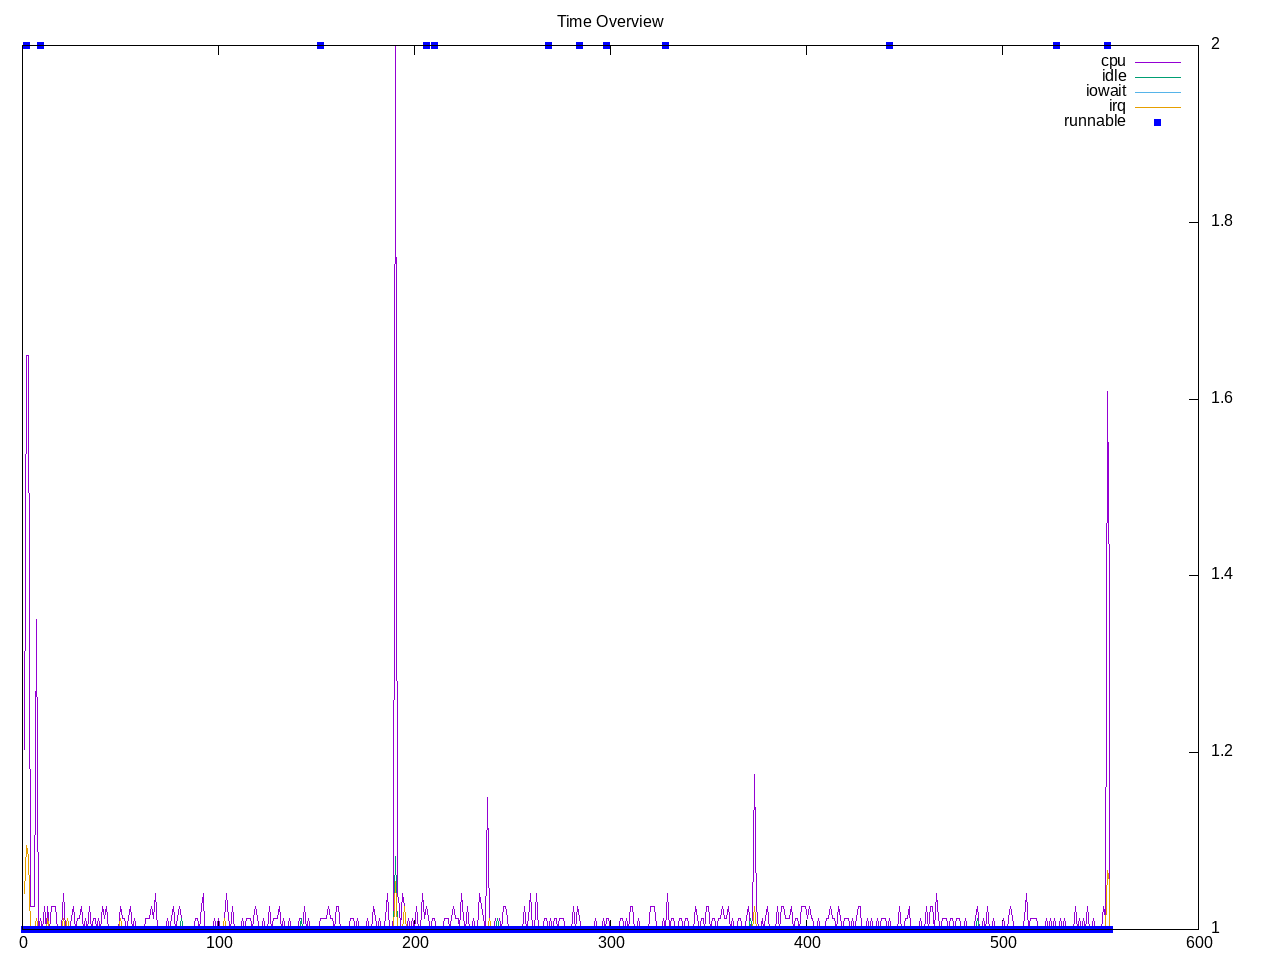
A Vulkan compute benchmark. Perhaps using GPU more than CPU, but interesting to see as a workload. The scores for AMD are ~4x that of Intel and the “on cpu” for AMD is extremely low, so likely this is a GPU benchmark on AMD and not a CPU benchmark.
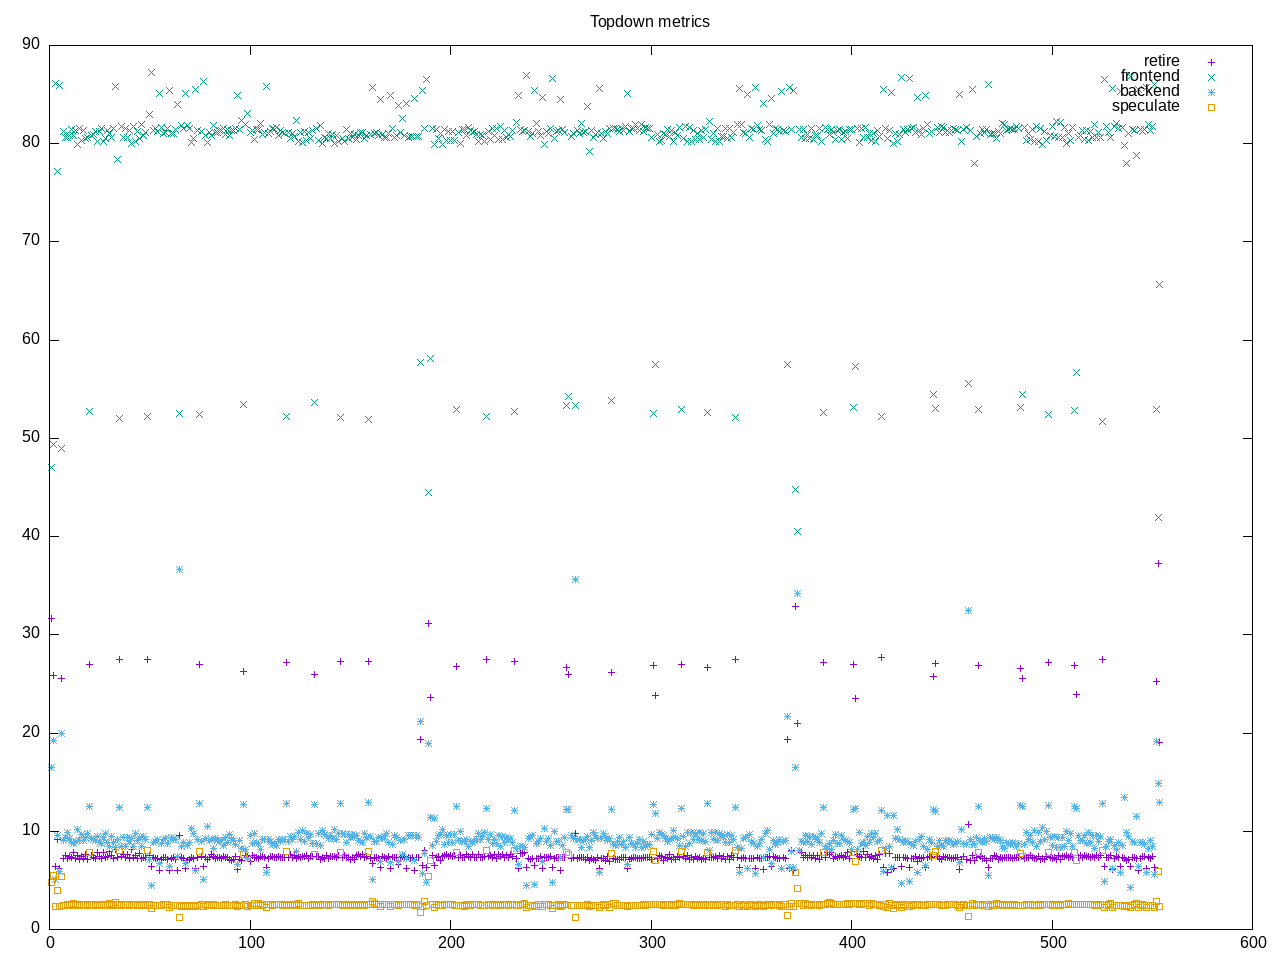
Topdown profile not as interesting for a GPU workload. Most of the limited time is in frontend stalls.
AMD metrics
elapsed              553.514
on_cpu               0.000          # 0.00 / 16 cores
utime                1.526
stime                1.212
nvcsw                2733           # 86.98%
nivcsw               409            # 13.02%
inblock              0              # 0.00/sec
onblock              12856          # 23.23/sec
cpu-clock            2855338425     # 2.855 seconds
task-clock           2868514388     # 2.869 seconds
page faults          188333         # 65655.240/sec
context switches     5740           # 2001.036/sec
cpu migrations       365            # 127.244/sec
major page faults    2              # 0.697/sec
minor page faults    188331         # 65654.543/sec
alignment faults     0              # 0.000/sec
emulation faults     0              # 0.000/sec
branches             2368093368     # 193.615 branches per 1000 inst
branch misses        95611140       # 4.04% branch miss
conditional          1562371350     # 127.739 conditional branches per 1000 inst
indirect             71829798       # 5.873 indirect branches per 1000 inst
cpu-cycles           6729727183     # 0.00 GHz
instructions         11277840703    # 1.68 IPC
slots                14128227432    #
retiring             4129006916     # 29.2% (29.2%)
-- ucode             14670688       #     0.1%
-- fastpath          4114336228     #    29.1%
frontend             6880000619     # 48.7% (48.7%) high
-- latency           5825721654     #    41.2%
-- bandwidth         1054278965     #     7.5%
backend              2397483487     # 17.0% (17.0%) low
-- cpu               367027234      #     2.6%
-- memory            2030456253     #    14.4%
speculation          712684044      #  5.0% ( 5.0%)
-- branch mispredict 705290499      #     5.0%
-- pipeline restart  7393545        #     0.1%
smt-contention       8850370        #  0.1% ( 0.0%)
cpu-cycles           6758209267     # 0.00 GHz
instructions         11770449191    # 1.74 IPC
instructions         4184068846     # 37.128 l2 access per 1000 inst
l2 hit from l1       133916262      # 20.49% l2 miss
l2 miss from l1      20575948       #
l2 hit from l2 pf    10174800       #
l3 hit from l2 pf    5159661        #
l3 miss from l2 pf   6096840        #
instructions         4024389819     # 16.687 float per 1000 inst
float 512            60             # 0.000 AVX-512 per 1000 inst
float 256            620            # 0.000 AVX-256 per 1000 inst
float 128            67152429       # 16.686 AVX-128 per 1000 inst
float MMX            0              # 0.000 MMX per 1000 inst
float scalar         0              # 0.000 scalar per 1000 inst
Intel metrics
elapsed              487.511
on_cpu               0.000          # 0.00 / 16 cores
utime                1.679
stime                0.655
nvcsw                2699           # 93.98%
nivcsw               173            # 6.02%
inblock              15608          # 32.02/sec
onblock              1944           # 3.99/sec
cpu-clock            2416426268     # 2.416 seconds
task-clock           2426124568     # 2.426 seconds
page faults          173841         # 71653.782/sec
context switches     5143           # 2119.842/sec
cpu migrations       261            # 107.579/sec
major page faults    77             # 31.738/sec
minor page faults    173764         # 71622.044/sec
alignment faults     0              # 0.000/sec
emulation faults     0              # 0.000/sec
branches             2151066026     # 188.267 branches per 1000 inst
branch misses        28106902       # 1.31% branch miss
conditional          2151078154     # 188.268 conditional branches per 1000 inst
indirect             74254188       # 6.499 indirect branches per 1000 inst
slots                31725273092    #
retiring             10600531446    # 33.4% (33.4%)
-- ucode             1170997398     #     3.7%
-- fastpath          9429534048     #    29.7%
frontend             8715553434     # 27.5% (27.5%)
-- latency           4390001681     #    13.8%
-- bandwidth         4325551753     #    13.6%
backend              8702700014     # 27.4% (27.4%)
-- cpu               2757085515     #     8.7%
-- memory            5945614499     #    18.7%
speculation          3449049077     # 10.9% (10.9%) high
-- branch mispredict 3212998733     #    10.1%
-- pipeline restart  236050344      #     0.7%
smt-contention       0              #  0.0% ( 0.0%)
cpu-cycles           5320185366     # 0.00 GHz
instructions         10362909825    # 1.95 IPC
l2 access            370759599      # 36.047 l2 access per 1000 inst
l2 miss              143647561      # 38.74% l2 miss
Process overview shows the time is in the test scaffold
356 processes
	 68 clinfo                  19.85     6.32
	 38 vulkaninfo               1.14     1.50
	  6 vkpeak                   0.43     0.36
	  3 vkpeak:disk$0            0.43     0.36
	  6 glxinfo:gdrv0            0.13     0.04
	  6 glxinfo:gl0              0.13     0.04
	  4 vulkani:disk$0           0.12     0.16
	  2 glxinfo                  0.08     0.02
	  2 glxinfo:cs0              0.08     0.02
	  2 glxinfo:disk$0           0.08     0.02
	  2 glxinfo:sh0              0.08     0.02
	  2 glxinfo:shlo0            0.08     0.02
	  6 php                      0.06     0.23
	  2 llvmpipe-0               0.06     0.08
	  2 llvmpipe-1               0.06     0.08
	  2 llvmpipe-10              0.06     0.08
	  2 llvmpipe-11              0.06     0.08
	  2 llvmpipe-12              0.06     0.08
	  2 llvmpipe-13              0.06     0.08
	  2 llvmpipe-14              0.06     0.08
	  2 llvmpipe-15              0.06     0.08
	  2 llvmpipe-2               0.06     0.08
	  2 llvmpipe-3               0.06     0.08
	  2 llvmpipe-4               0.06     0.08
	  2 llvmpipe-5               0.06     0.08
	  2 llvmpipe-6               0.06     0.08
	  2 llvmpipe-7               0.06     0.08
	  2 llvmpipe-8               0.06     0.08
	  2 llvmpipe-9               0.06     0.08
	  6 clang                    0.05     0.07
	  3 rocminfo                 0.03     0.00
	  1 lspci                    0.01     0.02
	  1 ps                       0.00     0.01
	 82 sh                       0.00     0.00
	 15 gsettings                0.00     0.00
	 12 gcc                      0.00     0.00
	  9 systemd-detect-          0.00     0.00
	  8 stat                     0.00     0.00
	  6 llvm-link                0.00     0.00
	  5 phoronix-test-s          0.00     0.00
	  2 lscpu                    0.00     0.00
	  2 uname                    0.00     0.00
	  2 which                    0.00     0.00
	  2 xset                     0.00     0.00
	  1 cc                       0.00     0.00
	  1 date                     0.00     0.00
	  1 dirname                  0.00     0.00
	  1 dmesg                    0.00     0.00
	  1 dmidecode                0.00     0.00
	  1 gmain                    0.00     0.00
	  1 grep                     0.00     0.00
	  1 ifconfig                 0.00     0.00
	  1 ip                       0.00     0.00
	  1 lsmod                    0.00     0.00
	  1 mktemp                   0.00     0.00
	  1 qdbus                    0.00     0.00
	  1 readlink                 0.00     0.00
	  1 realpath                 0.00     0.00
	  1 sed                      0.00     0.00
	  1 sort                     0.00     0.00
	  1 stty                     0.00     0.00
	  1 systemctl                0.00     0.00
	  1 template.sh              0.00     0.00
	  1 wc                       0.00     0.00
	  1 xrandr                   0.00     0.00
0 processes running
47 maximum processes
Computation blocks
      2603431) vkpeak           cpu=3 start=6.66  finish=185.81
        2603432) vkpeak           cpu=15 start=6.67  finish=185.81
          2603433) vkpeak:disk$0    cpu=13 start=6.70  finish=185.81
      2603439) vkpeak           cpu=4 start=189.82 finish=369.02
        2603440) vkpeak           cpu=15 start=189.82 finish=369.01
          2603441) vkpeak:disk$0    cpu=9 start=189.85 finish=369.01
      2603443) vkpeak           cpu=8 start=373.02 finish=552.26
        2603444) vkpeak           cpu=11 start=373.03 finish=552.25
          2603445) vkpeak:disk$0    cpu=15 start=373.06 finish=552.25