
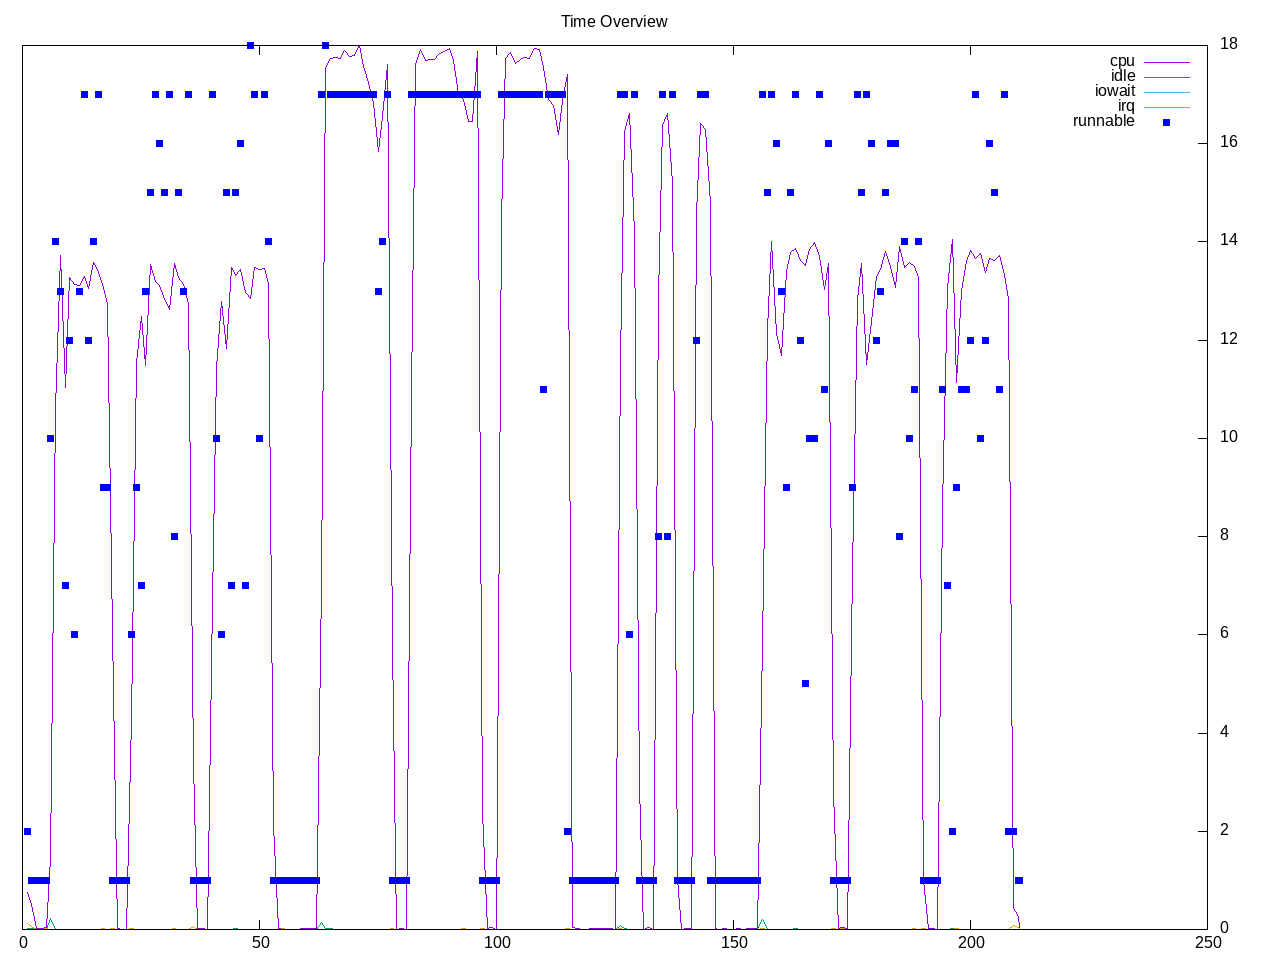
Dav1d is an AV1 video decoder. The test profile decodes four test cases. Looks like the second is the most parallel and the others are more varied.
Topdown profile shows variation among the four workloads with backend stalls being the highest.
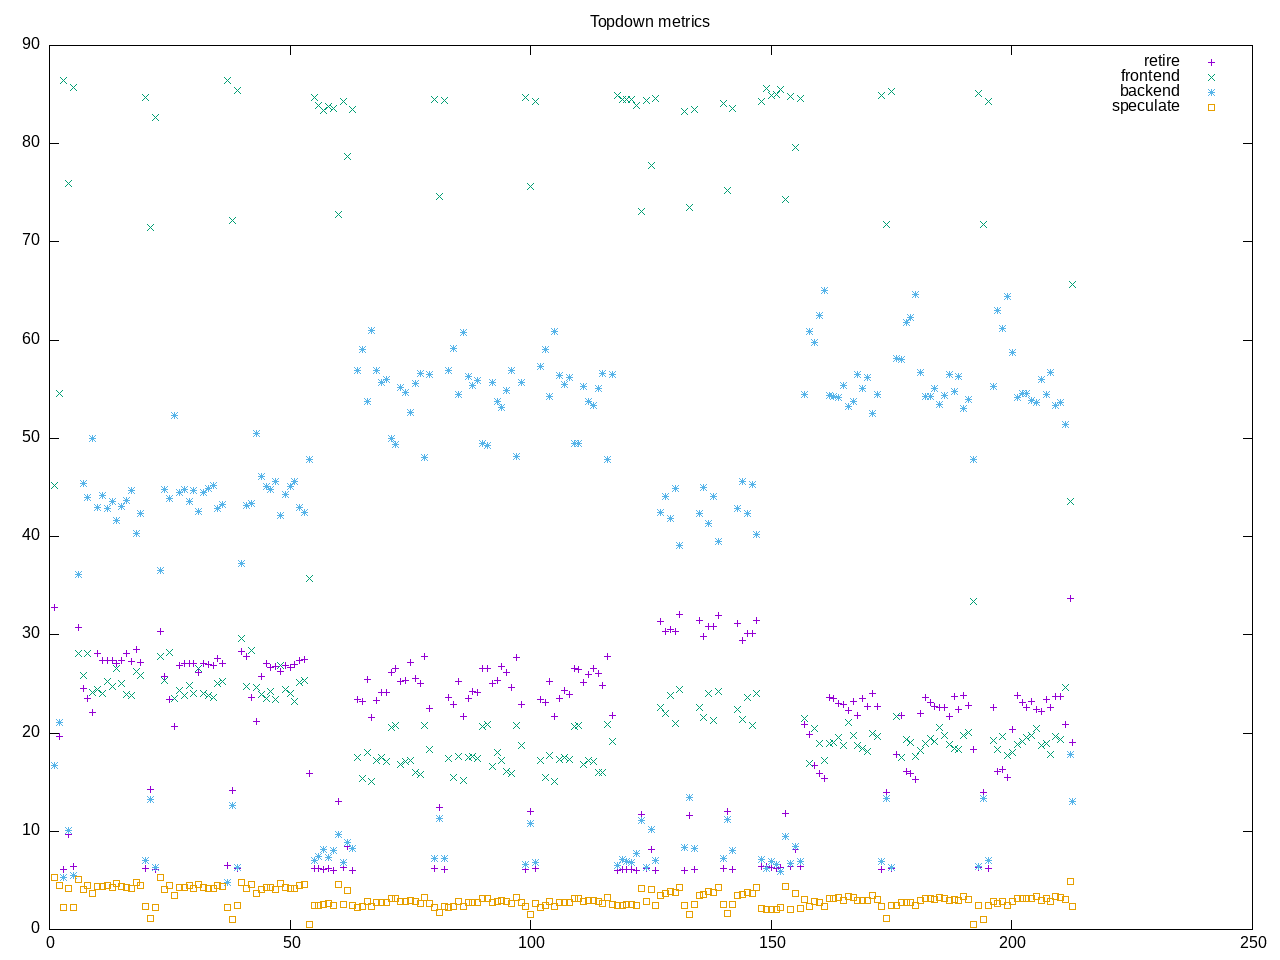
AMD metrics show moderate amount of floating point and L2 access. Backend memory stalls are almost a third.
elapsed              213.115
on_cpu               0.549          # 8.78 / 16 cores
utime                1805.063
stime                66.539
nvcsw                7292893        # 99.54%
nivcsw               33533          # 0.46%
inblock              8              # 0.04/sec
onblock              32120          # 150.72/sec
cpu-clock            1868875848465  # 1868.876 seconds
task-clock           1871235081315  # 1871.235 seconds
page faults          1296792        # 693.014/sec
context switches     7327292        # 3915.752/sec
cpu migrations       259220         # 138.529/sec
major page faults    114            # 0.061/sec
minor page faults    1296678        # 692.953/sec
alignment faults     0              # 0.000/sec
emulation faults     0              # 0.000/sec
branches             797429608804   # 91.153 branches per 1000 inst
branch misses        31051314265    # 3.89% branch miss
conditional          554521597992   # 63.387 conditional branches per 1000 inst
indirect             31801373582    # 3.635 indirect branches per 1000 inst
cpu-cycles           7341843796700  # 2.16 GHz
instructions         8777978628368  # 1.20 IPC
slots                14651540873352 #
retiring             3052095062857  # 20.8% (24.6%)
-- ucode             9469121995     #     0.1%
-- fastpath          3042625940862  #    20.8%
frontend             2509044102042  # 17.1% (20.2%)
-- latency           1787348551950  #    12.2%
-- bandwidth         721695550092   #     4.9%
backend              6416392439737  # 43.8% (51.8%)
-- cpu               1756022735988  #    12.0%
-- memory            4660369703749  #    31.8%
speculation          412129118255   #  2.8% ( 3.3%)
-- branch mispredict 400255856656   #     2.7%
-- pipeline restart  11873261599    #     0.1%
smt-contention       2260744776351  # 15.4% ( 0.0%)
cpu-cycles           7322460098899  # 2.16 GHz
instructions         8771050990318  # 1.20 IPC
instructions         2918023070070  # 42.342 l2 access per 1000 inst
l2 hit from l1       98802700440    # 20.41% l2 miss
l2 miss from l1      16287763107    #
l2 hit from l2 pf    15816267300    #
l3 hit from l2 pf    5099496907     #
l3 miss from l2 pf   3835063557     #
instructions         2907823574044  # 78.422 float per 1000 inst
float 512            71             # 0.000 AVX-512 per 1000 inst
float 256            780909299      # 0.269 AVX-256 per 1000 inst
float 128            227256236913   # 78.153 AVX-128 per 1000 inst
float MMX            0              # 0.000 MMX per 1000 inst
float scalar         0              # 0.000 scalar per 1000 inst
Intel metrics
elapsed              310.147
on_cpu               0.595          # 9.52 / 16 cores
utime                2887.159
stime                64.256
nvcsw                7951545        # 98.51%
nivcsw               120051         # 1.49%
inblock              1128           # 3.64/sec
onblock              21720          # 70.03/sec
cpu-clock            2944930192235  # 2944.930 seconds
task-clock           2947005189952  # 2947.005 seconds
page faults          1327781        # 450.553/sec
context switches     8072952        # 2739.375/sec
cpu migrations       462799         # 157.040/sec
major page faults    51             # 0.017/sec
minor page faults    1327730        # 450.535/sec
alignment faults     0              # 0.000/sec
emulation faults     0              # 0.000/sec
branches             953131786197   # 82.134 branches per 1000 inst
branch misses        36337085889    # 3.81% branch miss
conditional          953131806421   # 82.134 conditional branches per 1000 inst
indirect             291031404595   # 25.079 indirect branches per 1000 inst
slots                14767434767564 #
retiring             6255263054310  # 42.4% (42.4%)
-- ucode             555928141851   #     3.8%
-- fastpath          5699334912459  #    38.6%
frontend             3164173402768  # 21.4% (21.4%)
-- latency           1771171686807  #    12.0%
-- bandwidth         1393001715961  #     9.4%
backend              3663495894120  # 24.8% (24.8%)
-- cpu               1313061620123  #     8.9%
-- memory            2350434273997  #    15.9%
speculation          1538479772866  # 10.4% (10.4%) high
-- branch mispredict 1426065334132  #     9.7%
-- pipeline restart  112414438734   #     0.8%
smt-contention       0              #  0.0% ( 0.0%)
cpu-cycles           10440337596098 # 1.94 GHz
instructions         14928314665212 # 1.43 IPC
l2 access            244374955407   # 35.293 l2 access per 1000 inst
l2 miss              70966808581    # 29.04% l2 miss
Process overview shows dav1d and dav1d-worker as taking the most time.
570 processes
	192 dav1d-worker         28840.16   673.60
	 24 dav1d                 1802.51    42.24
	 68 clinfo                  17.19     5.66
	 38 vulkaninfo               0.95     1.15
	  6 php                      0.62     0.13
	  4 vulkani:disk$0           0.11     0.13
	  6 glxinfo:gdrv0            0.11     0.06
	  6 glxinfo:gl0              0.11     0.06
	  2 llvmpipe-0               0.06     0.07
	  2 llvmpipe-1               0.06     0.07
	  2 llvmpipe-10              0.06     0.07
	  2 llvmpipe-11              0.06     0.07
	  2 llvmpipe-12              0.06     0.07
	  2 llvmpipe-13              0.06     0.07
	  2 llvmpipe-14              0.06     0.07
	  2 llvmpipe-15              0.06     0.07
	  2 llvmpipe-2               0.06     0.07
	  2 llvmpipe-3               0.06     0.07
	  2 llvmpipe-4               0.06     0.07
	  2 llvmpipe-5               0.06     0.07
	  2 llvmpipe-6               0.06     0.07
	  2 llvmpipe-7               0.06     0.07
	  2 llvmpipe-8               0.06     0.07
	  2 llvmpipe-9               0.06     0.07
	  2 glxinfo                  0.06     0.03
	  2 glxinfo:cs0              0.06     0.03
	  2 glxinfo:disk$0           0.06     0.03
	  2 glxinfo:sh0              0.06     0.03
	  2 glxinfo:shlo0            0.06     0.03
	  6 clang                    0.05     0.07
	  3 rocminfo                 0.03     0.00
	  1 lspci                    0.00     0.02
	  1 ps                       0.00     0.01
	 88 sh                       0.00     0.00
	 13 gcc                      0.00     0.00
	 12 gsettings                0.00     0.00
	  8 stat                     0.00     0.00
	  8 systemd-detect-          0.00     0.00
	  6 llvm-link                0.00     0.00
	  5 phoronix-test-s          0.00     0.00
	  3 gmain                    0.00     0.00
	  2 cc                       0.00     0.00
	  2 lscpu                    0.00     0.00
	  2 uname                    0.00     0.00
	  2 which                    0.00     0.00
	  2 xset                     0.00     0.00
	  1 date                     0.00     0.00
	  1 dconf worker             0.00     0.00
	  1 dirname                  0.00     0.00
	  1 dmesg                    0.00     0.00
	  1 dmidecode                0.00     0.00
	  1 grep                     0.00     0.00
	  1 ifconfig                 0.00     0.00
	  1 ip                       0.00     0.00
	  1 lsmod                    0.00     0.00
	  1 mktemp                   0.00     0.00
	  1 qdbus                    0.00     0.00
	  1 readlink                 0.00     0.00
	  1 realpath                 0.00     0.00
	  1 sed                      0.00     0.00
	  1 sort                     0.00     0.00
	  1 stty                     0.00     0.00
	  1 systemctl                0.00     0.00
	  1 template.sh              0.00     0.00
	  1 wc                       0.00     0.00
	  1 xrandr                   0.00     0.00
0 processes running
47 maximum processes
Computation blocks are regular
      2637319) dav1d            cpu=0 start=5.52  finish=18.44
        2637320) dav1d            cpu=2 start=5.52  finish=18.44
          2637321) dav1d-worker     cpu=4 start=5.53  finish=18.44
          2637322) dav1d-worker     cpu=10 start=5.53  finish=18.44
          2637323) dav1d-worker     cpu=2 start=5.53  finish=18.44
          2637324) dav1d-worker     cpu=5 start=5.53  finish=18.44
          2637325) dav1d-worker     cpu=8 start=5.53  finish=18.43
          2637326) dav1d-worker     cpu=12 start=5.53  finish=18.43
          2637327) dav1d-worker     cpu=11 start=5.53  finish=18.43
          2637328) dav1d-worker     cpu=9 start=5.53  finish=18.43
          2637329) dav1d-worker     cpu=6 start=5.53  finish=18.43
          2637330) dav1d-worker     cpu=3 start=5.53  finish=18.43
          2637331) dav1d-worker     cpu=1 start=5.53  finish=18.43
          2637332) dav1d-worker     cpu=15 start=5.53  finish=18.43
          2637333) dav1d-worker     cpu=0 start=5.54  finish=18.43
          2637334) dav1d-worker     cpu=14 start=5.54  finish=18.43
          2637335) dav1d-worker     cpu=15 start=5.54  finish=18.43
          2637336) dav1d-worker     cpu=13 start=5.54  finish=18.43