
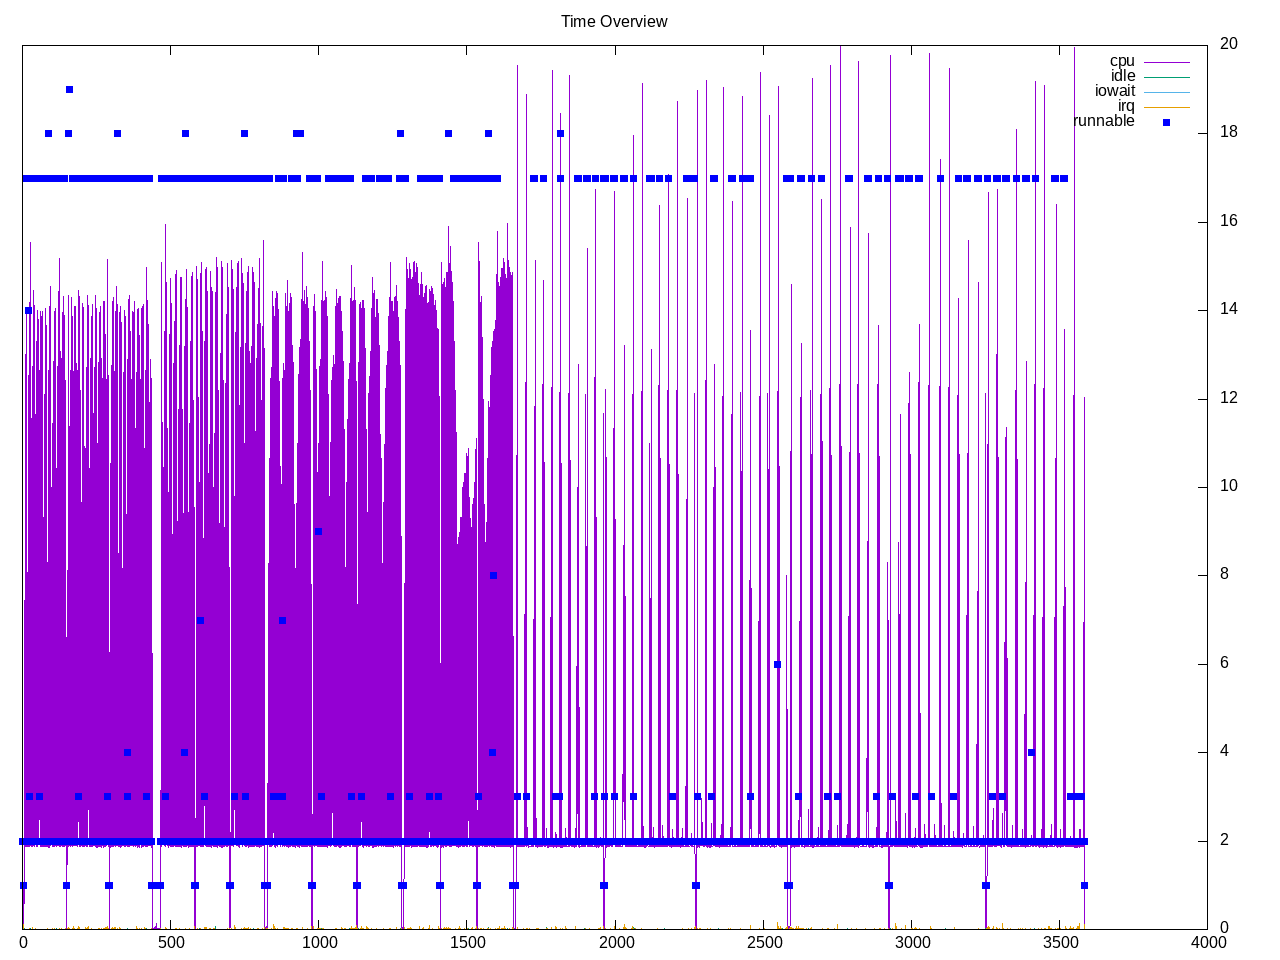
Multithreaded library for image encoding. There are six workloads for PNG and JPG files at quality levels of 80, 90 and 100. It looks like in the chart below that the second half is the quality level 100 runs and the first half is the 80/90 runs.
Topdown profile has an extended duration, perhaps because of extra time to settle down. Again the first parts look like quality level of 80 or 90 and the last part has a different profile.
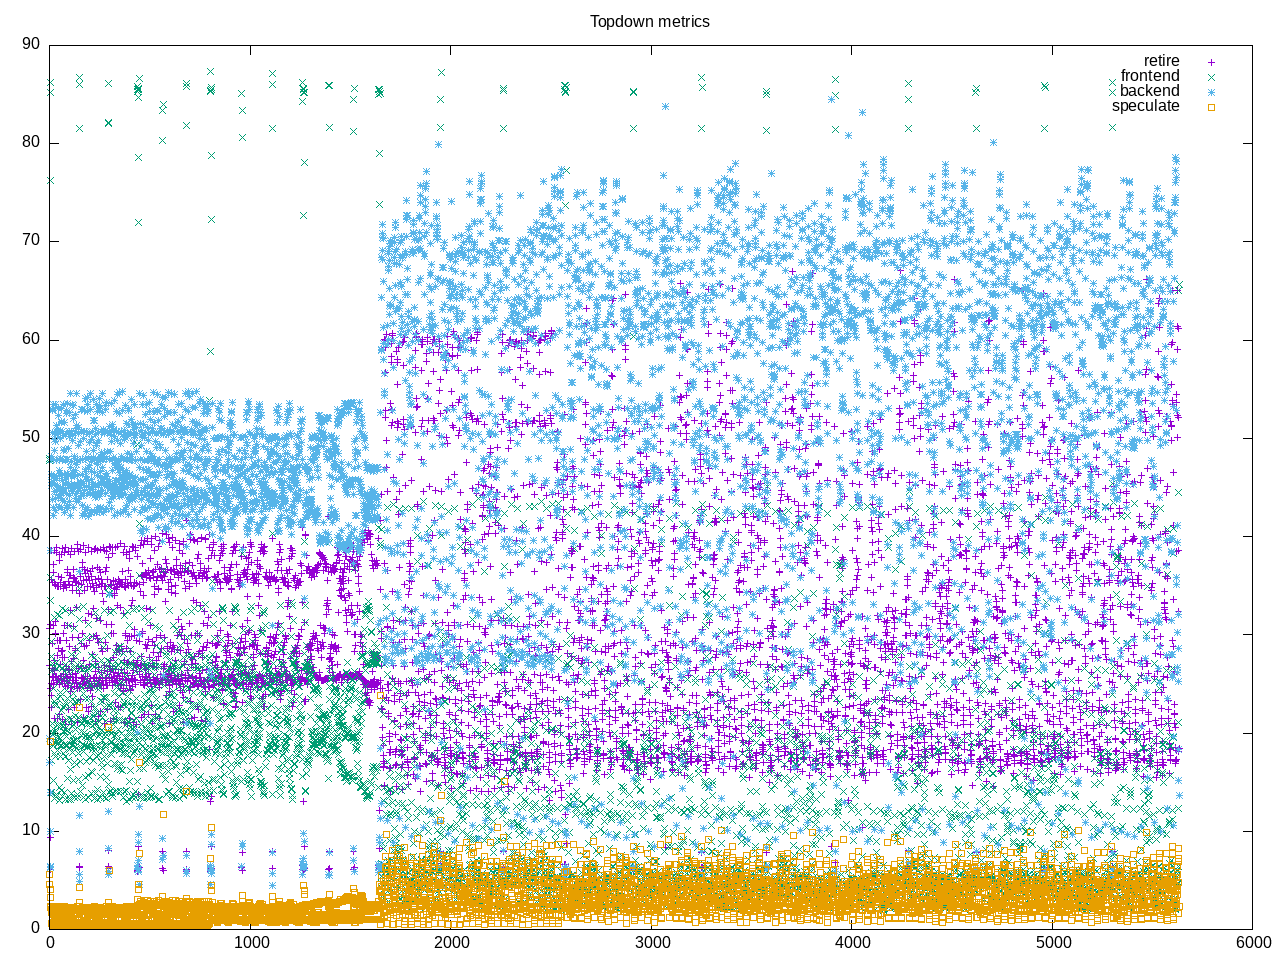
AMD metrics show we spend approximately two cores. This has some floating point and some L2 misses but not as much as other codes.
elapsed              5675.342
on_cpu               0.122          # 1.96 / 16 cores
utime                9924.448
stime                1177.538
nvcsw                261835         # 73.66%
nivcsw               93642          # 26.34%
inblock              0              # 0.00/sec
onblock              329168         # 58.00/sec
cpu-clock            11102930950490 # 11102.931 seconds
task-clock           11103320353169 # 11103.320 seconds
page faults          665296711      # 59918.717/sec
context switches     383635         # 34.551/sec
cpu migrations       41777          # 3.763/sec
major page faults    3              # 0.000/sec
minor page faults    665296708      # 59918.717/sec
alignment faults     0              # 0.000/sec
emulation faults     0              # 0.000/sec
branches             10784996197656 # 127.911 branches per 1000 inst
branch misses        177067769575   # 1.64% branch miss
conditional          9151340256953  # 108.536 conditional branches per 1000 inst
indirect             122058699223   # 1.448 indirect branches per 1000 inst
cpu-cycles           37254707984946 # 0.60 GHz
instructions         64568477307349 # 1.73 IPC
slots                74516063637558 #
retiring             21085576318904 # 28.3% (33.8%)
-- ucode             10854167509    #     0.0%
-- fastpath          21074722151395 #    28.3%
frontend             11291436271569 # 15.2% (18.1%)
-- latency           7305850960068  #     9.8%
-- bandwidth         3985585311501  #     5.3%
backend              28357036767501 # 38.1% (45.5%)
-- cpu               8580672843794  #    11.5%
-- memory            19776363923707 #    26.5%
speculation          1582289637387  #  2.1% ( 2.5%)
-- branch mispredict 1491776078800  #     2.0%
-- pipeline restart  90513558587    #     0.1%
smt-contention       12199680822816 # 16.4% ( 0.0%)
cpu-cycles           47521318199361 # 0.52 GHz
instructions         84159334995043 # 1.77 IPC
instructions         28045156973055 # 22.907 l2 access per 1000 inst
l2 hit from l1       446431052504   # 17.42% l2 miss
l2 miss from l1      40163624729    #
l2 hit from l2 pf    124272894941   #
l3 hit from l2 pf    17708445666    #
l3 miss from l2 pf   54009010862    #
instructions         28026770371181 # 47.993 float per 1000 inst
float 512            79             # 0.000 AVX-512 per 1000 inst
float 256            17101222963    # 0.610 AVX-256 per 1000 inst
float 128            1327999054364  # 47.383 AVX-128 per 1000 inst
float MMX            0              # 0.000 MMX per 1000 inst
float scalar         0              # 0.000 scalar per 1000 inst
Intel metrics
elapsed              3879.335
on_cpu               0.150          # 2.40 / 16 cores
utime                8628.362
stime                693.654
nvcsw                228233         # 73.43%
nivcsw               82573          # 26.57%
inblock              16             # 0.00/sec
onblock              180592         # 46.55/sec
cpu-clock            9320946410414  # 9320.946 seconds
task-clock           9321173373333  # 9321.173 seconds
page faults          547123213      # 58696.818/sec
context switches     330002         # 35.403/sec
cpu migrations       55623          # 5.967/sec
major page faults    3              # 0.000/sec
minor page faults    547123210      # 58696.817/sec
alignment faults     0              # 0.000/sec
emulation faults     0              # 0.000/sec
branches             8263097839432  # 124.372 branches per 1000 inst
branch misses        53469754306    # 0.65% branch miss
conditional          8263097861864  # 124.372 conditional branches per 1000 inst
indirect             1472508835553  # 22.164 indirect branches per 1000 inst
slots                109777534393358 #
retiring             49185428195933 # 44.8% (44.8%)
-- ucode             3954220797973  #     3.6%
-- fastpath          45231207397960 #    41.2%
frontend             10520885318395 #  9.6% ( 9.6%)
-- latency           4636226245813  #     4.2%
-- bandwidth         5884659072582  #     5.4%
backend              45213599965195 # 41.2% (41.2%)
-- cpu               21043679830200 #    19.2%
-- memory            24169920134995 #    22.0%
speculation          6286501719911  #  5.7% ( 5.7%)
-- branch mispredict 5571414597598  #     5.1%
-- pipeline restart  715087122313   #     0.7%
smt-contention       0              #  0.0% ( 0.0%)
cpu-cycles           34959735470966 # 0.57 GHz
instructions         74247673496426 # 2.12 IPC
l2 access            792486728041   # 15.946 l2 access per 1000 inst
l2 miss              388343780546   # 49.00% l2 miss
Process overview has time spent in cjxl
564 processes
	289 cjxl                 113792.21 16239.88
	 34 clinfo                  10.57     3.04
	 19 vulkaninfo               0.38     0.95
	  3 glxinfo:gdrv0            0.08     0.03
	  3 glxinfo:gl0              0.08     0.03
	  6 clang                    0.07     0.05
	  2 vulkani:disk$0           0.04     0.10
	  1 glxinfo                  0.04     0.01
	  1 glxinfo:cs0              0.04     0.01
	  1 glxinfo:disk$0           0.04     0.01
	  1 glxinfo:sh0              0.04     0.01
	  1 glxinfo:shlo0            0.04     0.01
	  1 llvmpipe-0               0.02     0.05
	  1 llvmpipe-1               0.02     0.05
	  1 llvmpipe-10              0.02     0.05
	  1 llvmpipe-11              0.02     0.05
	  1 llvmpipe-12              0.02     0.05
	  1 llvmpipe-13              0.02     0.05
	  1 llvmpipe-14              0.02     0.05
	  1 llvmpipe-15              0.02     0.05
	  1 llvmpipe-2               0.02     0.05
	  1 llvmpipe-3               0.02     0.05
	  1 llvmpipe-4               0.02     0.05
	  1 llvmpipe-5               0.02     0.05
	  1 llvmpipe-6               0.02     0.05
	  1 llvmpipe-7               0.02     0.05
	  1 llvmpipe-8               0.02     0.05
	  1 llvmpipe-9               0.02     0.05
	  1 ps                       0.00     0.01
	 68 sh                       0.00     0.00
	 17 jpegxl                   0.00     0.00
	 13 gcc                      0.00     0.00
	  9 gsettings                0.00     0.00
	  8 systemd-detect-          0.00     0.00
	  7 stat                     0.00     0.00
	  6 llvm-link                0.00     0.00
	  4 gmain                    0.00     0.00
	  4 phoronix-test-s          0.00     0.00
	  2 dconf worker             0.00     0.00
	  2 which                    0.00     0.00
	  1 cc                       0.00     0.00
	  1 date                     0.00     0.00
	  1 dirname                  0.00     0.00
	  1 grep                     0.00     0.00
	  1 ifconfig                 0.00     0.00
	  1 ip                       0.00     0.00
	  1 lscpu                    0.00     0.00
	  1 mktemp                   0.00     0.00
	  1 qdbus                    0.00     0.00
	  1 readlink                 0.00     0.00
	  1 realpath                 0.00     0.00
	  1 sed                      0.00     0.00
	  1 sort                     0.00     0.00
	  1 stty                     0.00     0.00
	  1 systemctl                0.00     0.00
	  1 template.sh              0.00     0.00
	  1 wc                       0.00     0.00
	  1 xrandr                   0.00     0.00
	  1 xset                     0.00     0.00
27 processes running
47 maximum processes
Computation blocks
      2644162) jpegxl           cpu=6 start=5.83  finish=149.67
        2644163) cjxl             cpu=8 start=5.83  finish=149.65
          2644290) cjxl             cpu=5 start=6.37  finish=149.63
          2644291) cjxl             cpu=1 start=6.37  finish=149.64
          2644292) cjxl             cpu=10 start=6.37  finish=149.64
          2644293) cjxl             cpu=8 start=6.37  finish=149.63
          2644294) cjxl             cpu=14 start=6.37  finish=149.63
          2644295) cjxl             cpu=2 start=6.37  finish=149.63
          2644296) cjxl             cpu=6 start=6.37  finish=149.63
          2644297) cjxl             cpu=13 start=6.37  finish=149.63
          2644298) cjxl             cpu=15 start=6.37  finish=149.64
          2644299) cjxl             cpu=4 start=6.37  finish=149.64
          2644300) cjxl             cpu=3 start=6.37  finish=149.64
          2644301) cjxl             cpu=11 start=6.37  finish=149.64
          2644302) cjxl             cpu=12 start=6.37  finish=149.64
          2644303) cjxl             cpu=5 start=6.37  finish=149.63
          2644304) cjxl             cpu=0 start=6.37  finish=149.63
          2644305) cjxl             cpu=7 start=6.37  finish=149.63