
A set of memory and CPU tests. This has first a memory test and then a CPU test. The memory test comes first and the CPU test takes most of the time.
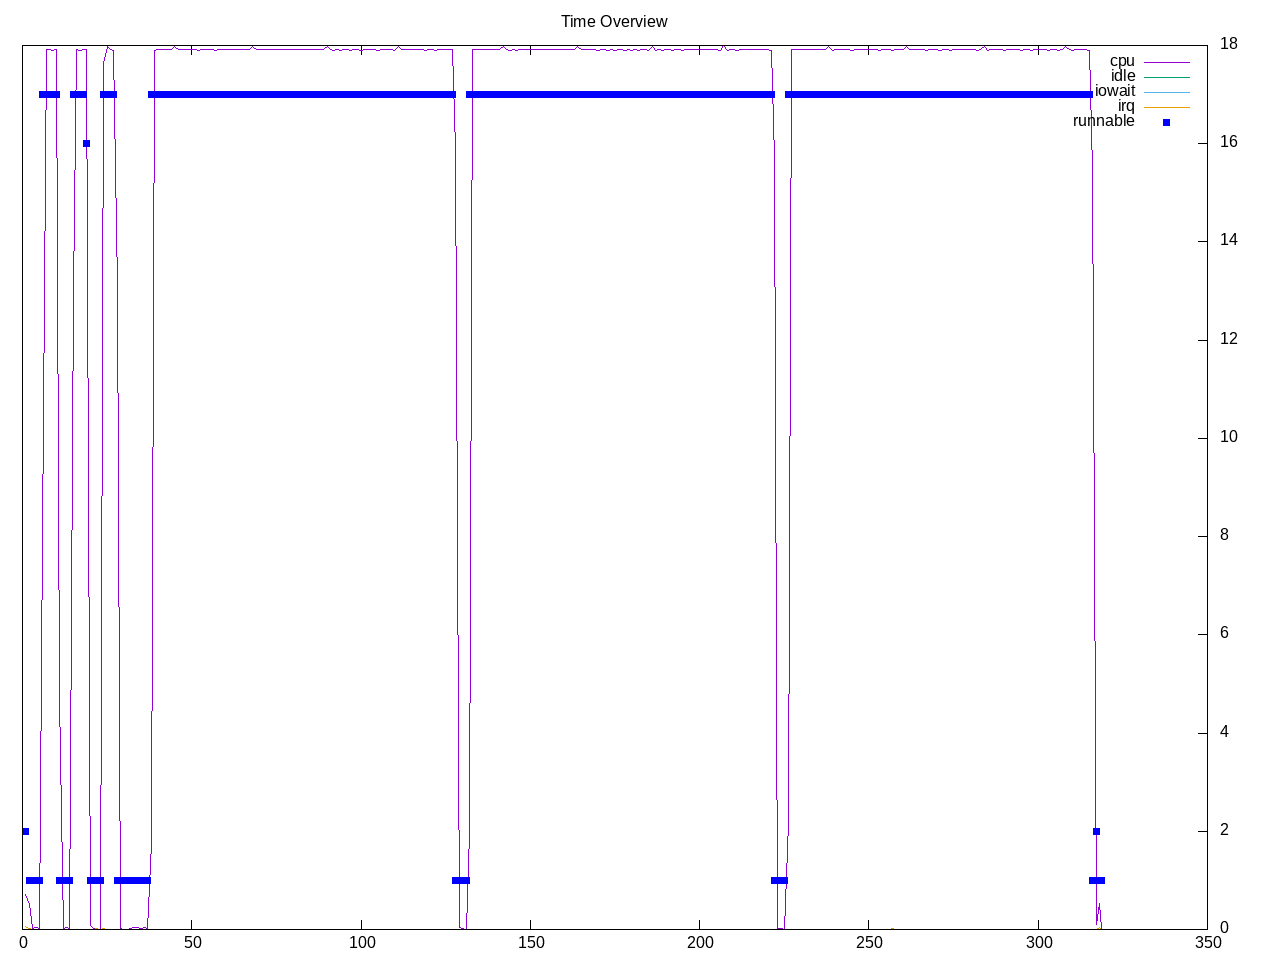
Topdown profile shows the CPU test is backend bound.
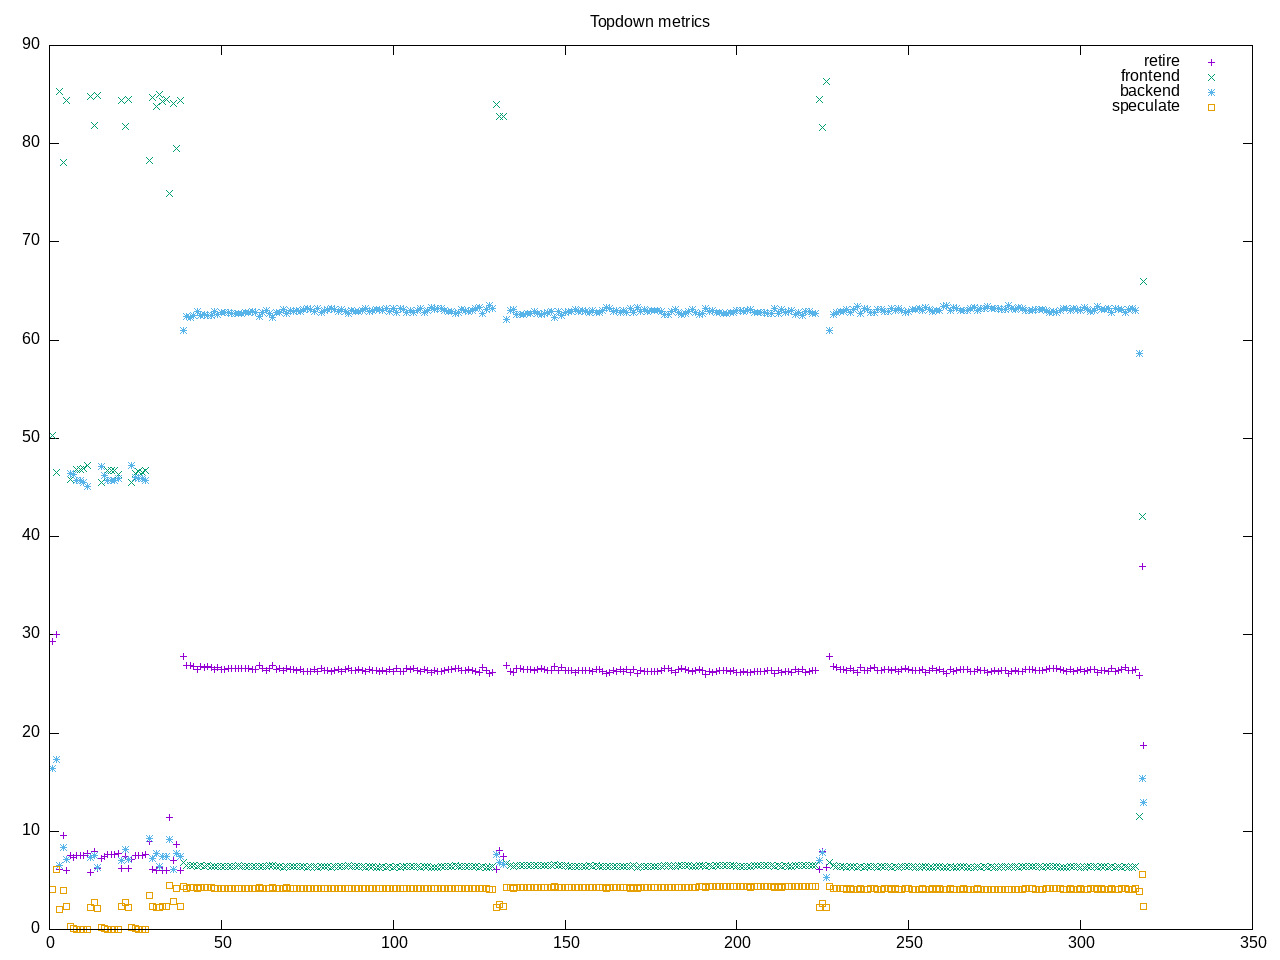
AMD metrics show this as floating point code with backend stalls being more CPU than memory. There is a low L2 rate as most accesses fit in L1.
elapsed              318.150
on_cpu               0.893          # 14.29 / 16 cores
utime                4546.117
stime                1.176
nvcsw                2211           # 4.70%
nivcsw               44878          # 95.30%
inblock              0              # 0.00/sec
onblock              12984          # 40.81/sec
cpu-clock            4547529047867  # 4547.529 seconds
task-clock           4547548645723  # 4547.549 seconds
page faults          150869         # 33.176/sec
context switches     48496          # 10.664/sec
cpu migrations       330            # 0.073/sec
major page faults    2              # 0.000/sec
minor page faults    150867         # 33.175/sec
alignment faults     0              # 0.000/sec
emulation faults     0              # 0.000/sec
branches             4509035218056  # 275.955 branches per 1000 inst
branch misses        41052746888    # 0.91% branch miss
conditional          4434057385448  # 271.366 conditional branches per 1000 inst
indirect             3650964459     # 0.223 indirect branches per 1000 inst
cpu-cycles           20286644922558 # 3.98 GHz
instructions         16333686165655 # 0.81 IPC
slots                40583276052510 #
retiring             5952640163865  # 14.7% (25.0%)
-- ucode             574233522      #     0.0%
-- fastpath          5952065930343  #    14.7%
frontend             2295572979168  #  5.7% ( 9.6%)
-- latency           1541791413666  #     3.8%
-- bandwidth         753781565502   #     1.9%
backend              14623772638291 # 36.0% (61.4%)
-- cpu               13029400704166 #    32.1%
-- memory            1594371934125  #     3.9%
speculation          933970984068   #  2.3% ( 3.9%)
-- branch mispredict 933670914512   #     2.3%
-- pipeline restart  300069556      #     0.0%
smt-contention       16777253299166 # 41.3% ( 0.0%)
cpu-cycles           20277214461736 # 3.98 GHz
instructions         16319112563208 # 0.80 IPC
instructions         5442464918288  # 0.878 l2 access per 1000 inst
l2 hit from l1       3479910387     # 49.31% l2 miss
l2 miss from l1      2191772908     #
l2 hit from l2 pf    1134041742     #
l3 hit from l2 pf    159382060      #
l3 miss from l2 pf   5055763        #
instructions         5432886320488  # 271.128 float per 1000 inst
float 512            49             # 0.000 AVX-512 per 1000 inst
float 256            596            # 0.000 AVX-256 per 1000 inst
float 128            1473007842843  # 271.128 AVX-128 per 1000 inst
float MMX            0              # 0.000 MMX per 1000 inst
float scalar         0              # 0.000 scalar per 1000 inst
instructions         2671438        #
opcache              1001870        # 375.030 opcache per 1000 inst
opcache miss         539210         # 53.8% opcache miss rate
l1 dTLB miss         4934           # 1.847 L1 dTLB per 1000 inst
l2 dTLB miss         1021           # 0.382 L2 dTLB per 1000 inst
instructions         2700534        #
icache               1322141        # 489.585 icache per 1000 inst
icache miss          112458         #  8.5% icache miss rate
l1 iTLB miss         12             # 0.004 L1 iTLB per 1000 inst
l2 iTLB miss         0              # 0.000 L2 iTLB per 1000 inst
tlb flush            18             # 0.007 TLB flush per 1000 inst
Intel metrics
elapsed              323.157
on_cpu               0.893          # 14.28 / 16 cores
utime                4614.028
stime                0.661
nvcsw                2098           # 5.09%
nivcsw               39085          # 94.91%
inblock              2392           # 7.40/sec
onblock              1744           # 5.40/sec
cpu-clock            4614872820140  # 4614.873 seconds
task-clock           4614882380814  # 4614.882 seconds
page faults          140145         # 30.368/sec
context switches     42620          # 9.235/sec
cpu migrations       389            # 0.084/sec
major page faults    10             # 0.002/sec
minor page faults    140135         # 30.366/sec
alignment faults     0              # 0.000/sec
emulation faults     0              # 0.000/sec
branches             3592126070177  # 274.868 branches per 1000 inst
branch misses        31898610274    # 0.89% branch miss
conditional          3592126085473  # 274.868 conditional branches per 1000 inst
indirect             813197327537   # 62.225 indirect branches per 1000 inst
slots                25742466242486 #
retiring             6494217835209  # 25.2% (25.2%)
-- ucode             1982226024440  #     7.7%
-- fastpath          4511991810769  #    17.5%
frontend             7403793894969  # 28.8% (28.8%)
-- latency           4756534183752  #    18.5%
-- bandwidth         2647259711217  #    10.3%
backend              10302130934074 # 40.0% (40.0%)
-- cpu               8840040321069  #    34.3%
-- memory            1462090613005  #     5.7%
speculation          1564631639172  #  6.1% ( 6.1%)
-- branch mispredict 1564486375695  #     6.1%
-- pipeline restart  145263477      #     0.0%
smt-contention       0              #  0.0% ( 0.0%)
cpu-cycles           9023096818342  # 1.75 GHz
instructions         5280492351738  # 0.59 IPC low
l2 access            3639456597     # 0.731 l2 access per 1000 inst
l2 miss              3379895174     # 92.87% l2 miss
Process overview
458 processes
	108 sysbench             77270.71     2.89
	 68 clinfo                  18.20     4.42
	 38 vulkaninfo               1.11     1.15
	  4 vulkani:disk$0           0.12     0.13
	  6 glxinfo:gdrv0            0.08     0.05
	  6 glxinfo:gl0              0.08     0.05
	  6 php                      0.07     0.07
	  2 llvmpipe-0               0.06     0.07
	  2 llvmpipe-1               0.06     0.07
	  2 llvmpipe-10              0.06     0.07
	  2 llvmpipe-11              0.06     0.07
	  2 llvmpipe-12              0.06     0.07
	  2 llvmpipe-13              0.06     0.07
	  2 llvmpipe-14              0.06     0.07
	  2 llvmpipe-15              0.06     0.07
	  2 llvmpipe-2               0.06     0.07
	  2 llvmpipe-3               0.06     0.07
	  2 llvmpipe-4               0.06     0.07
	  2 llvmpipe-5               0.06     0.07
	  2 llvmpipe-6               0.06     0.07
	  2 llvmpipe-7               0.06     0.07
	  2 llvmpipe-8               0.06     0.07
	  2 llvmpipe-9               0.06     0.07
	  2 glxinfo                  0.06     0.04
	  6 clang                    0.05     0.07
	  2 glxinfo:cs0              0.05     0.03
	  2 glxinfo:disk$0           0.05     0.03
	  2 glxinfo:shlo0            0.05     0.03
	  2 glxinfo:sh0              0.04     0.03
	  1 lspci                    0.01     0.02
	  3 rocminfo                 0.00     0.03
	  1 ps                       0.00     0.01
	 84 sh                       0.00     0.00
	 13 gcc                      0.00     0.00
	  9 gsettings                0.00     0.00
	  8 stat                     0.00     0.00
	  8 systemd-detect-          0.00     0.00
	  6 llvm-link                0.00     0.00
	  5 gmain                    0.00     0.00
	  5 phoronix-test-s          0.00     0.00
	  2 cc                       0.00     0.00
	  2 dconf worker             0.00     0.00
	  2 lscpu                    0.00     0.00
	  2 uname                    0.00     0.00
	  2 which                    0.00     0.00
	  2 xset                     0.00     0.00
	  1 date                     0.00     0.00
	  1 dirname                  0.00     0.00
	  1 dmesg                    0.00     0.00
	  1 dmidecode                0.00     0.00
	  1 grep                     0.00     0.00
	  1 ifconfig                 0.00     0.00
	  1 ip                       0.00     0.00
	  1 lsmod                    0.00     0.00
	  1 mktemp                   0.00     0.00
	  1 qdbus                    0.00     0.00
	  1 readlink                 0.00     0.00
	  1 realpath                 0.00     0.00
	  1 sed                      0.00     0.00
	  1 sort                     0.00     0.00
	  1 stty                     0.00     0.00
	  1 systemctl                0.00     0.00
	  1 template.sh              0.00     0.00
	  1 wc                       0.00     0.00
	  1 xrandr                   0.00     0.00
0 processes running
47 maximum processes
Example computation blocks.
      226573) sysbench         cpu=13 start=5.50  finish=10.22
        226574) sysbench         cpu=4 start=5.50  finish=10.22
          226575) sysbench         cpu=6 start=5.50  finish=10.22
          226576) sysbench         cpu=7 start=5.50  finish=10.22
          226577) sysbench         cpu=1 start=5.50  finish=10.22
          226578) sysbench         cpu=2 start=5.50  finish=10.21
          226579) sysbench         cpu=15 start=5.50  finish=10.22
          226580) sysbench         cpu=13 start=5.50  finish=10.22
          226581) sysbench         cpu=11 start=5.50  finish=10.22
          226582) sysbench         cpu=5 start=5.50  finish=10.22
          226583) sysbench         cpu=4 start=5.50  finish=10.22
          226584) sysbench         cpu=10 start=5.50  finish=10.21
          226585) sysbench         cpu=8 start=5.50  finish=10.21
          226586) sysbench         cpu=3 start=5.50  finish=10.22
          226587) sysbench         cpu=12 start=5.50  finish=10.22
          226588) sysbench         cpu=0 start=5.50  finish=10.21
          226589) sysbench         cpu=14 start=5.50  finish=10.22
          226590) sysbench         cpu=9 start=5.50  finish=10.22