
An ambient occlusion renderer written in C. There is one workload which runs quickly and is single-threaded.
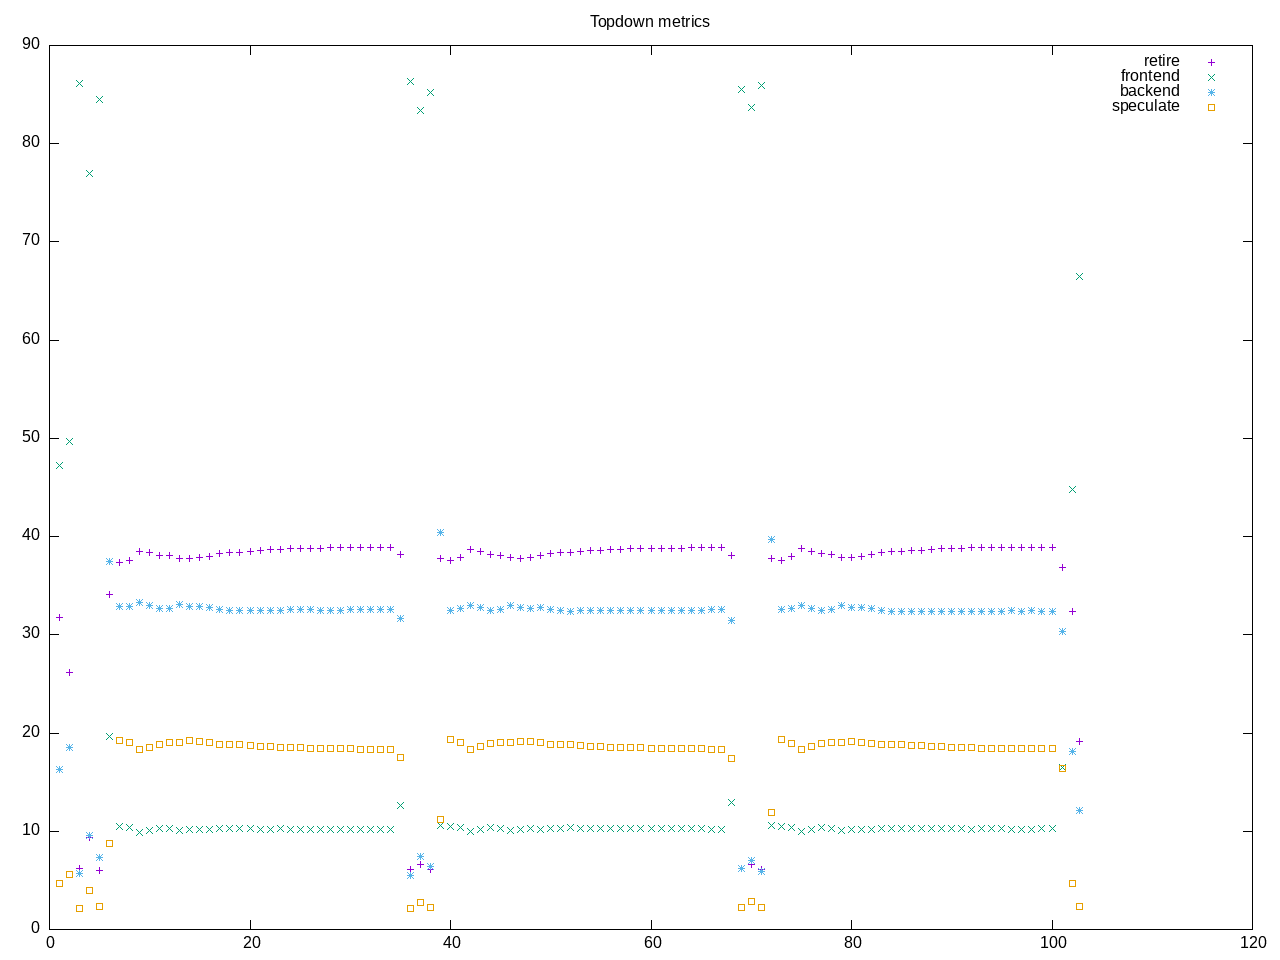
Topdown profile shows a fair retirement with backend stalls. Branch mispredictions are high while frontend stalls are low.
AMD metrics
elapsed              102.495
on_cpu               0.054          # 0.86 / 16 cores
utime                87.363
stime                1.020
nvcsw                1999           # 69.43%
nivcsw               880            # 30.57%
inblock              0              # 0.00/sec
onblock              86264          # 841.64/sec
cpu-clock            88410340018    # 88.410 seconds
task-clock           88413216623    # 88.413 seconds
page faults          304139         # 3439.972/sec
context switches     3221           # 36.431/sec
cpu migrations       283            # 3.201/sec
major page faults    2              # 0.023/sec
minor page faults    304137         # 3439.949/sec
alignment faults     0              # 0.000/sec
emulation faults     0              # 0.000/sec
branches             81795025595    # 92.951 branches per 1000 inst
branch misses        3180554743     # 3.89% branch miss
conditional          47929599290    # 54.467 conditional branches per 1000 inst
indirect             5305288022     # 6.029 indirect branches per 1000 inst
cpu-cycles           406522857441   # 0.25 GHz
instructions         877863716496   # 2.16 IPC
slots                815064673812   #
retiring             313009309772   # 38.4% (38.4%)
-- ucode             595913736      #     0.1%
-- fastpath          312413396036   #    38.3%
frontend             88237262487    # 10.8% (10.8%)
-- latency           48716465088    #     6.0%
-- bandwidth         39520797399    #     4.8%
backend              263992965803   # 32.4% (32.4%)
-- cpu               224705468131   #    27.6%
-- memory            39287497672    #     4.8%
speculation          149780891444   # 18.4% (18.4%) high
-- branch mispredict 148122841279   #    18.2%
-- pipeline restart  1658050165     #     0.2%
smt-contention       44009663       #  0.0% ( 0.0%)
cpu-cycles           406560579104   # 0.25 GHz
instructions         878913529305   # 2.16 IPC
instructions         293297866428   # 0.482 l2 access per 1000 inst
l2 hit from l1       121907588      # 18.04% l2 miss
l2 miss from l1      14912506       #
l2 hit from l2 pf    8978579        #
l3 hit from l2 pf    4321477        #
l3 miss from l2 pf   6292570        #
instructions         293187261114   # 286.414 float per 1000 inst
float 512            45             # 0.000 AVX-512 per 1000 inst
float 256            434            # 0.000 AVX-256 per 1000 inst
float 128            83972975802    # 286.414 AVX-128 per 1000 inst
float MMX            0              # 0.000 MMX per 1000 inst
float scalar         0              # 0.000 scalar per 1000 inst
instructions         2678177        #
opcache              992616         # 370.631 opcache per 1000 inst
opcache miss         535144         # 53.9% opcache miss rate
l1 dTLB miss         6691           # 2.498 L1 dTLB per 1000 inst
l2 dTLB miss         1192           # 0.445 L2 dTLB per 1000 inst
instructions         2716755        #
icache               1316655        # 484.643 icache per 1000 inst
icache miss          110449         #  8.4% icache miss rate
l1 iTLB miss         12             # 0.004 L1 iTLB per 1000 inst
l2 iTLB miss         0              # 0.000 L2 iTLB per 1000 inst
tlb flush            19             # 0.007 TLB flush per 1000 inst
Intel metrics show most of the memory time in L1 and hence also little backend memory stalls.
elapsed              99.367
on_cpu               0.053          # 0.85 / 16 cores
utime                83.595
stime                0.708
nvcsw                1838           # 77.85%
nivcsw               523            # 22.15%
inblock              376            # 3.78/sec
onblock              75024          # 755.02/sec
cpu-clock            84314176287    # 84.314 seconds
task-clock           84316871118    # 84.317 seconds
page faults          293264         # 3478.118/sec
context switches     2682           # 31.809/sec
cpu migrations       256            # 3.036/sec
major page faults    3              # 0.036/sec
minor page faults    293261         # 3478.082/sec
alignment faults     0              # 0.000/sec
emulation faults     0              # 0.000/sec
branches             81437652894    # 92.693 branches per 1000 inst
branch misses        3150488706     # 3.87% branch miss
conditional          81437664862    # 92.693 conditional branches per 1000 inst
indirect             5324683966     # 6.061 indirect branches per 1000 inst
slots                1909779189608  #
retiring             844514250146   # 44.2% (44.2%)
-- ucode             22927963393    #     1.2%
-- fastpath          821586286753   #    43.0%
frontend             97708395771    #  5.1% ( 5.1%)
-- latency           47599342664    #     2.5%
-- bandwidth         50109053107    #     2.6%
backend              424540183774   # 22.2% (22.2%)
-- cpu               384651028950   #    20.1%
-- memory            39889154824    #     2.1%
speculation          543044850727   # 28.4% (28.4%) high
-- branch mispredict 540435652666   #    28.3%
-- pipeline restart  2609198061     #     0.1%
smt-contention       0              #  0.0% ( 0.0%)
cpu-cycles           318526215737   # 0.20 GHz
instructions         878918735087   # 2.76 IPC
l2 access            306437238      # 0.349 l2 access per 1000 inst
l2 miss              95837357       # 31.27% l2 miss
cpu-cycles           318387579528   #  7.0% memory latency
load stalls          22063711216    #  6.7% l1 bound
l1 miss              799531261      #  0.1% l2 bound
l2 miss              402304447      #  0.0% l3 bound
l3 miss              286747182      #  0.1% dram bound
store_stalls         159923946      #  0.1% store bound
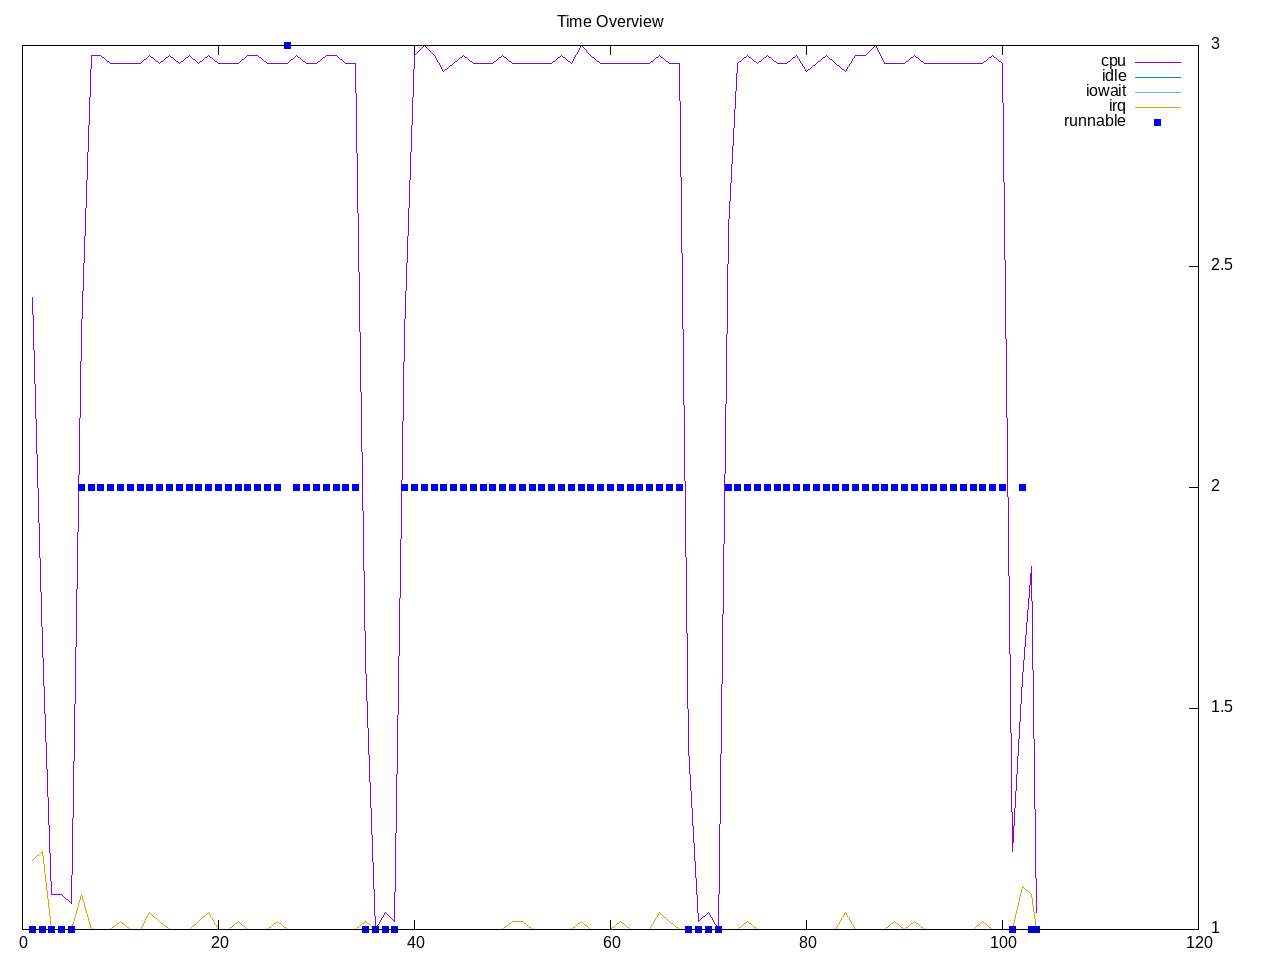
Process overview shows three invocations of “ao”
354 processes
	  3 ao                      86.32     0.24
	 68 clinfo                  15.86     6.66
	 38 vulkaninfo               0.96     1.15
	  6 glxinfo:gdrv0            0.12     0.06
	  6 glxinfo:gl0              0.12     0.06
	  4 vulkani:disk$0           0.10     0.12
	  6 php                      0.06     0.08
	  2 glxinfo                  0.06     0.03
	  2 glxinfo:cs0              0.06     0.03
	  2 glxinfo:disk$0           0.06     0.03
	  2 glxinfo:sh0              0.06     0.03
	  2 glxinfo:shlo0            0.06     0.03
	  6 clang                    0.05     0.07
	  2 llvmpipe-0               0.05     0.06
	  2 llvmpipe-1               0.05     0.06
	  2 llvmpipe-10              0.05     0.06
	  2 llvmpipe-11              0.05     0.06
	  2 llvmpipe-12              0.05     0.06
	  2 llvmpipe-13              0.05     0.06
	  2 llvmpipe-14              0.05     0.06
	  2 llvmpipe-15              0.05     0.06
	  2 llvmpipe-2               0.05     0.06
	  2 llvmpipe-3               0.05     0.06
	  2 llvmpipe-4               0.05     0.06
	  2 llvmpipe-5               0.05     0.06
	  2 llvmpipe-6               0.05     0.06
	  2 llvmpipe-7               0.05     0.06
	  2 llvmpipe-8               0.05     0.06
	  2 llvmpipe-9               0.05     0.06
	  3 rocminfo                 0.03     0.00
	  1 lspci                    0.00     0.02
	  1 ps                       0.00     0.01
	 82 sh                       0.00     0.00
	 13 gcc                      0.00     0.00
	  8 gsettings                0.00     0.00
	  8 stat                     0.00     0.00
	  8 systemd-detect-          0.00     0.00
	  6 llvm-link                0.00     0.00
	  5 gmain                    0.00     0.00
	  5 phoronix-test-s          0.00     0.00
	  3 aobench                  0.00     0.00
	  3 dconf worker             0.00     0.00
	  2 cc                       0.00     0.00
	  2 lscpu                    0.00     0.00
	  2 uname                    0.00     0.00
	  2 which                    0.00     0.00
	  2 xset                     0.00     0.00
	  1 date                     0.00     0.00
	  1 dirname                  0.00     0.00
	  1 dmesg                    0.00     0.00
	  1 dmidecode                0.00     0.00
	  1 grep                     0.00     0.00
	  1 ifconfig                 0.00     0.00
	  1 ip                       0.00     0.00
	  1 lsmod                    0.00     0.00
	  1 mktemp                   0.00     0.00
	  1 qdbus                    0.00     0.00
	  1 readlink                 0.00     0.00
	  1 realpath                 0.00     0.00
	  1 sed                      0.00     0.00
	  1 sort                     0.00     0.00
	  1 stty                     0.00     0.00
	  1 systemctl                0.00     0.00
	  1 template.sh              0.00     0.00
	  1 wc                       0.00     0.00
	  1 xrandr                   0.00     0.00
0 processes running
47 maximum processes
Computation blocks
      356574) aobench          cpu=6 start=5.50  finish=34.37
        356575) ao               cpu=8 start=5.51  finish=34.36
      356578) aobench          cpu=15 start=38.37 finish=67.28
        356579) ao               cpu=0 start=38.38 finish=67.27
      356580) aobench          cpu=14 start=71.28 finish=100.13
        356581) ao               cpu=7 start=71.28 finish=100.12