
asmfish is a chess benchmark written in assembly. Looks like a multi-threaded program.
Topdown profile shows a moderate branch misprediction with backend stalls slightly higher but otherwise retirement rate, frontend stalls are similar.
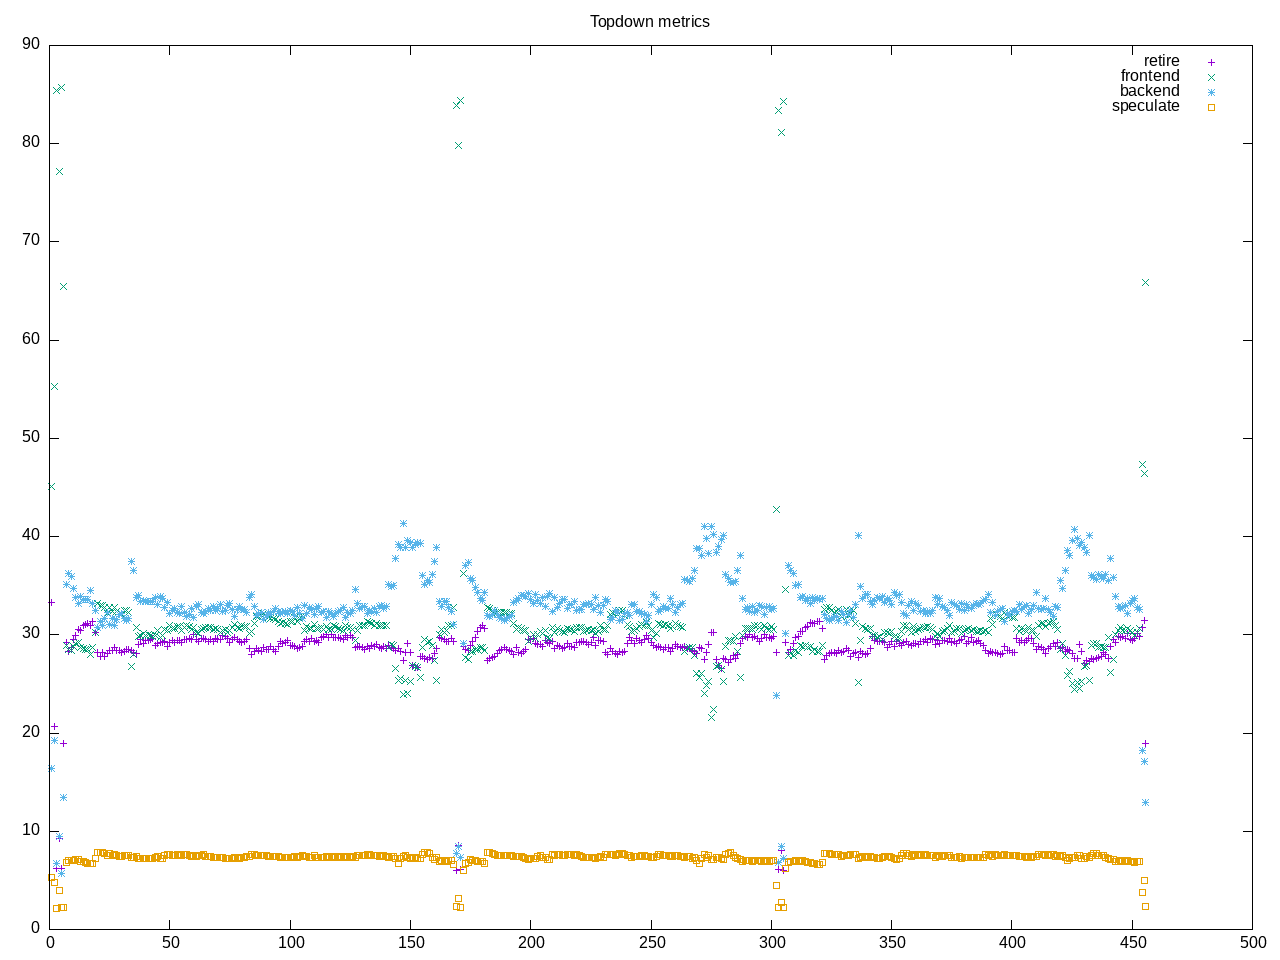
AMD metrics show little floating point and not large L2 access.
elapsed              1517.211
on_cpu               0.966          # 15.46 / 16 cores
utime                23445.332
stime                9.755
nvcsw                9771           # 3.61%
nivcsw               260577         # 96.39%
inblock              0              # 0.00/sec
onblock              13808          # 9.10/sec
cpu-clock            23457218382276 # 23457.218 seconds
task-clock           23457430457602 # 23457.430 seconds
page faults          2947383        # 125.648/sec
context switches     277731         # 11.840/sec
cpu migrations       500            # 0.021/sec
major page faults    2              # 0.000/sec
minor page faults    2947381        # 125.648/sec
alignment faults     0              # 0.000/sec
emulation faults     0              # 0.000/sec
branches             11158947860856 # 97.540 branches per 1000 inst
branch misses        797121864946   # 7.14% branch miss
conditional          9591696591582  # 83.841 conditional branches per 1000 inst
indirect             156117278624   # 1.365 indirect branches per 1000 inst
cpu-cycles           28452192694276 # 3.76 GHz
instructions         35324580453604 # 1.24 IPC
slots                56921922062802 #
retiring             11727272498088 # 20.6% (29.0%)
-- ucode             57437721       #     0.0%
-- fastpath          11727215060367 #    20.6%
frontend             12143947085186 # 21.3% (30.0%)
-- latency           8533709194308  #    15.0%
-- bandwidth         3610237890878  #     6.3%
backend              13587847031014 # 23.9% (33.6%)
-- cpu               2286483490267  #     4.0%
-- memory            11301363540747 #    19.9%
speculation          2968536513516  #  5.2% ( 7.3%)
-- branch mispredict 2960092527472  #     5.2%
-- pipeline restart  8443986044     #     0.0%
smt-contention       16494268066111 # 29.0% ( 0.0%)
cpu-cycles           27259117483983 # 3.75 GHz
instructions         33857638783348 # 1.24 IPC
instructions         11290650453951 # 22.456 l2 access per 1000 inst
l2 hit from l1       225708480194   # 13.35% l2 miss
l2 miss from l1      19383607205    #
l2 hit from l2 pf    13370004613    #
l3 hit from l2 pf    9348355650     #
l3 miss from l2 pf   5119969690     #
instructions         11285364506585 # 11.949 float per 1000 inst
float 512            36             # 0.000 AVX-512 per 1000 inst
float 256            656            # 0.000 AVX-256 per 1000 inst
float 128            134852943514   # 11.949 AVX-128 per 1000 inst
float MMX            0              # 0.000 MMX per 1000 inst
float scalar         0              # 0.000 scalar per 1000 inst
instructions         2663101        #
opcache              991121         # 372.168 opcache per 1000 inst
opcache miss         535343         # 54.0% opcache miss rate
l1 dTLB miss         5371           # 2.017 L1 dTLB per 1000 inst
l2 dTLB miss         1131           # 0.425 L2 dTLB per 1000 inst
instructions         2695530        #
icache               1308533        # 485.446 icache per 1000 inst
icache miss          109091         #  8.3% icache miss rate
l1 iTLB miss         11             # 0.004 L1 iTLB per 1000 inst
l2 iTLB miss         0              # 0.000 L2 iTLB per 1000 inst
tlb flush            19             # 0.007 TLB flush per 1000 inst
Intel metrics have high branch misprediction stalls
elapsed              930.067
on_cpu               0.973          # 15.57 / 16 cores
utime                14480.756
stime                2.824
nvcsw                5694           # 4.96%
nivcsw               109065         # 95.04%
inblock              600            # 0.65/sec
onblock              1632           # 1.75/sec
cpu-clock            14484109292573 # 14484.109 seconds
task-clock           14484179405678 # 14484.179 seconds
page faults          1535742        # 106.029/sec
context switches     119234         # 8.232/sec
cpu migrations       363            # 0.025/sec
major page faults    20             # 0.001/sec
minor page faults    1535722        # 106.028/sec
alignment faults     0              # 0.000/sec
emulation faults     0              # 0.000/sec
branches             5431797354548  # 97.615 branches per 1000 inst
branch misses        419390430460   # 7.72% branch miss
conditional          5431797369236  # 97.615 conditional branches per 1000 inst
indirect             1387301717460  # 24.931 indirect branches per 1000 inst
slots                45263131107686 #
retiring             18196158114810 # 40.2% (40.2%)
-- ucode             1298337179576  #     2.9%
-- fastpath          16897820935234 #    37.3%
frontend             13104919029834 # 29.0% (29.0%)
-- latency           5908075894258  #    13.1%
-- bandwidth         7196843135576  #    15.9%
backend              5277515617044  # 11.7% (11.7%) low
-- cpu               2851022639365  #     6.3%
-- memory            2426492977679  #     5.4%
speculation          8913974754817  # 19.7% (19.7%) high
-- branch mispredict 8854096911089  #    19.6%
-- pipeline restart  59877843728    #     0.1%
smt-contention       0              #  0.0% ( 0.0%)
cpu-cycles           15327163008989 # 1.63 GHz
instructions         18311970348982 # 1.19 IPC
l2 access            304702922646   # 18.131 l2 access per 1000 inst
l2 miss              87356480707    # 28.67% l2 miss
cpu-cycles           14238711708962 # 22.3% memory latency
load stalls          3165555352508  #  4.5% l1 bound
l1 miss              2528396934647  #  9.1% l2 bound
l2 miss              1232314608415  #  2.3% l3 bound
l3 miss              905266872587   #  6.4% dram bound
store_stalls         13992828017    #  0.1% store bound
Process overview shows asmFish_2018-0 as the primary process
402 processes
	 51 asmFishL_2018-0      119149.43    34.29
	 68 clinfo                  18.19     4.32
	 38 vulkaninfo               1.13     1.14
	  4 vulkani:disk$0           0.12     0.12
	  6 glxinfo:gdrv0            0.09     0.08
	  6 glxinfo:gl0              0.09     0.08
	  6 php                      0.08     0.10
	  2 llvmpipe-0               0.06     0.06
	  2 llvmpipe-1               0.06     0.06
	  2 llvmpipe-10              0.06     0.06
	  2 llvmpipe-11              0.06     0.06
	  2 llvmpipe-12              0.06     0.06
	  2 llvmpipe-13              0.06     0.06
	  2 llvmpipe-14              0.06     0.06
	  2 llvmpipe-15              0.06     0.06
	  2 llvmpipe-2               0.06     0.06
	  2 llvmpipe-3               0.06     0.06
	  2 llvmpipe-4               0.06     0.06
	  2 llvmpipe-5               0.06     0.06
	  2 llvmpipe-6               0.06     0.06
	  2 llvmpipe-7               0.06     0.06
	  2 llvmpipe-8               0.06     0.06
	  2 llvmpipe-9               0.06     0.06
	  6 clang                    0.06     0.05
	  2 glxinfo                  0.05     0.04
	  2 glxinfo:cs0              0.05     0.04
	  2 glxinfo:disk$0           0.05     0.04
	  2 glxinfo:sh0              0.05     0.04
	  2 glxinfo:shlo0            0.05     0.04
	  3 rocminfo                 0.03     0.00
	  1 lspci                    0.00     0.02
	  1 ps                       0.00     0.01
	 81 sh                       0.00     0.00
	 12 gcc                      0.00     0.00
	 11 gsettings                0.00     0.00
	  8 stat                     0.00     0.00
	  8 systemd-detect-          0.00     0.00
	  6 asmfish                  0.00     0.00
	  6 llvm-link                0.00     0.00
	  5 phoronix-test-s          0.00     0.00
	  4 gmain                    0.00     0.00
	  2 lscpu                    0.00     0.00
	  2 uname                    0.00     0.00
	  2 which                    0.00     0.00
	  2 xset                     0.00     0.00
	  1 cc                       0.00     0.00
	  1 date                     0.00     0.00
	  1 dconf worker             0.00     0.00
	  1 dirname                  0.00     0.00
	  1 dmesg                    0.00     0.00
	  1 dmidecode                0.00     0.00
	  1 grep                     0.00     0.00
	  1 ifconfig                 0.00     0.00
	  1 ip                       0.00     0.00
	  1 lsmod                    0.00     0.00
	  1 mktemp                   0.00     0.00
	  1 qdbus                    0.00     0.00
	  1 readlink                 0.00     0.00
	  1 realpath                 0.00     0.00
	  1 sed                      0.00     0.00
	  1 sort                     0.00     0.00
	  1 stty                     0.00     0.00
	  1 systemctl                0.00     0.00
	  1 template.sh              0.00     0.00
	  1 wc                       0.00     0.00
	  1 xrandr                   0.00     0.00
0 processes running
47 maximum processes
Computation blocks look as follows
      574325) asmfish          cpu=11 start=5.60  finish=153.30
        574326) asmfish          cpu=4 start=5.61  finish=5.61
        574327) asmFishL_2018-0  cpu=7 start=5.61  finish=153.30
          574328) asmFishL_2018-0  cpu=10 start=5.65  finish=153.20
          574329) asmFishL_2018-0  cpu=4 start=5.66  finish=153.20
          574330) asmFishL_2018-0  cpu=13 start=5.66  finish=153.20
          574331) asmFishL_2018-0  cpu=14 start=5.66  finish=153.20
          574332) asmFishL_2018-0  cpu=0 start=5.66  finish=153.20
          574333) asmFishL_2018-0  cpu=9 start=5.66  finish=153.20
          574334) asmFishL_2018-0  cpu=11 start=5.66  finish=153.20
          574335) asmFishL_2018-0  cpu=15 start=5.66  finish=153.20
          574336) asmFishL_2018-0  cpu=6 start=5.66  finish=153.20
          574337) asmFishL_2018-0  cpu=12 start=5.66  finish=153.20
          574338) asmFishL_2018-0  cpu=6 start=5.66  finish=153.20
          574339) asmFishL_2018-0  cpu=8 start=5.66  finish=153.20
          574340) asmFishL_2018-0  cpu=1 start=5.66  finish=153.20
          574341) asmFishL_2018-0  cpu=3 start=5.66  finish=153.20
          574342) asmFishL_2018-0  cpu=2 start=5.66  finish=153.20
          574343) asmFishL_2018-0  cpu=5 start=5.66  finish=153.20