
brl-cad is a cross-platform solid modeling system. There is one workload and it returns a single result.
Topdown profile shows a moderate retirement rate with backend stalls around 35% and frontend stalls a bit lower.
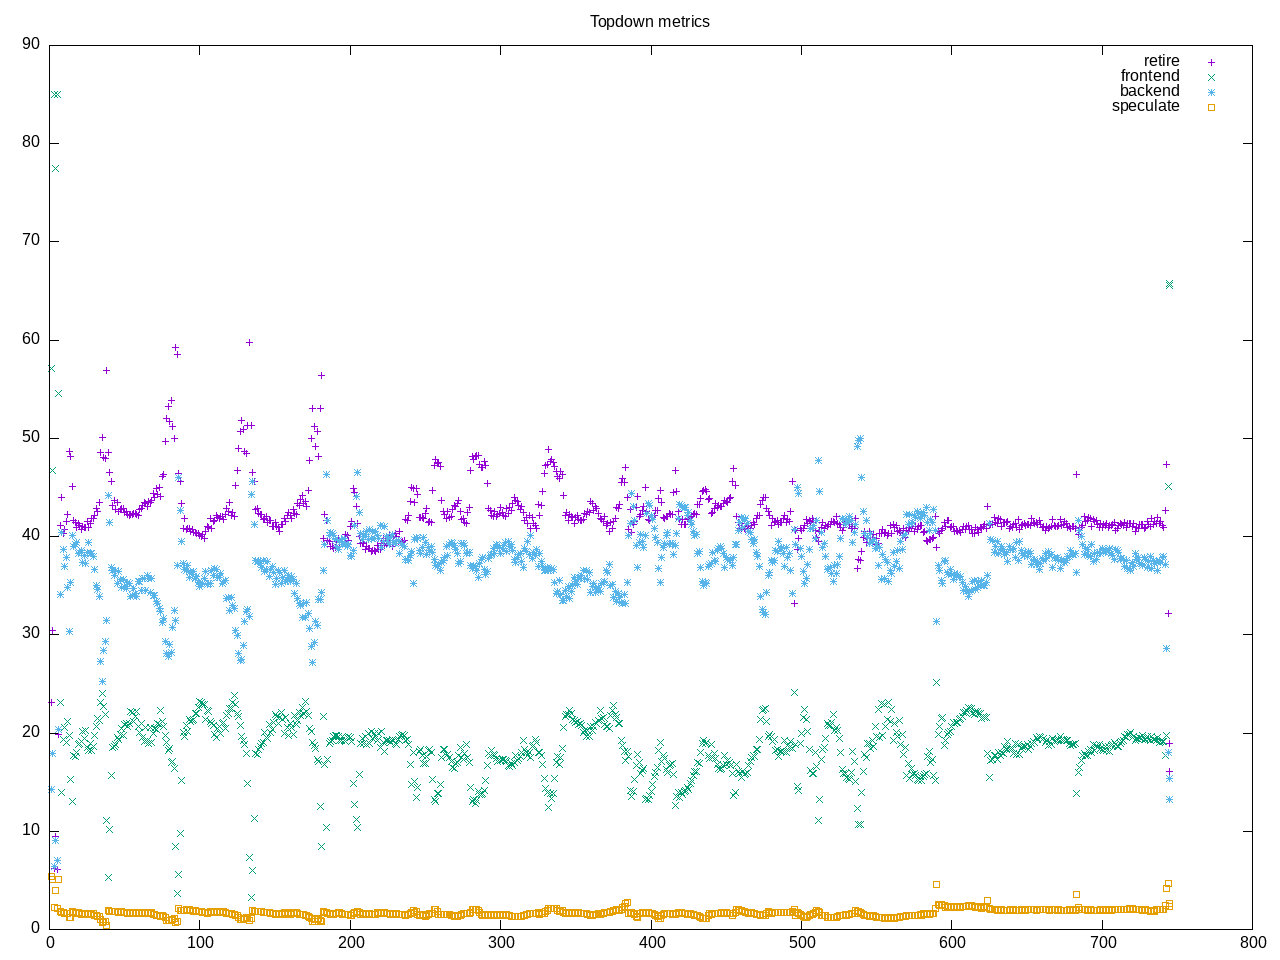
AMD metrics confirms this is on_cpu a high percentage of the time. This is floating point code with 1/5 instruction as branches.
elapsed 639.225
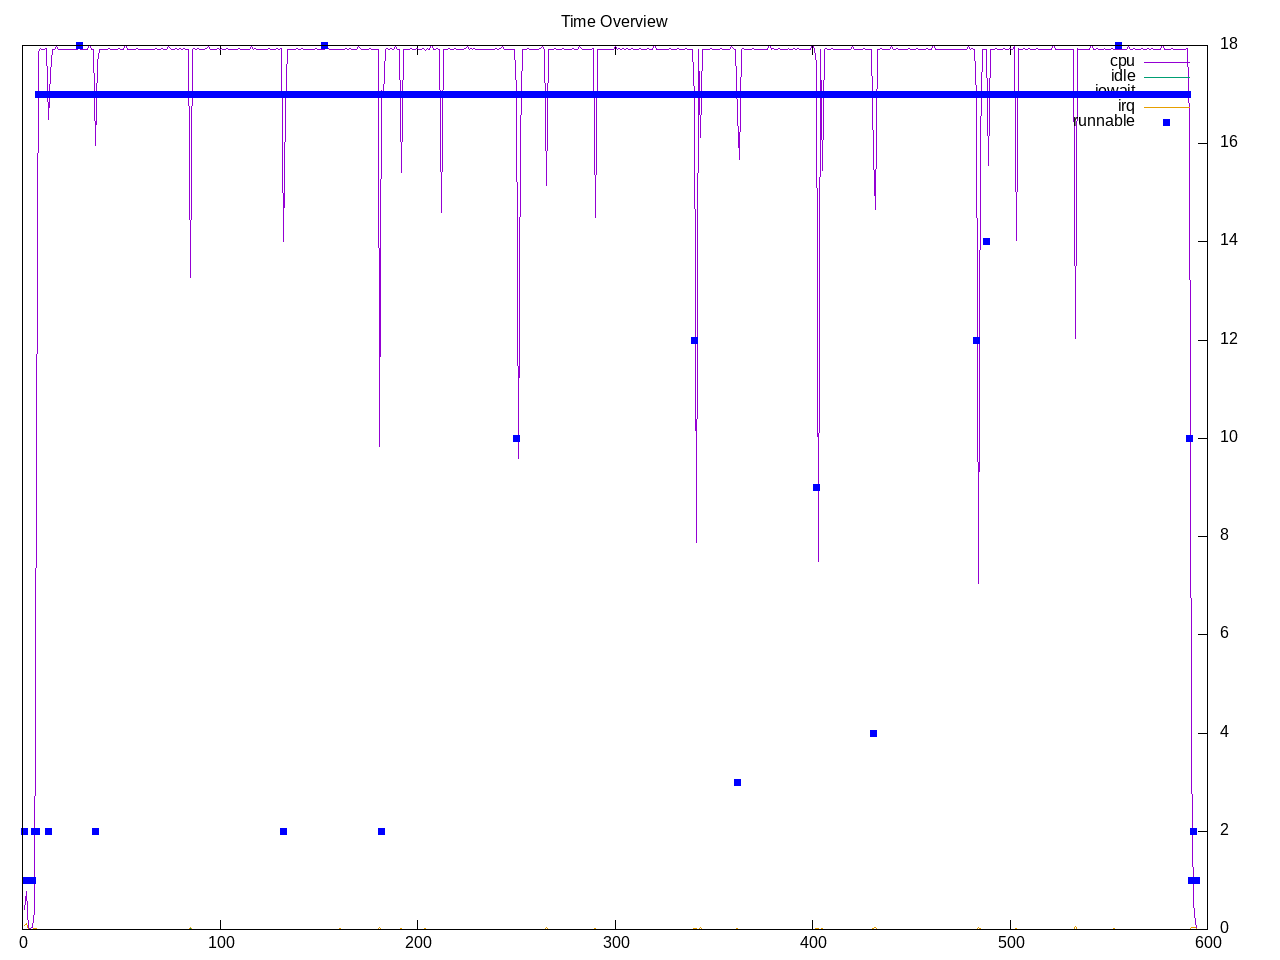
on_cpu 0.974 # 15.59 / 16 cores
utime 9958.646
stime 6.480
nvcsw 215292 # 68.36%
nivcsw 99651 # 31.64%
inblock 0 # 0.00/sec
onblock 71144 # 111.30/sec
cpu-clock 9966039733748 # 9966.040 seconds
task-clock 9966158602700 # 9966.159 seconds
page faults 735554 # 73.805/sec
context switches 313640 # 31.471/sec
cpu migrations 1654 # 0.166/sec
major page faults 8 # 0.001/sec
minor page faults 735546 # 73.804/sec
alignment faults 0 # 0.000/sec
emulation faults 0 # 0.000/sec
branches 14007495341612 # 211.445 branches per 1000 inst
branch misses 3341257044 # 0.02% branch miss
conditional 11685179228188 # 176.389 conditional branches per 1000 inst
indirect 525318798526 # 7.930 indirect branches per 1000 inst
cpu-cycles 47112380829398 # 3.74 GHz
instructions 81128016902473 # 1.72 IPC
slots 94276717844766 #
retiring 27376809665597 # 29.0% (42.0%)
-- ucode 11102347489 # 0.0%
-- fastpath 27365707318108 # 29.0%
frontend 11901900325957 # 12.6% (18.2%)
-- latency 6234972940752 # 6.6%
-- bandwidth 5666927385205 # 6.0%
backend 24883562569187 # 26.4% (38.1%)
-- cpu 8635199705225 # 9.2%
-- memory 16248362863962 # 17.2%
speculation 1078411183751 # 1.1% ( 1.7%)
-- branch mispredict 179175070523 # 0.2%
-- pipeline restart 899236113228 # 1.0%
smt-contention 29035889927224 # 30.8% ( 0.0%)
cpu-cycles 39243991456063 # 3.73 GHz
instructions 67559938891205 # 1.72 IPC
instructions 22520649909355 # 41.274 l2 access per 1000 inst
l2 hit from l1 902034805920 # 1.60% l2 miss
l2 miss from l1 13786700485 #
l2 hit from l2 pf 26419658106 #
l3 hit from l2 pf 1056269999 #
l3 miss from l2 pf 13978899 #
instructions 22505317679834 # 218.552 float per 1000 inst
float 512 982 # 0.000 AVX-512 per 1000 inst
float 256 614 # 0.000 AVX-256 per 1000 inst
float 128 4918591984823 # 218.552 AVX-128 per 1000 inst
float MMX 0 # 0.000 MMX per 1000 inst
float scalar 0 # 0.000 scalar per 1000 inst
instructions 2672234 #
opcache 987136 # 369.405 opcache per 1000 inst
opcache miss 524283 # 53.1% opcache miss rate
l1 dTLB miss 6777 # 2.536 L1 dTLB per 1000 inst
l2 dTLB miss 1199 # 0.449 L2 dTLB per 1000 inst
instructions 2700478 #
icache 1309002 # 484.730 icache per 1000 inst
icache miss 110099 # 8.4% icache miss rate
l1 iTLB miss 9 # 0.003 L1 iTLB per 1000 inst
l2 iTLB miss 0 # 0.000 L2 iTLB per 1000 inst
tlb flush 20 # 0.007 TLB flush per 1000 inst
Intel metrics
elapsed              1076.187
on_cpu               0.984          # 15.75 / 16 cores
utime                16941.117
stime                10.424
nvcsw                628917         # 82.99%
nivcsw               128878         # 17.01%
inblock              56528          # 52.53/sec
onblock              72224          # 67.11/sec
cpu-clock            16951994430620 # 16951.994 seconds
task-clock           16952153400873 # 16952.153 seconds
page faults          932561         # 55.011/sec
context switches     756965         # 44.653/sec
cpu migrations       3177           # 0.187/sec
major page faults    259            # 0.015/sec
minor page faults    932302         # 54.996/sec
alignment faults     0              # 0.000/sec
emulation faults     0              # 0.000/sec
branches             20434183000659 # 211.784 branches per 1000 inst
branch misses        8516881008     # 0.04% branch miss
conditional          20434183256243 # 211.784 conditional branches per 1000 inst
indirect             4426944693177  # 45.882 indirect branches per 1000 inst
slots                84159439116410 #
retiring             51389887615992 # 61.1% (61.1%) high
-- ucode             3059294803207  #     3.6%
-- fastpath          48330592812785 #    57.4%
frontend             31103101493743 # 37.0% (37.0%)
-- latency           10041258437846 #    11.9%
-- bandwidth         21061843055897 #    25.0%
backend              1082659792903  #  1.3% ( 1.3%) low
-- cpu               470510574004   #     0.6%
-- memory            612149218899   #     0.7%
speculation          545808698563   #  0.6% ( 0.6%) low
-- branch mispredict 239531142061   #     0.3%
-- pipeline restart  306277556502   #     0.4%
smt-contention       0              #  0.0% ( 0.0%)
cpu-cycles           34668355324230 # 2.20 GHz
instructions         66488539967899 # 1.92 IPC
l2 access            790072912798   # 18.573 l2 access per 1000 inst
l2 miss              16242071025    # 2.06% l2 miss
cpu-cycles           22697715534731 # 20.7% memory latency
load stalls          4415703252072  # 11.8% l1 bound
l1 miss              1743541712815  #  6.6% l2 bound
l2 miss              238627192184   #  1.0% l3 bound
l3 miss              632705958      #  0.0% dram bound
store_stalls         287744462332   #  1.3% store bound
Process overview shows rt as the primary process. Looks like it was incomplete in getting all the processes.
6394 processes
	1269 rt                   194461.77   119.96
	 68 clinfo                  19.53     5.96
	 38 vulkaninfo               1.15     1.14
	  4 vulkani:disk$0           0.13     0.12
	  6 glxinfo:gdrv0            0.11     0.09
	  6 glxinfo:gl0              0.11     0.09
	  2 llvmpipe-0               0.07     0.06
	  2 llvmpipe-1               0.07     0.06
	  2 llvmpipe-10              0.07     0.06
	  2 llvmpipe-11              0.07     0.06
	  2 llvmpipe-12              0.07     0.06
	  2 llvmpipe-13              0.07     0.06
	  2 llvmpipe-14              0.07     0.06
	  2 llvmpipe-15              0.07     0.06
	  2 llvmpipe-2               0.07     0.06
	  2 llvmpipe-3               0.07     0.06
	  2 llvmpipe-4               0.07     0.06
	  2 llvmpipe-5               0.07     0.06
	  2 llvmpipe-6               0.07     0.06
	  2 llvmpipe-7               0.07     0.06
	  2 llvmpipe-8               0.07     0.06
	  2 llvmpipe-9               0.07     0.06
	  6 clang                    0.07     0.05
	  2 glxinfo                  0.07     0.03
	  2 glxinfo:cs0              0.07     0.03
	  2 glxinfo:disk$0           0.07     0.03
	  2 glxinfo:sh0              0.07     0.03
	  2 glxinfo:shlo0            0.07     0.03
	  6 php                      0.04     0.10
	  3 rocminfo                 0.01     0.01
	648 benchmark                0.00     0.16
	  1 lspci                    0.00     0.03
	  1 ps                       0.00     0.01
	1453 expr                     0.00     0.00
	1328 elapsed.sh               0.00     0.00
	804 awk                      0.00     0.00
	137 date                     0.00     0.00
	 92 wc                       0.00     0.00
	 80 sh                       0.00     0.00
	 66 rm                       0.00     0.00
	 55 grep                     0.00     0.00
	 46 cat                      0.00     0.00
	 45 mv                       0.00     0.00
	 31 dc                       0.00     0.00
	 13 gcc                      0.00     0.00
	 10 gsettings                0.00     0.00
	  8 stat                     0.00     0.00
	  8 systemd-detect-          0.00     0.00
	  7 pixcmp                   0.00     0.00
	  7 tr                       0.00     0.00
	  6 llvm-link                0.00     0.00
	  5 phoronix-test-s          0.00     0.00
	  5 sed                      0.00     0.00
	  4 gmain                    0.00     0.00
	  3 uname                    0.00     0.00
	  2 cc                       0.00     0.00
	  2 dconf worker             0.00     0.00
	  2 dirname                  0.00     0.00
	  2 lscpu                    0.00     0.00
	  2 which                    0.00     0.00
	  2 xset                     0.00     0.00
	  1 basename                 0.00     0.00
	  1 bc                       0.00     0.00
	  1 brl-cad                  0.00     0.00
	  1 dmesg                    0.00     0.00
	  1 dmidecode                0.00     0.00
	  1 hostname                 0.00     0.00
	  1 ifconfig                 0.00     0.00
	  1 ip                       0.00     0.00
	  1 lsmod                    0.00     0.00
	  1 mktemp                   0.00     0.00
	  1 qdbus                    0.00     0.00
	  1 readlink                 0.00     0.00
	  1 realpath                 0.00     0.00
	  1 sort                     0.00     0.00
	  1 stty                     0.00     0.00
	  1 systemctl                0.00     0.00
	  1 template.sh              0.00     0.00
	  1 touch                    0.00     0.00
	  1 xrandr                   0.00     0.00
52 processes running
99 maximum processes