
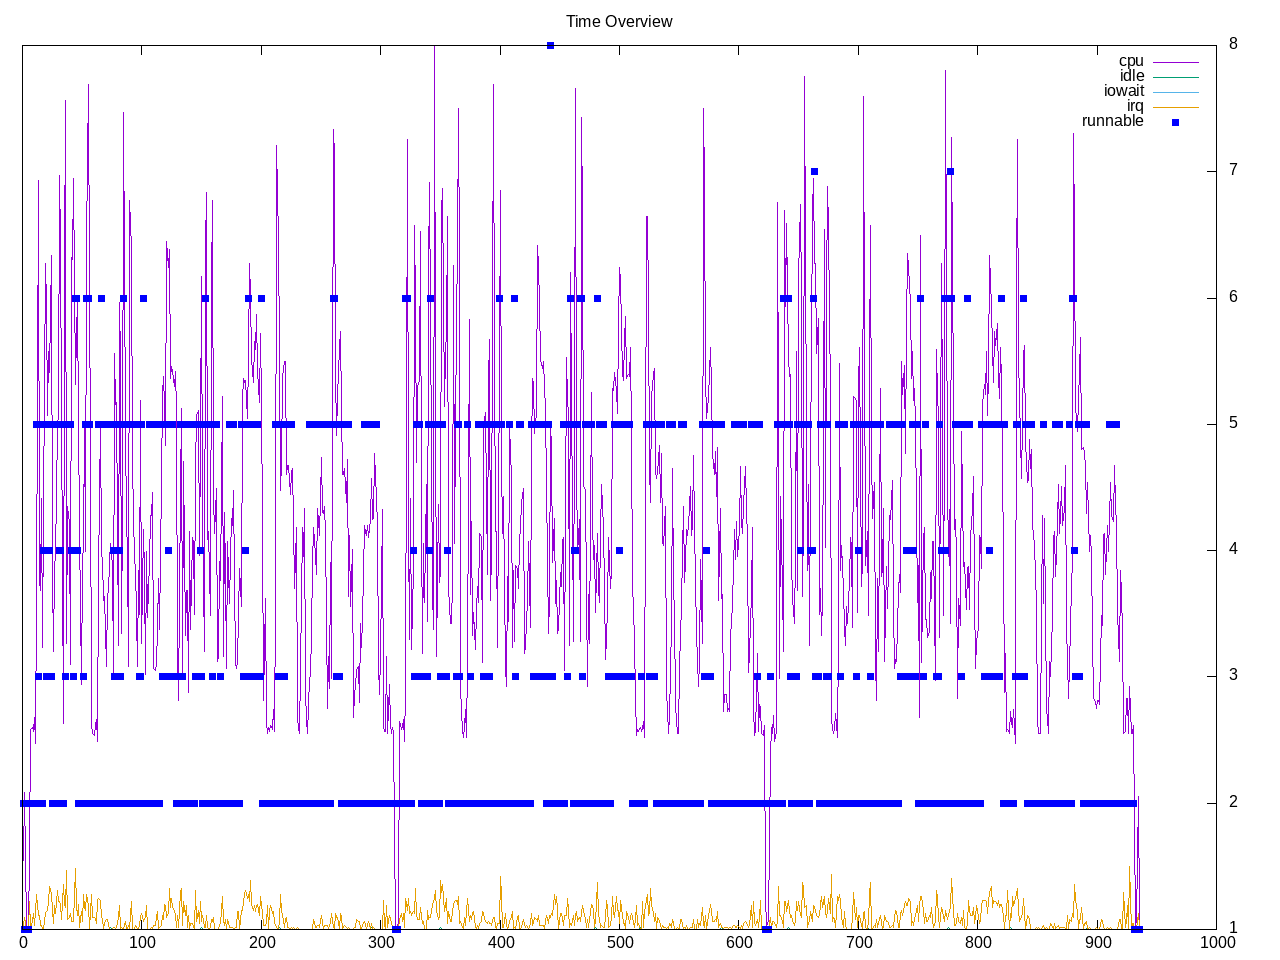
Time to build the clash-lang Haskell to VDHL/Verilog/SystemVerilog compiler. This system builds on only a subset of the cores with runnable processes changing.There is a noticeable amount of interrupts.
Topdown profile shows frontend stalls as high with backend stalls next in a range.
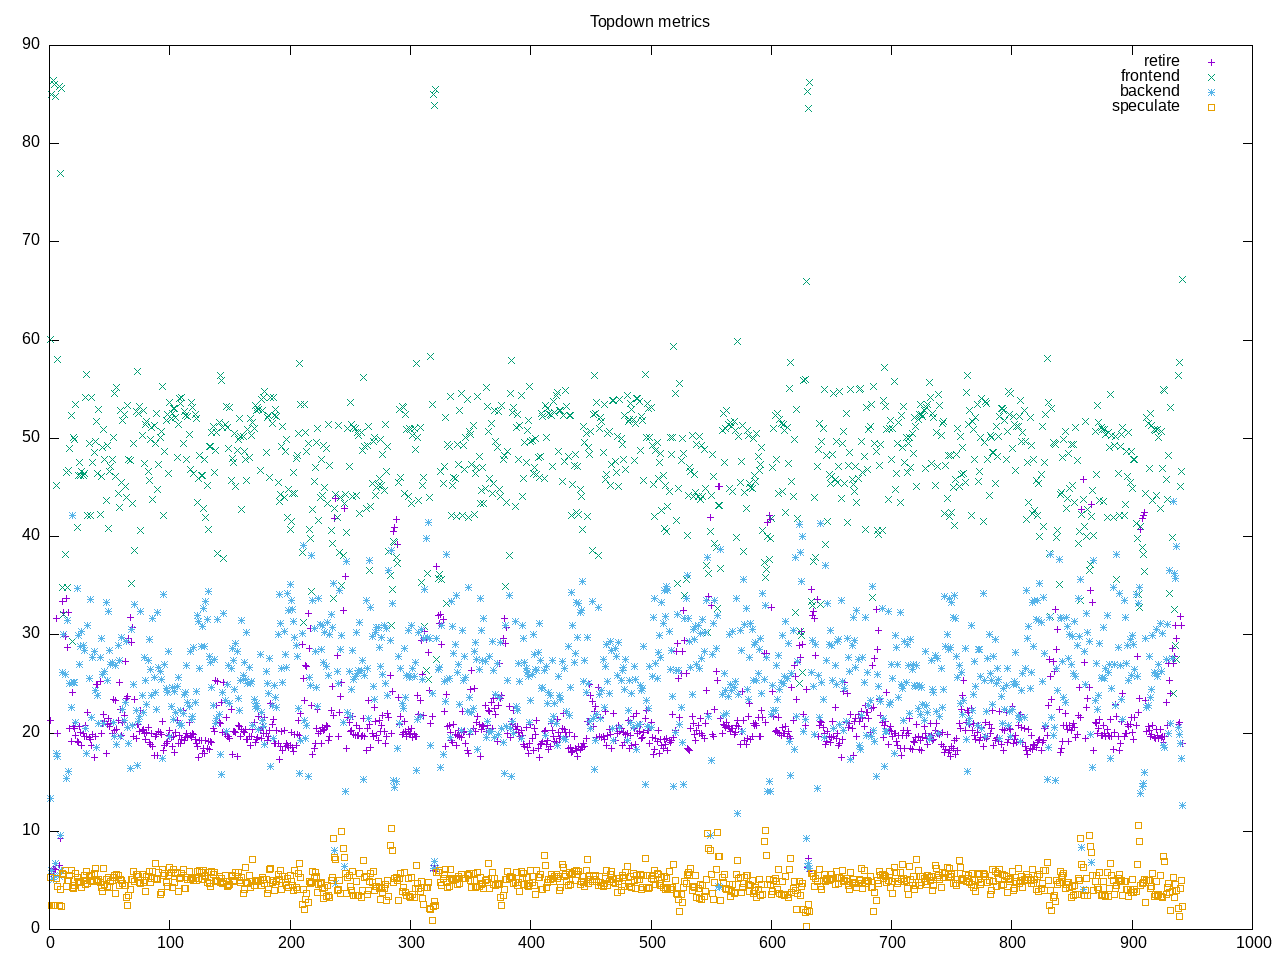
AMD metrics show two cores on average, no floating point. One in five instructions is a branch.
elapsed              943.254
on_cpu               0.128          # 2.05 / 16 cores
utime                1350.714
stime                579.751
nvcsw                529369         # 98.05%
nivcsw               10509          # 1.95%
inblock              32             # 0.03/sec
onblock              9080656        # 9626.95/sec
cpu-clock            1925510750508  # 1925.511 seconds
task-clock           1926048324360  # 1926.048 seconds
page faults          35179854       # 18265.302/sec
context switches     509918         # 264.748/sec
cpu migrations       8138           # 4.225/sec
major page faults    55             # 0.029/sec
minor page faults    35179709       # 18265.227/sec
alignment faults     0              # 0.000/sec
emulation faults     0              # 0.000/sec
branches             2043377572043  # 199.807 branches per 1000 inst
branch misses        128313051498   # 6.28% branch miss
conditional          1276610592489  # 124.831 conditional branches per 1000 inst
indirect             217093841014   # 21.228 indirect branches per 1000 inst
cpu-cycles           8313673121795  # 0.55 GHz
instructions         10094826462900 # 1.21 IPC
slots                16943857322868 #
retiring             3523609338335  # 20.8% (20.8%)
-- ucode             12290443004    #     0.1%
-- fastpath          3511318895331  #    20.7%
frontend             8039710358232  # 47.4% (47.5%) high
-- latency           6205587226386  #    36.6%
-- bandwidth         1834123131846  #    10.8%
backend              4512534563896  # 26.6% (26.7%)
-- cpu               625024650200   #     3.7%
-- memory            3887509913696  #    22.9%
speculation          835901972795   #  4.9% ( 4.9%)
-- branch mispredict 831878338020   #     4.9%
-- pipeline restart  4023634775     #     0.0%
smt-contention       32090722809    #  0.2% ( 0.0%)
cpu-cycles           8354160492929  # 0.55 GHz
instructions         10123650554383 # 1.21 IPC
instructions         3412681911672  # 34.982 l2 access per 1000 inst
l2 hit from l1       96205174518    # 26.78% l2 miss
l2 miss from l1      15673704213    #
l2 hit from l2 pf    6879988344     #
l3 hit from l2 pf    4338307940     #
l3 miss from l2 pf   11959796785    #
instructions         3409729480674  # 3.918 float per 1000 inst
float 512            6370           # 0.000 AVX-512 per 1000 inst
float 256            10224585       # 0.003 AVX-256 per 1000 inst
float 128            13350692007    # 3.915 AVX-128 per 1000 inst
float MMX            0              # 0.000 MMX per 1000 inst
float scalar         0              # 0.000 scalar per 1000 inst
instructions         2711526        #
opcache              1002139        # 369.585 opcache per 1000 inst
opcache miss         537719         # 53.7% opcache miss rate
l1 dTLB miss         5687           # 2.097 L1 dTLB per 1000 inst
l2 dTLB miss         1209           # 0.446 L2 dTLB per 1000 inst
instructions         2743858        #
icache               1331569        # 485.291 icache per 1000 inst
icache miss          112012         #  8.4% icache miss rate
l1 iTLB miss         8              # 0.003 L1 iTLB per 1000 inst
l2 iTLB miss         0              # 0.000 L2 iTLB per 1000 inst
tlb flush            19             # 0.007 TLB flush per 1000 inst
Intel metrics
elapsed              933.262
on_cpu               0.120          # 1.93 / 16 cores
utime                1377.167
stime                421.546
nvcsw                481761         # 95.77%
nivcsw               21269          # 4.23%
inblock              11560          # 12.39/sec
onblock              9069416        # 9717.98/sec
cpu-clock            1789592121062  # 1789.592 seconds
task-clock           1790141697509  # 1790.142 seconds
page faults          35173091       # 19648.216/sec
context switches     475446         # 265.591/sec
cpu migrations       15612          # 8.721/sec
major page faults    106            # 0.059/sec
minor page faults    35172940       # 19648.132/sec
alignment faults     0              # 0.000/sec
emulation faults     0              # 0.000/sec
branches             2167976430602  # 185.975 branches per 1000 inst
branch misses        46314803455    # 2.14% branch miss
conditional          2167977636842  # 185.975 conditional branches per 1000 inst
indirect             236751245693   # 20.309 indirect branches per 1000 inst
slots                38620667784266 #
retiring             10062018842874 # 26.1% (26.1%)
-- ucode             807698917570   #     2.1%
-- fastpath          9254319925304  #    24.0%
frontend             13551174827531 # 35.1% (35.1%)
-- latency           8548975097340  #    22.1%
-- bandwidth         5002199730191  #    13.0%
backend              9175517911992  # 23.8% (23.8%)
-- cpu               3393190446142  #     8.8%
-- memory            5782327465850  #    15.0%
speculation          5780856758211  # 15.0% (15.0%) high
-- branch mispredict 5692519034679  #    14.7%
-- pipeline restart  88337723532    #     0.2%
smt-contention       0              #  0.0% ( 0.0%)
cpu-cycles           6645969571438  # 0.45 GHz
instructions         11758840162591 # 1.77 IPC
l2 access            390896034086   # 34.055 l2 access per 1000 inst
l2 miss              145819187216   # 37.30% l2 miss
cpu-cycles           6464808070216  # 23.7% memory latency
load stalls          1447783462483  #  2.0% l1 bound
l1 miss              1317212090663  #  9.1% l2 bound
l2 miss              731698414701   #  2.4% l3 bound
l3 miss              576204429564   #  8.9% dram bound
store_stalls         84132000633    #  1.3% store bound
Process overview shows most of the time in ghc (haskell compiler). Numerically there are many “cc” but not always time allocated?
37688 processes
	721 ghc:w                15652.67  6544.89
	165 ghc_ticker            1185.23   498.89
	120 ghc                   1182.36   497.01
	740 ld.gold                 51.83     9.18
	 45 nix-shell               27.91     6.15
	2328 as                      26.61     7.12
	 68 clinfo                  15.54     7.31
	 18 nix-instantiate          8.90     1.90
	108 Setup:w                  8.65     5.58
	1107 cc1                      8.39     4.35
	4363 gcc                      4.93     0.65
	154 bash                     3.91     1.66
	 51 strip                    3.87     5.62
	 36 Setup                    2.89     1.86
	  9 ranlib                   2.55     3.87
	 45 nix-store                1.72     2.82
	 63 ghc-pkg                  1.52     0.32
	 38 vulkaninfo               1.11     1.33
	 72 jq                       0.69     0.00
	 18 ar                       0.24     0.33
	  4 vulkani:disk$0           0.11     0.14
	 27 haddock:w                0.11     0.12
	  6 glxinfo:gdrv0            0.10     0.06
	  6 glxinfo:gl0              0.10     0.06
	  6 php                      0.06     0.20
	  2 llvmpipe-0               0.06     0.07
	  2 llvmpipe-1               0.06     0.07
	  2 llvmpipe-10              0.06     0.07
	  2 llvmpipe-11              0.06     0.07
	  2 llvmpipe-12              0.06     0.07
	  2 llvmpipe-13              0.06     0.07
	  2 llvmpipe-14              0.06     0.07
	  2 llvmpipe-15              0.06     0.07
	  2 llvmpipe-2               0.06     0.07
	  2 llvmpipe-3               0.06     0.07
	  2 llvmpipe-4               0.06     0.07
	  2 llvmpipe-5               0.06     0.07
	  2 llvmpipe-6               0.06     0.07
	  2 llvmpipe-7               0.06     0.07
	  2 llvmpipe-8               0.06     0.07
	  2 llvmpipe-9               0.06     0.07
	  2 glxinfo                  0.06     0.03
	  2 glxinfo:cs0              0.06     0.03
	  2 glxinfo:disk$0           0.06     0.03
	  2 glxinfo:sh0              0.06     0.03
	  2 glxinfo:shlo0            0.06     0.03
	  6 clang                    0.04     0.08
	  9 haddock                  0.04     0.04
	 30 patchelf                 0.00     0.90
	  1 lspci                    0.00     0.02
	  1 ps                       0.00     0.01
	22487 cc                       0.00     0.00
	1427 readlink                 0.00     0.00
	1272 expand-response          0.00     0.00
	795 cp                       0.00     0.00
	713 collect2                 0.00     0.00
	 87 find                     0.00     0.00
	 82 sh                       0.00     0.00
	 78 touch                    0.00     0.00
	 39 mkdir                    0.00     0.00
	 37 grep                     0.00     0.00
	 21 chmod                    0.00     0.00
	 13 sort                     0.00     0.00
	 12 xargs                    0.00     0.00
	 11 gsettings                0.00     0.00
	  9 /nix/store/871g          0.00     0.00
	  9 HsColour                 0.00     0.00
	  9 basename                 0.00     0.00
	  9 cut                      0.00     0.00
	  9 gawk                     0.00     0.00
	  9 head                     0.00     0.00
	  9 hpc                      0.00     0.00
	  9 hsc2hs                   0.00     0.00
	  9 jailbreak-cabal          0.00     0.00
	  9 mv                       0.00     0.00
	  9 runghc                   0.00     0.00
	  9 tail                     0.00     0.00
	  9 tar                      0.00     0.00
	  8 stat                     0.00     0.00
	  8 systemd-detect-          0.00     0.00
	  7 realpath                 0.00     0.00
	  6 llvm-link                0.00     0.00
	  6 tr                       0.00     0.00
	  5 phoronix-test-s          0.00     0.00
	  4 dirname                  0.00     0.00
	  4 gmain                    0.00     0.00
	  4 sed                      0.00     0.00
	  3 echo                     0.00     0.00
	  3 rm                       0.00     0.00
	  3 rocminfo                 0.00     0.00
	  3 seq                      0.00     0.00
	  3 tee                      0.00     0.00
	  2 lscpu                    0.00     0.00
	  2 uname                    0.00     0.00
	  2 which                    0.00     0.00
	  2 xset                     0.00     0.00
	  1 date                     0.00     0.00
	  1 dconf worker             0.00     0.00
	  1 dmesg                    0.00     0.00
	  1 dmidecode                0.00     0.00
	  1 ifconfig                 0.00     0.00
	  1 ip                       0.00     0.00
	  1 lsmod                    0.00     0.00
	  1 mktemp                   0.00     0.00
	  1 qdbus                    0.00     0.00
	  1 stty                     0.00     0.00
	  1 systemctl                0.00     0.00
	  1 template.sh              0.00     0.00
	  1 wc                       0.00     0.00
	  1 xrandr                   0.00     0.00
1 processes running
49 maximum processes