
Workload builds the Gem5 architectural simulator, much of the build looks parallel followed by a more serial link type step.
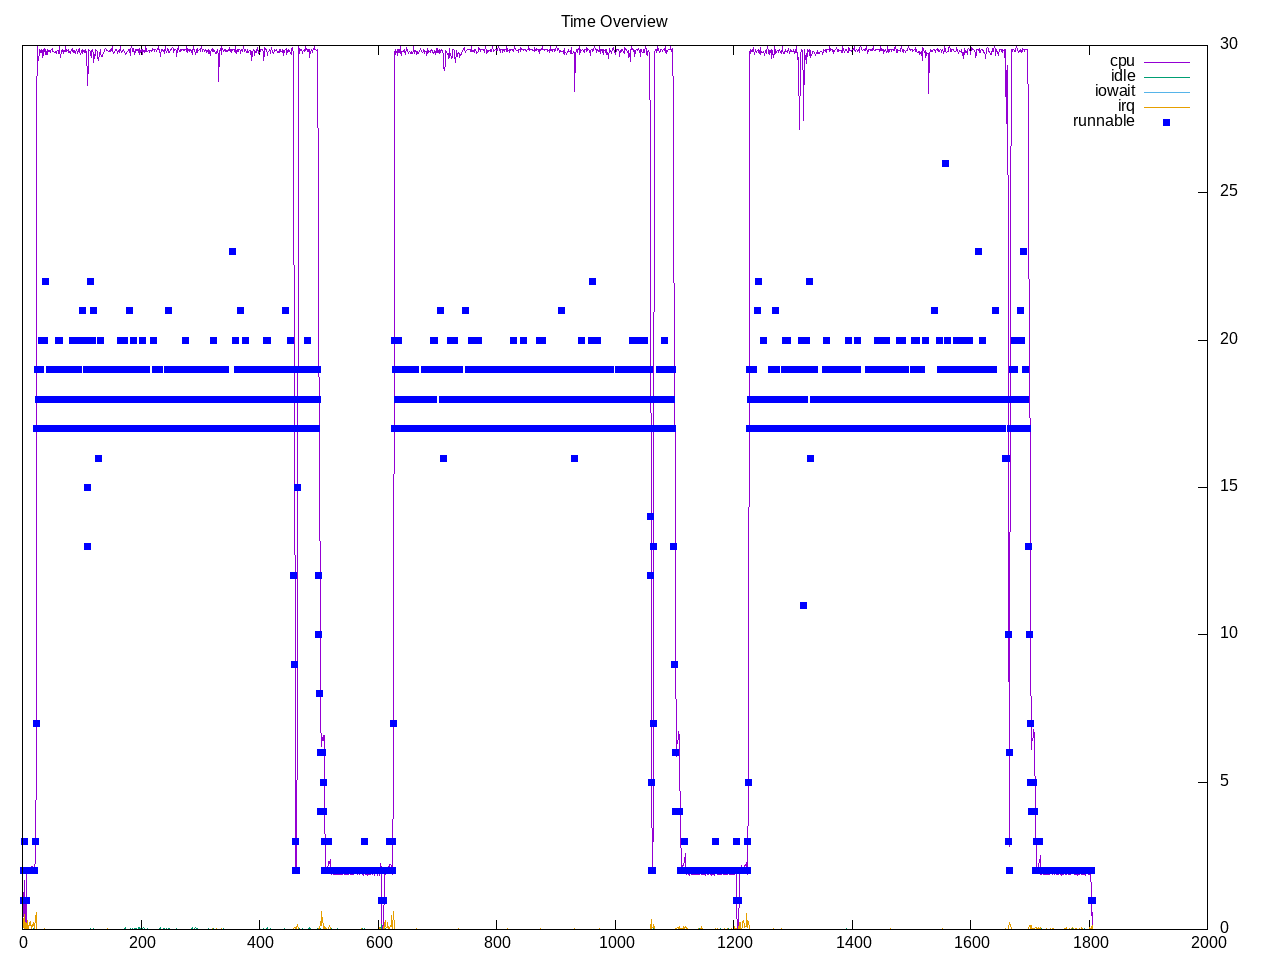
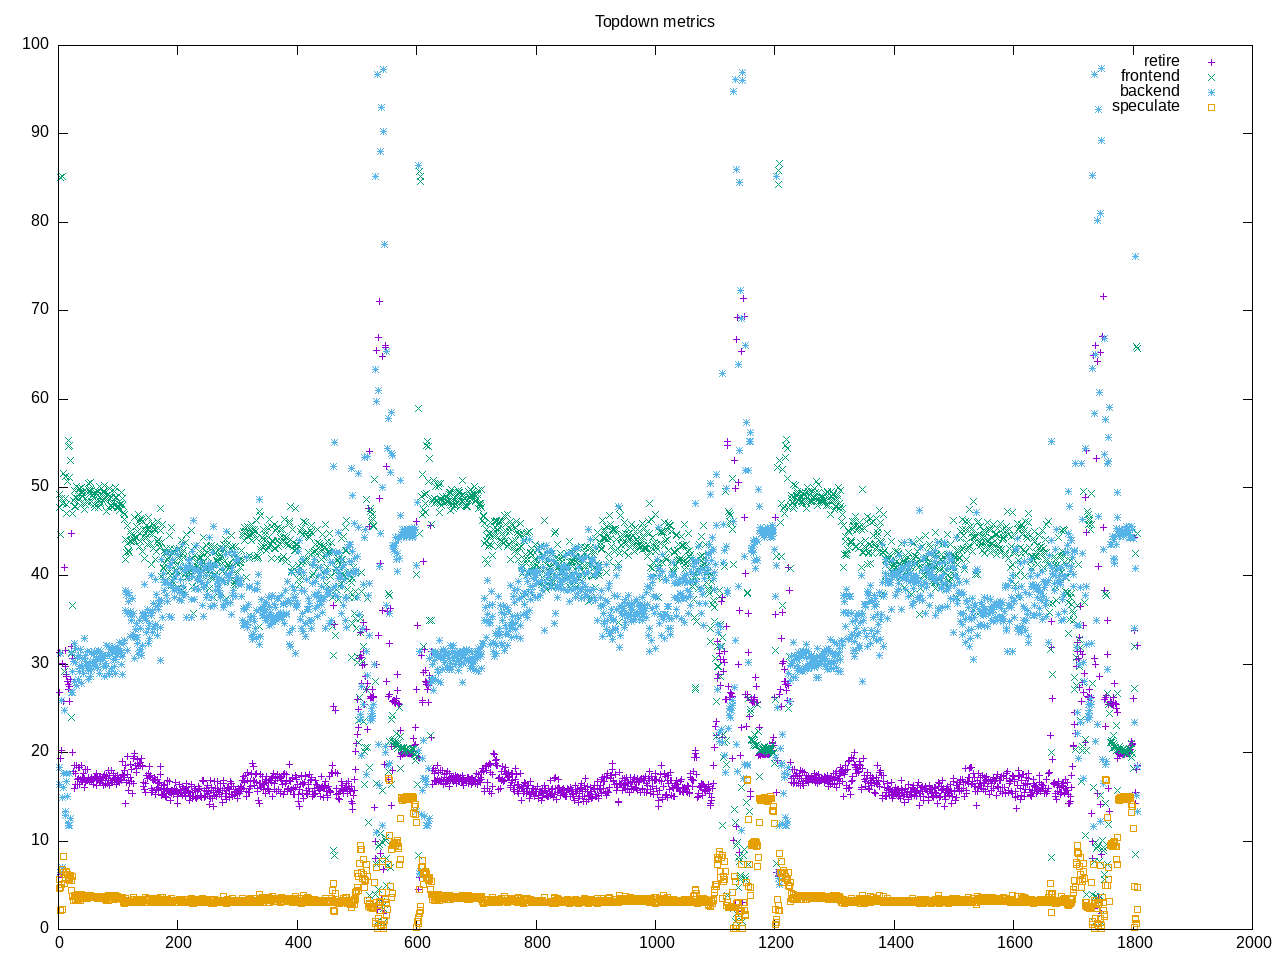
Topdown profile has some general trends of increasing and decreasing backend stalls vs frontend stalls with retirement rate fairly constant. Link steps are also more scattered.
AMD metrics show an average of ~3/4 of the cores. Not much floating point and a relatively low retirement rate. Overall frontend stalls are more than backend stalls.
elapsed              1810.174
on_cpu               0.798          # 12.77 / 16 cores
utime                21039.238
stime                2080.631
nvcsw                5803731        # 49.87%
nivcsw               5834033        # 50.13%
inblock              264736         # 146.25/sec
onblock              28346440       # 15659.51/sec
cpu-clock            23120522443545 # 23120.522 seconds
task-clock           23121037448160 # 23121.037 seconds
page faults          570590844      # 24678.427/sec
context switches     11599518       # 501.687/sec
cpu migrations       85722          # 3.708/sec
major page faults    355            # 0.015/sec
minor page faults    570590489      # 24678.412/sec
alignment faults     0              # 0.000/sec
emulation faults     0              # 0.000/sec
branches             16761584492164 # 212.300 branches per 1000 inst
branch misses        551611408858   # 3.29% branch miss
conditional          12834111922087 # 162.555 conditional branches per 1000 inst
indirect             447266406613   # 5.665 indirect branches per 1000 inst
cpu-cycles           93170670452725 # 3.21 GHz
instructions         78575451599875 # 0.84 IPC
slots                187059658915890 #
retiring             25539899492009 # 13.7% (16.7%)
-- ucode             28169462556    #     0.0%
-- fastpath          25511730029453 #    13.6%
frontend             66132587341647 # 35.4% (43.3%)
-- latency           50402032103478 #    26.9%
-- bandwidth         15730555238169 #     8.4%
backend              55784381168682 # 29.8% (36.5%)
-- cpu               5570341440845  #     3.0%
-- memory            50214039727837 #    26.8%
speculation          5229248647360  #  2.8% ( 3.4%)
-- branch mispredict 5186046814231  #     2.8%
-- pipeline restart  43201833129    #     0.0%
smt-contention       34373330798460 # 18.4% ( 0.0%)
cpu-cycles           93195909000520 # 3.22 GHz
instructions         78560812172363 # 0.84 IPC
instructions         26242593467181 # 56.818 l2 access per 1000 inst
l2 hit from l1       1312292335999  # 22.59% l2 miss
l2 miss from l1      243869038203   #
l2 hit from l2 pf    85842273432    #
l3 hit from l2 pf    33296301776    #
l3 miss from l2 pf   59615007749    #
instructions         26232003919217 # 16.024 float per 1000 inst
float 512            18926          # 0.000 AVX-512 per 1000 inst
float 256            15702223       # 0.001 AVX-256 per 1000 inst
float 128            420327679598   # 16.023 AVX-128 per 1000 inst
float MMX            0              # 0.000 MMX per 1000 inst
float scalar         96             # 0.000 scalar per 1000 inst
instructions         2688226        #
opcache              992870         # 369.340 opcache per 1000 inst
opcache miss         533920         # 53.8% opcache miss rate
l1 dTLB miss         6899           # 2.566 L1 dTLB per 1000 inst
l2 dTLB miss         1234           # 0.459 L2 dTLB per 1000 inst
instructions         2731843        #
icache               1332619        # 487.810 icache per 1000 inst
icache miss          114026         #  8.6% icache miss rate
l1 iTLB miss         11             # 0.004 L1 iTLB per 1000 inst
l2 iTLB miss         0              # 0.000 L2 iTLB per 1000 inst
tlb flush            20             # 0.007 TLB flush per 1000 inst
Intel metrics
elapsed              2076.244
on_cpu               0.816          # 13.06 / 16 cores
utime                25333.567
stime                1777.001
nvcsw                5656806        # 49.63%
nivcsw               5740028        # 50.37%
inblock              5287080        # 2546.46/sec
onblock              28341616       # 13650.43/sec
cpu-clock            27109637330759 # 27109.637 seconds
task-clock           27110152714913 # 27110.153 seconds
page faults          570476396      # 21042.906/sec
context switches     11358674       # 418.982/sec
cpu migrations       77819          # 2.870/sec
major page faults    3385           # 0.125/sec
minor page faults    570473011      # 21042.781/sec
alignment faults     0              # 0.000/sec
emulation faults     0              # 0.000/sec
branches             16554533948074 # 210.331 branches per 1000 inst
branch misses        420682840418   # 2.54% branch miss
conditional          16554535761194 # 210.331 conditional branches per 1000 inst
indirect             3208214057581  # 40.761 indirect branches per 1000 inst
slots                131943668586950 #
retiring             41217833930568 # 31.2% (31.2%)
-- ucode             3112135628076  #     2.4%
-- fastpath          38105698302492 #    28.9%
frontend             48463557156999 # 36.7% (36.7%)
-- latency           27839065050420 #    21.1%
-- bandwidth         20624492106579 #    15.6%
backend              25399276106394 # 19.3% (19.3%)
-- cpu               7245422419378  #     5.5%
-- memory            18153853687016 #    13.8%
speculation          17330208537534 # 13.1% (13.1%) high
-- branch mispredict 16790007180191 #    12.7%
-- pipeline restart  540201357343   #     0.4%
smt-contention       0              #  0.0% ( 0.0%)
cpu-cycles           56299806242194 # 1.71 GHz
instructions         58419307240398 # 1.04 IPC
l2 access            2518816460984  # 58.099 l2 access per 1000 inst
l2 miss              761491659232   # 30.23% l2 miss
cpu-cycles           41773327892901 # 39.7% memory latency
load stalls          16220631545169 #  6.6% l1 bound
l1 miss              13482977988921 #  9.4% l2 bound
l2 miss              9548023073896  #  4.6% l3 bound
l3 miss              7615533491900  # 18.2% dram bound
store_stalls         357499861823   #  0.9% store bound
Process overview shows C++ code with most time in the c11plus front end.
56641 processes
	6774 cc1plus              18279.62  1401.27
	 54 scons                 2290.93   186.88
	7803 as                    1291.39   202.47
	2730 gem5py_m5              761.97    38.80
	 51 ld                     261.27    23.85
	2781 gem5py                 104.47     9.99
	 68 clinfo                  17.85     6.34
	1029 cc1                      1.66     0.19
	  3 gzip                     1.00     0.09
	 38 vulkaninfo               0.76     1.52
	  6 php                      0.18     0.43
	  6 glxinfo:gdrv0            0.13     0.05
	  6 glxinfo:gl0              0.13     0.05
	  4 vulkani:disk$0           0.08     0.16
	  4 python3                  0.08     0.03
	  2 glxinfo                  0.08     0.02
	  2 glxinfo:cs0              0.08     0.02
	  2 glxinfo:disk$0           0.08     0.02
	  2 glxinfo:sh0              0.08     0.02
	  2 glxinfo:shlo0            0.08     0.02
	  6 clang                    0.07     0.05
	  3 tar                      0.04     1.03
	  2 llvmpipe-0               0.04     0.08
	  2 llvmpipe-1               0.04     0.08
	  2 llvmpipe-10              0.04     0.08
	  2 llvmpipe-11              0.04     0.08
	  2 llvmpipe-12              0.04     0.08
	  2 llvmpipe-13              0.04     0.08
	  2 llvmpipe-14              0.04     0.08
	  2 llvmpipe-15              0.04     0.08
	  2 llvmpipe-2               0.04     0.08
	  2 llvmpipe-3               0.04     0.08
	  2 llvmpipe-4               0.04     0.08
	  2 llvmpipe-5               0.04     0.08
	  2 llvmpipe-6               0.04     0.08
	  2 llvmpipe-7               0.04     0.08
	  2 llvmpipe-8               0.04     0.08
	  2 llvmpipe-9               0.04     0.08
	  3 rocminfo                 0.03     0.00
	  7 rm                       0.02     2.94
	 21 ar                       0.02     0.07
	6833 g++                      0.00     0.06
	 21 ranlib                   0.00     0.06
	  1 lspci                    0.00     0.02
	  1 ps                       0.00     0.01
	26956 sh                       0.00     0.00
	1078 gcc                      0.00     0.00
	 66 python3-config           0.00     0.00
	 51 collect2                 0.00     0.00
	 28 sed                      0.00     0.00
	 13 dirname                  0.00     0.00
	 13 readlink                 0.00     0.00
	  9 m4                       0.00     0.00
	  9 native-elf-form          0.00     0.00
	  8 stat                     0.00     0.00
	  8 systemd-detect-          0.00     0.00
	  8 which                    0.00     0.00
	  6 gsettings                0.00     0.00
	  6 llvm-link                0.00     0.00
	  6 pkg-config               0.00     0.00
	  6 swig                     0.00     0.00
	  5 cc                       0.00     0.00
	  5 dconf worker             0.00     0.00
	  5 gmain                    0.00     0.00
	  5 phoronix-test-s          0.00     0.00
	  4 bash                     0.00     0.00
	  4 date                     0.00     0.00
	  4 mktemp                   0.00     0.00
	  3 awk                      0.00     0.00
	  3 basename                 0.00     0.00
	  3 build-gem5               0.00     0.00
	  3 conftest_2176b2          0.00     0.00
	  3 conftest_283931          0.00     0.00
	  3 readelf                  0.00     0.00
	  3 touch                    0.00     0.00
	  2 lscpu                    0.00     0.00
	  2 uname                    0.00     0.00
	  2 xset                     0.00     0.00
	  1 dmesg                    0.00     0.00
	  1 dmidecode                0.00     0.00
	  1 grep                     0.00     0.00
	  1 ifconfig                 0.00     0.00
	  1 ip                       0.00     0.00
	  1 lsmod                    0.00     0.00
	  1 python                   0.00     0.00
	  1 qdbus                    0.00     0.00
	  1 realpath                 0.00     0.00
	  1 sort                     0.00     0.00
	  1 stty                     0.00     0.00
	  1 systemctl                0.00     0.00
	  1 template.sh              0.00     0.00
	  1 wc                       0.00     0.00
	  1 xrandr                   0.00     0.00
1 processes running
108 maximum processes