
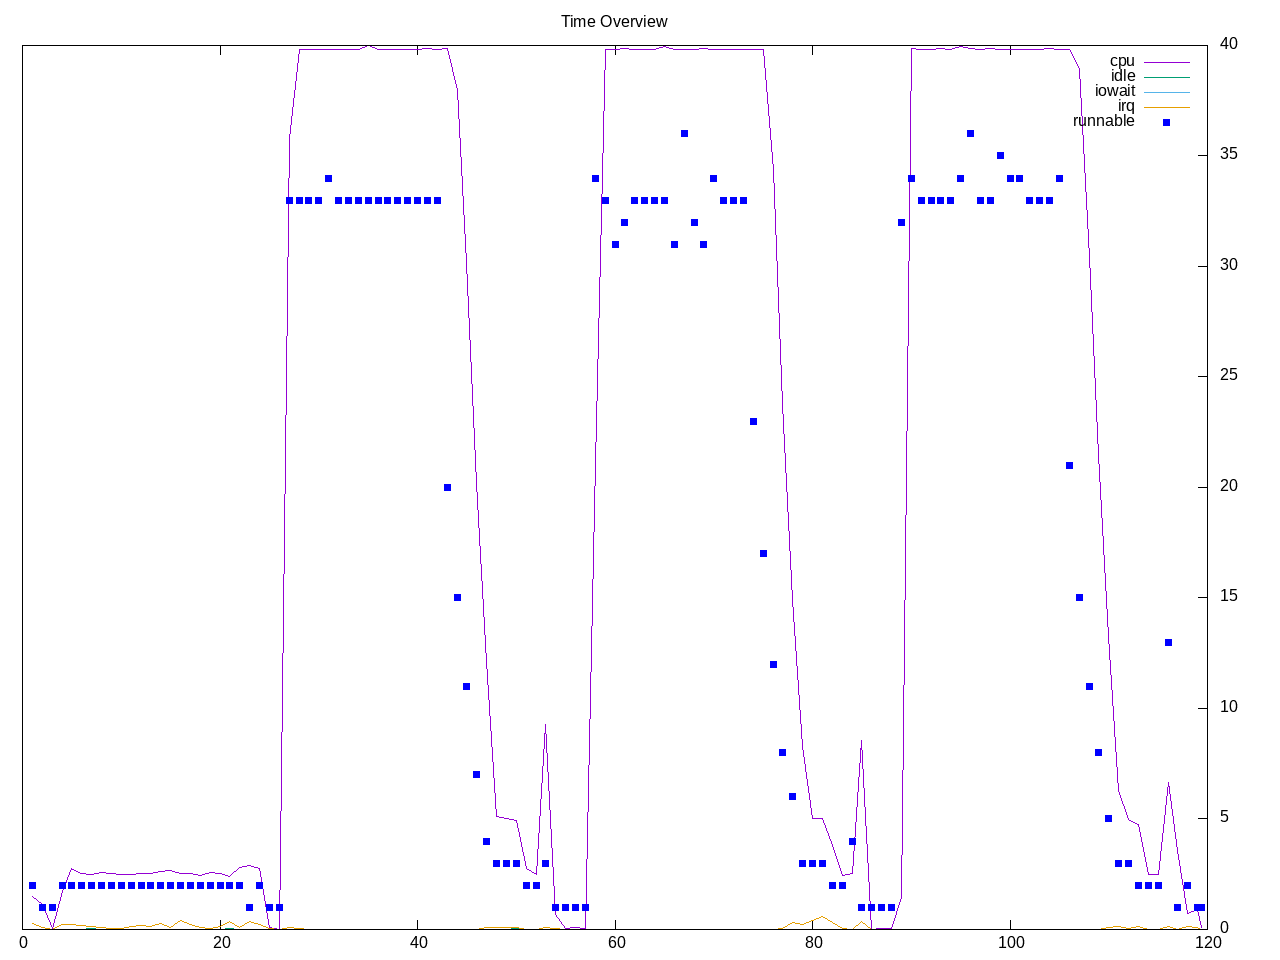
This workload builds imagemagick. Overall runs in about two minutes with a relatively quick parallel build and a link step. There is also a preparation step before starting.
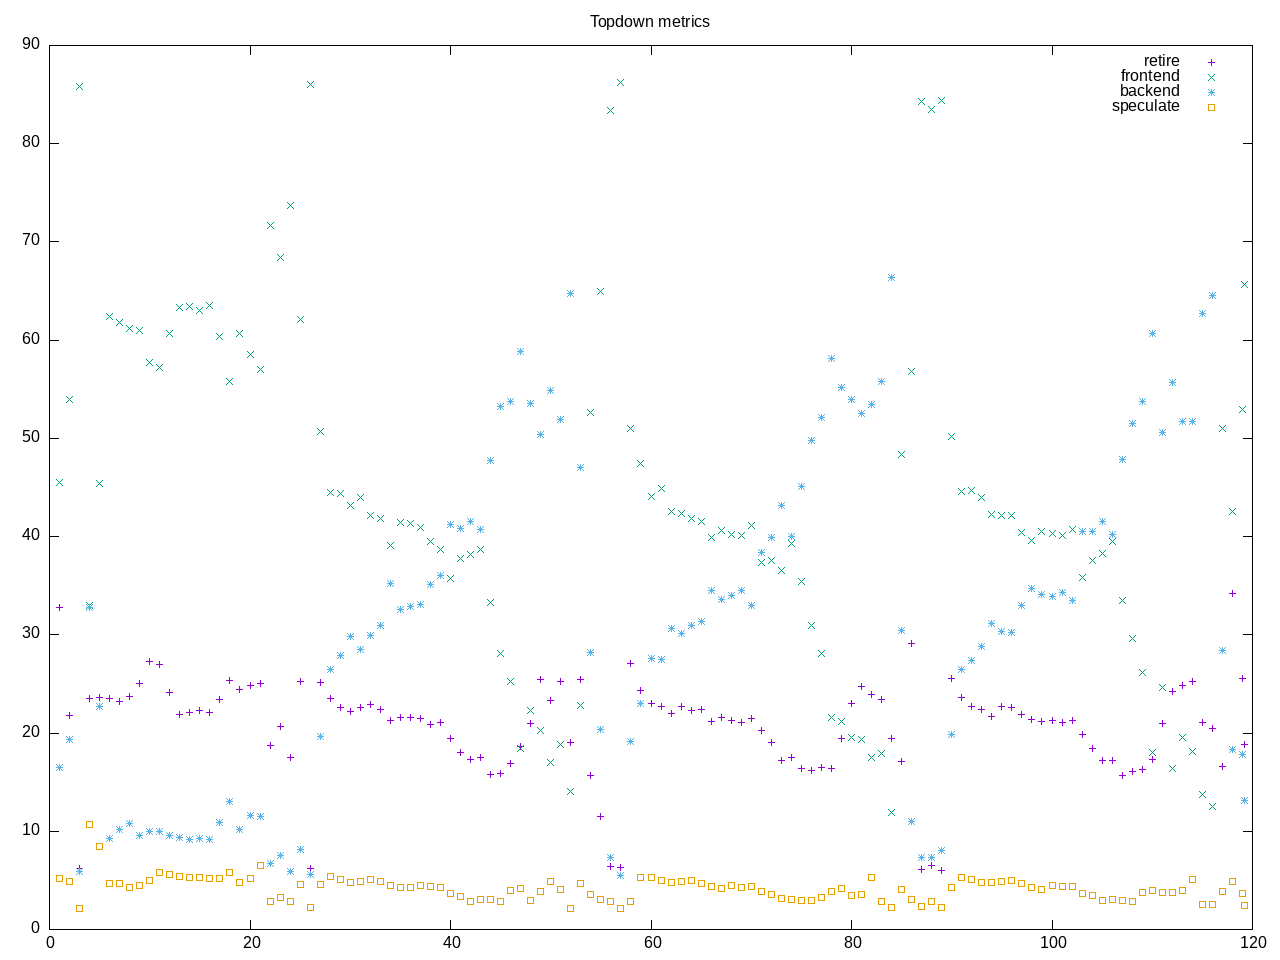
Topdown profile shows a familiar pattern for compiler builds, high and declining frontend stalls, rising backend stalls and overall a lower retirement rate.
AMD metrics show on average half the cores occupied, not much floating point.
elapsed              121.463
on_cpu               0.517          # 8.27 / 16 cores
utime                910.027
stime                95.049
nvcsw                86757          # 39.06%
nivcsw               135379         # 60.94%
inblock              0              # 0.00/sec
onblock              3834872        # 31572.30/sec
cpu-clock            1004331305928  # 1004.331 seconds
task-clock           1004388770173  # 1004.389 seconds
page faults          24696037       # 24588.125/sec
context switches     197011         # 196.150/sec
cpu migrations       13647          # 13.587/sec
major page faults    529            # 0.527/sec
minor page faults    24695508       # 24587.599/sec
alignment faults     0              # 0.000/sec
emulation faults     0              # 0.000/sec
branches             881822730340   # 209.423 branches per 1000 inst
branch misses        25658571898    # 2.91% branch miss
conditional          681669337951   # 161.889 conditional branches per 1000 inst
indirect             18455873299    # 4.383 indirect branches per 1000 inst
cpu-cycles           3886473532658  # 2.02 GHz
instructions         4120028775049  # 1.06 IPC
slots                8055904537614  #
retiring             1361408959871  # 16.9% (20.5%)
-- ucode             1620623294     #     0.0%
-- fastpath          1359788336577  #    16.9%
frontend             2556571217388  # 31.7% (38.5%)
-- latency           1898570714334  #    23.6%
-- bandwidth         658000503054   #     8.2%
backend              2452525094427  # 30.4% (36.9%)
-- cpu               254685635940   #     3.2%
-- memory            2197839458487  #    27.3%
speculation          278229523338   #  3.5% ( 4.2%)
-- branch mispredict 274936481894   #     3.4%
-- pipeline restart  3293041444     #     0.0%
smt-contention       1407144242303  # 17.5% ( 0.0%)
cpu-cycles           3886806462922  # 2.03 GHz
instructions         4125209256247  # 1.06 IPC
instructions         1400552808014  # 44.647 l2 access per 1000 inst
l2 hit from l1       52031669429    # 21.21% l2 miss
l2 miss from l1      7552194472     #
l2 hit from l2 pf    4785652675     #
l3 hit from l2 pf    2800899245     #
l3 miss from l2 pf   2911846570     #
instructions         1398659814466  # 23.038 float per 1000 inst
float 512            6354           # 0.000 AVX-512 per 1000 inst
float 256            673666         # 0.000 AVX-256 per 1000 inst
float 128            32221959755    # 23.038 AVX-128 per 1000 inst
float MMX            0              # 0.000 MMX per 1000 inst
float scalar         0              # 0.000 scalar per 1000 inst
instructions         2696065        #
opcache              997995         # 370.167 opcache per 1000 inst
opcache miss         536437         # 53.8% opcache miss rate
l1 dTLB miss         6887           # 2.554 L1 dTLB per 1000 inst
l2 dTLB miss         1278           # 0.474 L2 dTLB per 1000 inst
instructions         2718985        #
icache               1318932        # 485.082 icache per 1000 inst
icache miss          110459         #  8.4% icache miss rate
l1 iTLB miss         6              # 0.002 L1 iTLB per 1000 inst
l2 iTLB miss         0              # 0.000 L2 iTLB per 1000 inst
tlb flush            20             # 0.007 TLB flush per 1000 inst
Intel metrics
elapsed              121.485
on_cpu               0.562          # 8.99 / 16 cores
utime                1022.044
stime                69.759
nvcsw                92658          # 39.41%
nivcsw               142426         # 60.59%
inblock              125080         # 1029.60/sec
onblock              3791904        # 31213.03/sec
cpu-clock            1090495239228  # 1090.495 seconds
task-clock           1090585956640  # 1090.586 seconds
page faults          24511292       # 22475.342/sec
context switches     209668         # 192.253/sec
cpu migrations       14190          # 13.011/sec
major page faults    776            # 0.712/sec
minor page faults    24510516       # 22474.630/sec
alignment faults     0              # 0.000/sec
emulation faults     0              # 0.000/sec
branches             892377479585   # 208.705 branches per 1000 inst
branch misses        20956429584    # 2.35% branch miss
conditional          892378359361   # 208.706 conditional branches per 1000 inst
indirect             158427246548   # 37.052 indirect branches per 1000 inst
slots                14900768800922 #
retiring             5321604034467  # 35.7% (35.7%)
-- ucode             347864243144   #     2.3%
-- fastpath          4973739791323  #    33.4%
frontend             4722374590428  # 31.7% (31.7%)
-- latency           2431102189741  #    16.3%
-- bandwidth         2291272400687  #    15.4%
backend              2537383326802  # 17.0% (17.0%) low
-- cpu               823856577841   #     5.5%
-- memory            1713526748961  #    11.5%
speculation          2348952745971  # 15.8% (15.8%) high
-- branch mispredict 2281107755722  #    15.3%
-- pipeline restart  67844990249    #     0.5%
smt-contention       0              #  0.0% ( 0.0%)
cpu-cycles           11318149180050 # 1.34 GHz
instructions         14751039414741 # 1.30 IPC
l2 access            567303029759   # 47.056 l2 access per 1000 inst
l2 miss              171315192603   # 30.20% l2 miss
cpu-cycles           1925447658174  # 33.1% memory latency
load stalls          616290044520   #  6.1% l1 bound
l1 miss              498799560920   # 10.0% l2 bound
l2 miss              306974929079   #  3.5% l3 bound
l3 miss              238887483084   # 12.4% dram bound
store_stalls         21561635919    #  1.1% store bound
Process overview shows mostly C code with a small amount of C++. Largest time is in the compiler front ends. Also looks like we crashed partway so didn’t get all the process counts.
27666 processes
	1829 cc1                    742.52    44.99
	130 cc1plus                 71.07     6.72
	1859 as                      24.57     1.78
	 68 clinfo                  17.01     5.66
	10705 bash                     6.01     1.92
	263 ld                       4.91     0.92
	 38 vulkaninfo               1.14     1.13
	 14 make                     1.00     0.19
	  1 bzip2                    0.86     0.03
	  4 vulkani:disk$0           0.12     0.12
	  6 glxinfo:gdrv0            0.11     0.04
	  6 glxinfo:gl0              0.11     0.04
	  8 gs                       0.10     0.03
	  6 php                      0.08     0.08
	  2 llvmpipe-0               0.06     0.06
	  2 llvmpipe-1               0.06     0.06
	  2 llvmpipe-10              0.06     0.06
	  2 llvmpipe-11              0.06     0.06
	  2 llvmpipe-12              0.06     0.06
	  2 llvmpipe-13              0.06     0.06
	  2 llvmpipe-14              0.06     0.06
	  2 llvmpipe-15              0.06     0.06
	  2 llvmpipe-2               0.06     0.06
	  2 llvmpipe-3               0.06     0.06
	  2 llvmpipe-4               0.06     0.06
	  2 llvmpipe-5               0.06     0.06
	  2 llvmpipe-6               0.06     0.06
	  2 llvmpipe-7               0.06     0.06
	  2 llvmpipe-8               0.06     0.06
	  2 llvmpipe-9               0.06     0.06
	  2 glxinfo                  0.06     0.02
	 11 ar                       0.05     0.40
	  6 clang                    0.05     0.07
	  2 glxinfo:cs0              0.05     0.02
	  2 glxinfo:disk$0           0.05     0.02
	  2 glxinfo:sh0              0.05     0.02
	  2 glxinfo:shlo0            0.05     0.02
	  3 rocminfo                 0.03     0.00
	  1 tar                      0.01     0.16
	 48 gawk                     0.01     0.00
	  6 print                    0.01     0.00
	  9 ranlib                   0.00     0.43
	2122 rm                       0.00     0.11
	1588 cat                      0.00     0.05
	  1 lspci                    0.00     0.03
	  1 ps                       0.00     0.01
	2853 sed                      0.00     0.00
	1909 gcc                      0.00     0.00
	1731 mv                       0.00     0.00
	485 dirname                  0.00     0.00
	286 grep                     0.00     0.00
	256 collect2                 0.00     0.00
	147 g++                      0.00     0.00
	122 mkdir                    0.00     0.00
	 95 sh                       0.00     0.00
	 61 expr                     0.00     0.00
	 45 chmod                    0.00     0.00
	 37 ln                       0.00     0.00
	 35 sort                     0.00     0.00
	 33 pkg-config               0.00     0.00
	 30 conftest                 0.00     0.00
	 23 tr                       0.00     0.00
	 16 configure                0.00     0.00
	 12 uname                    0.00     0.00
	  8 cp                       0.00     0.00
	  8 gsettings                0.00     0.00
	  8 stat                     0.00     0.00
	  8 systemd-detect-          0.00     0.00
	  7 rmdir                    0.00     0.00
	  6 basename                 0.00     0.00
	  6 llvm-link                0.00     0.00
	  5 awk                      0.00     0.00
	  5 gmain                    0.00     0.00
	  5 nm                       0.00     0.00
	  5 phoronix-test-s          0.00     0.00
	  4 cc                       0.00     0.00
	  4 hostname                 0.00     0.00
	  3 dconf worker             0.00     0.00
	  3 diff                     0.00     0.00
	  3 ls                       0.00     0.00
	  3 mktemp                   0.00     0.00
	  3 time-compile-im          0.00     0.00
	  2 arch                     0.00     0.00
	  2 date                     0.00     0.00
	  2 echo                     0.00     0.00
	  2 lscpu                    0.00     0.00
	  2 which                    0.00     0.00
	  2 xset                     0.00     0.00
	  1 cmp                      0.00     0.00
	  1 cut                      0.00     0.00
	  1 dmesg                    0.00     0.00
	  1 dmidecode                0.00     0.00
	  1 file                     0.00     0.00
	  1 getconf                  0.00     0.00
	  1 ifconfig                 0.00     0.00
	  1 install                  0.00     0.00
	  1 ip                       0.00     0.00
	  1 lsmod                    0.00     0.00
	  1 mt                       0.00     0.00
	  1 objdump                  0.00     0.00
	  1 qdbus                    0.00     0.00
	  1 readlink                 0.00     0.00
	  1 realpath                 0.00     0.00
	  1 sleep                    0.00     0.00
	  1 strip                    0.00     0.00
	  1 stty                     0.00     0.00
	  1 systemctl                0.00     0.00
	  1 template.sh              0.00     0.00
	  1 touch                    0.00     0.00
	  1 true                     0.00     0.00
	  1 uniq                     0.00     0.00
	  1 wc                       0.00     0.00
	  1 xml2-config              0.00     0.00
	  1 xrandr                   0.00     0.00
254 processes running
351 maximum processes