
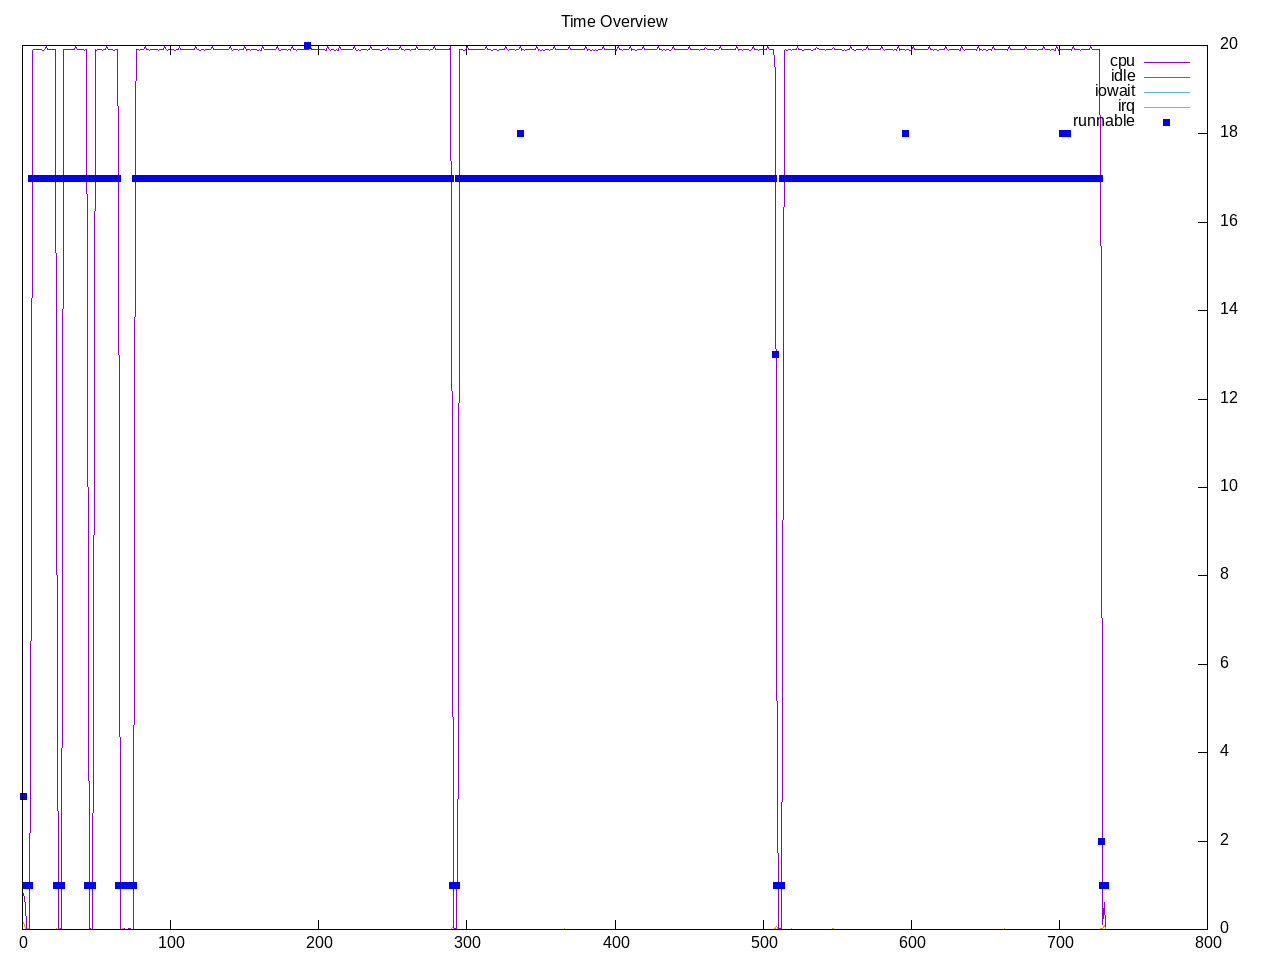
Generating prime numbers using a sieve of Eratosthenes implementation. There are two tests with the 1e12 running in ~20 seconds and the 1e13 running in ~140 seconds. This runs almost continuously on all cores.
Topdown profile shows some backend stalls but overall a moderate retirement rate and not as many frontend stalls.
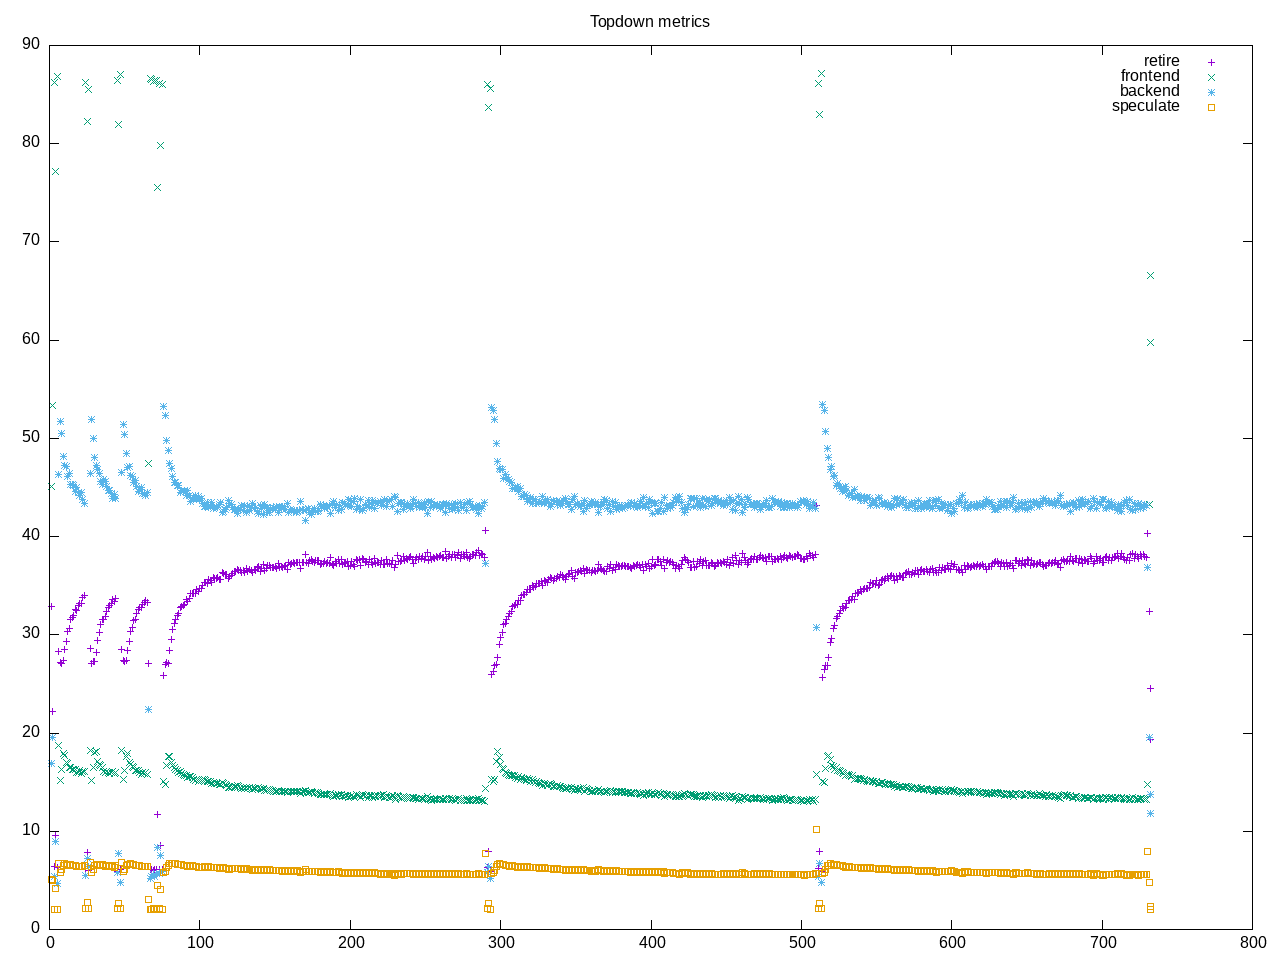
AMD metrics show floating point code and high amount of L2 access but not many L2 misses.
elapsed              730.330
on_cpu               0.951          # 15.22 / 16 cores
utime                11103.872
stime                11.206
nvcsw                2644           # 2.39%
nivcsw               107828         # 97.61%
inblock              2320           # 3.18/sec
onblock              12712          # 17.41/sec
cpu-clock            11116198275008 # 11116.198 seconds
task-clock           11116292624354 # 11116.293 seconds
page faults          3680743        # 331.112/sec
context switches     113946         # 10.250/sec
cpu migrations       345            # 0.031/sec
major page faults    2              # 0.000/sec
minor page faults    3680741        # 331.112/sec
alignment faults     0              # 0.000/sec
emulation faults     0              # 0.000/sec
branches             6467736098155  # 121.405 branches per 1000 inst
branch misses        294969256552   # 4.56% branch miss
conditional          6085289151533  # 114.226 conditional branches per 1000 inst
indirect             192854270631   # 3.620 indirect branches per 1000 inst
cpu-cycles           41078877047663 # 3.48 GHz
instructions         53292434507748 # 1.30 IPC
slots                82146024099060 #
retiring             19963907311493 # 24.3% (36.0%)
-- ucode             113680648      #     0.0%
-- fastpath          19963793630845 #    24.3%
frontend             7928985516467  #  9.7% (14.3%)
-- latency           5791287028344  #     7.0%
-- bandwidth         2137698488123  #     2.6%
backend              24231602760213 # 29.5% (43.7%)
-- cpu               3875531411835  #     4.7%
-- memory            20356071348378 #    24.8%
speculation          3299885239007  #  4.0% ( 6.0%)
-- branch mispredict 3215528826507  #     3.9%
-- pipeline restart  84356412500    #     0.1%
smt-contention       26721582492463 # 32.5% ( 0.0%)
cpu-cycles           41078257306170 # 3.48 GHz
instructions         53280411545354 # 1.30 IPC
instructions         17760253441937 # 236.184 l2 access per 1000 inst
l2 hit from l1       2541215747844  # 2.26% l2 miss
l2 miss from l1      21608662125    #
l2 hit from l2 pf    1580442451810  #
l3 hit from l2 pf    55955821749    #
l3 miss from l2 pf   17075963566    #
instructions         17754714307026 # 121.509 float per 1000 inst
float 512            60             # 0.000 AVX-512 per 1000 inst
float 256            388            # 0.000 AVX-256 per 1000 inst
float 128            2157353809593  # 121.509 AVX-128 per 1000 inst
float MMX            0              # 0.000 MMX per 1000 inst
float scalar         0              # 0.000 scalar per 1000 inst
instructions         2662617        #
opcache              992622         # 372.799 opcache per 1000 inst
opcache miss         532809         # 53.7% opcache miss rate
l1 dTLB miss         5747           # 2.158 L1 dTLB per 1000 inst
l2 dTLB miss         1222           # 0.459 L2 dTLB per 1000 inst
instructions         2694295        #
icache               1310298        # 486.323 icache per 1000 inst
icache miss          112841         #  8.6% icache miss rate
l1 iTLB miss         19             # 0.007 L1 iTLB per 1000 inst
l2 iTLB miss         0              # 0.000 L2 iTLB per 1000 inst
tlb flush            20             # 0.007 TLB flush per 1000 inst
Intel metrics confirm this mostly fits in L2.
elapsed              1734.703
on_cpu               0.954          # 15.27 / 16 cores
utime                26481.930
stime                8.946
nvcsw                4448           # 1.94%
nivcsw               224452         # 98.06%
inblock              232192         # 133.85/sec
onblock              1672           # 0.96/sec
cpu-clock            26492114005862 # 26492.114 seconds
task-clock           26492213728024 # 26492.214 seconds
page faults          4176737        # 157.659/sec
context switches     237392         # 8.961/sec
cpu migrations       720            # 0.027/sec
major page faults    1185           # 0.045/sec
minor page faults    4175552        # 157.614/sec
alignment faults     0              # 0.000/sec
emulation faults     0              # 0.000/sec
branches             7993213284230  # 125.831 branches per 1000 inst
branch misses        317680959033   # 3.97% branch miss
conditional          7993213304070  # 125.831 conditional branches per 1000 inst
indirect             957180953650   # 15.068 indirect branches per 1000 inst
slots                101458979008178 #
retiring             38305050542440 # 37.8% (37.8%)
-- ucode             15622965302918 #    15.4%
-- fastpath          22682085239522 #    22.4%
frontend             15044634792875 # 14.8% (14.8%)
-- latency           9756766671882  #     9.6%
-- bandwidth         5287868120993  #     5.2%
backend              36285486754358 # 35.8% (35.8%)
-- cpu               19056232806245 #    18.8%
-- memory            17229253948113 #    17.0%
speculation          12508840876154 # 12.3% (12.3%) high
-- branch mispredict 12503313301386 #    12.3%
-- pipeline restart  5527574768     #     0.0%
smt-contention       0              #  0.0% ( 0.0%)
cpu-cycles           58413973424562 # 2.63 GHz
instructions         66873400693973 # 1.14 IPC
l2 access            4534993088315  # 117.338 l2 access per 1000 inst
l2 miss              124937358537   # 2.75% l2 miss
cpu-cycles           42799687469272 # 32.2% memory latency
load stalls          12514227325963 #  0.0% l1 bound
l1 miss              24697721254255 # 57.1% l2 bound
l2 miss              245017596355   #  0.4% l3 bound
l3 miss              85590861371    #  0.2% dram bound
store_stalls         1285007532453  #  3.0% store bound
Process overview shows one primesieve process taking most of the time.
458 processes
	102 primesieve           188624.58   174.53
	 68 clinfo                  16.53     6.32
	 38 vulkaninfo               1.15     0.96
	  4 vulkani:disk$0           0.13     0.11
	  6 glxinfo:gdrv0            0.13     0.06
	  6 glxinfo:gl0              0.13     0.06
	  6 php                      0.08     0.15
	  2 llvmpipe-0               0.07     0.06
	  2 llvmpipe-1               0.07     0.06
	  2 llvmpipe-2               0.07     0.06
	  2 llvmpipe-3               0.07     0.06
	  2 glxinfo                  0.07     0.02
	  2 glxinfo:cs0              0.07     0.02
	  2 glxinfo:disk$0           0.07     0.02
	  2 glxinfo:sh0              0.07     0.02
	  2 glxinfo:shlo0            0.07     0.02
	  6 clang                    0.06     0.06
	  2 llvmpipe-10              0.06     0.05
	  2 llvmpipe-11              0.06     0.05
	  2 llvmpipe-12              0.06     0.05
	  2 llvmpipe-13              0.06     0.05
	  2 llvmpipe-14              0.06     0.05
	  2 llvmpipe-15              0.06     0.05
	  2 llvmpipe-4               0.06     0.05
	  2 llvmpipe-5               0.06     0.05
	  2 llvmpipe-6               0.06     0.05
	  2 llvmpipe-7               0.06     0.05
	  2 llvmpipe-8               0.06     0.05
	  2 llvmpipe-9               0.06     0.05
	  3 rocminfo                 0.03     0.00
	  1 lspci                    0.00     0.02
	  1 ps                       0.00     0.01
	 84 sh                       0.00     0.00
	 13 gcc                      0.00     0.00
	 10 gsettings                0.00     0.00
	  8 stat                     0.00     0.00
	  8 systemd-detect-          0.00     0.00
	  6 llvm-link                0.00     0.00
	  6 primesieve-test          0.00     0.00
	  5 phoronix-test-s          0.00     0.00
	  4 gmain                    0.00     0.00
	  2 cc                       0.00     0.00
	  2 dconf worker             0.00     0.00
	  2 lscpu                    0.00     0.00
	  2 uname                    0.00     0.00
	  2 which                    0.00     0.00
	  2 xset                     0.00     0.00
	  1 date                     0.00     0.00
	  1 dirname                  0.00     0.00
	  1 dmesg                    0.00     0.00
	  1 dmidecode                0.00     0.00
	  1 grep                     0.00     0.00
	  1 ifconfig                 0.00     0.00
	  1 ip                       0.00     0.00
	  1 lsmod                    0.00     0.00
	  1 mktemp                   0.00     0.00
	  1 qdbus                    0.00     0.00
	  1 readlink                 0.00     0.00
	  1 realpath                 0.00     0.00
	  1 sed                      0.00     0.00
	  1 sort                     0.00     0.00
	  1 stty                     0.00     0.00
	  1 systemctl                0.00     0.00
	  1 template.sh              0.00     0.00
	  1 wc                       0.00     0.00
	  1 xrandr                   0.00     0.00
0 processes running
47 maximum processes
Computation structure is straightforward.
      405387) primesieve-test  cpu=4 start=6.71  finish=23.67
        405388) primesieve       cpu=0 start=6.71  finish=23.67
          405389) primesieve       cpu=6 start=6.71  finish=23.60
          405390) primesieve       cpu=1 start=6.71  finish=23.59
          405391) primesieve       cpu=15 start=6.71  finish=23.60
          405392) primesieve       cpu=8 start=6.71  finish=23.57
          405393) primesieve       cpu=9 start=6.71  finish=23.57
          405394) primesieve       cpu=3 start=6.71  finish=23.57
          405395) primesieve       cpu=4 start=6.72  finish=23.62
          405396) primesieve       cpu=0 start=6.72  finish=23.58
          405397) primesieve       cpu=11 start=6.72  finish=23.67
          405398) primesieve       cpu=10 start=6.72  finish=23.64
          405399) primesieve       cpu=1 start=6.72  finish=23.65
          405400) primesieve       cpu=7 start=6.72  finish=23.63
          405401) primesieve       cpu=11 start=6.72  finish=23.57
          405402) primesieve       cpu=14 start=6.72  finish=23.60
          405403) primesieve       cpu=12 start=6.72  finish=23.62
          405404) primesieve       cpu=13 start=6.72  finish=23.67