
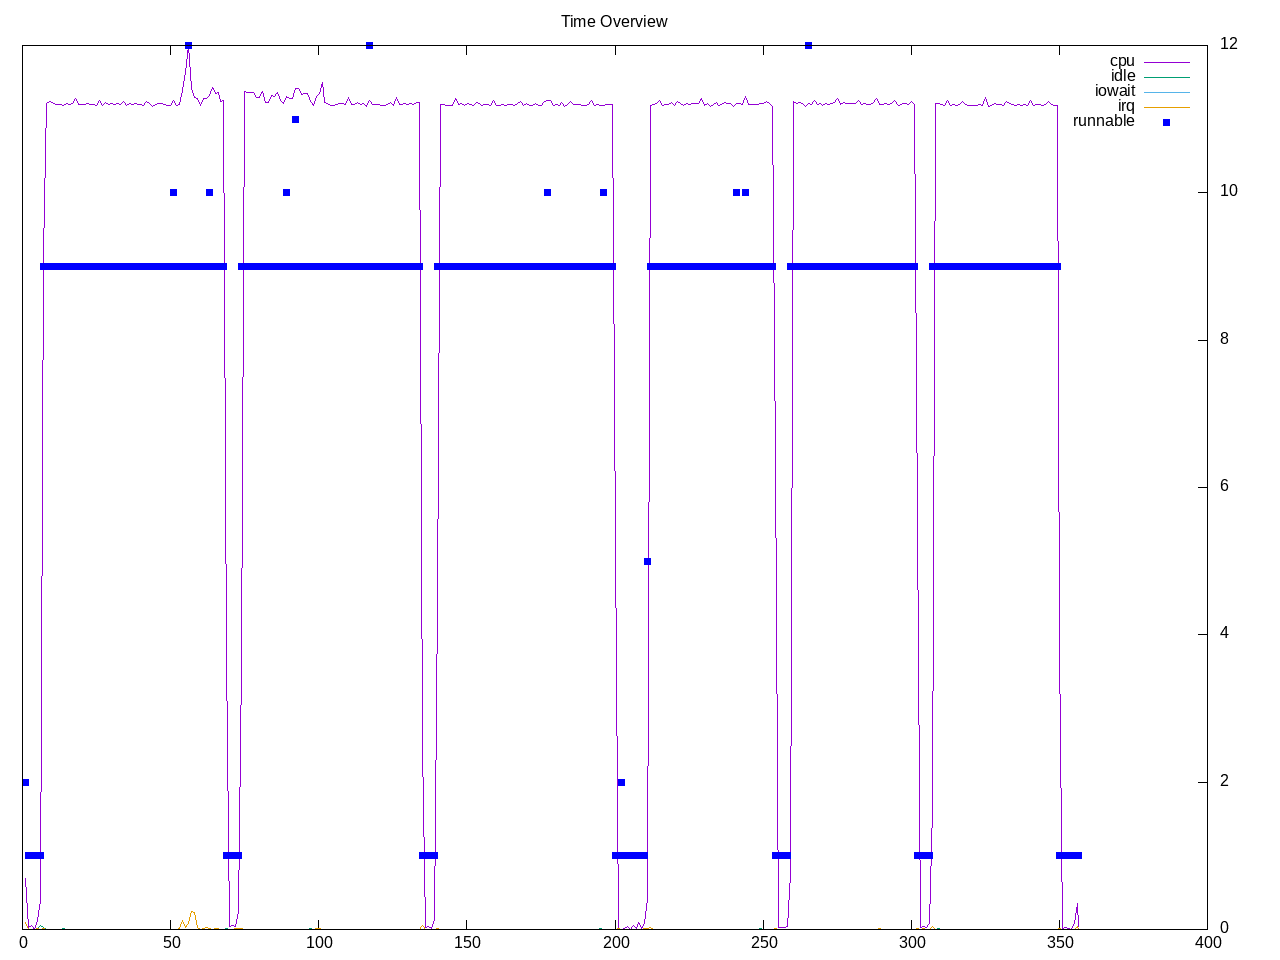
Hydrodynamics on unstructured meshes. There are two workloads. Overall, half the threads are kept busy.
Topdown profile shows backend stalls dominating wit h low frontend stalls.
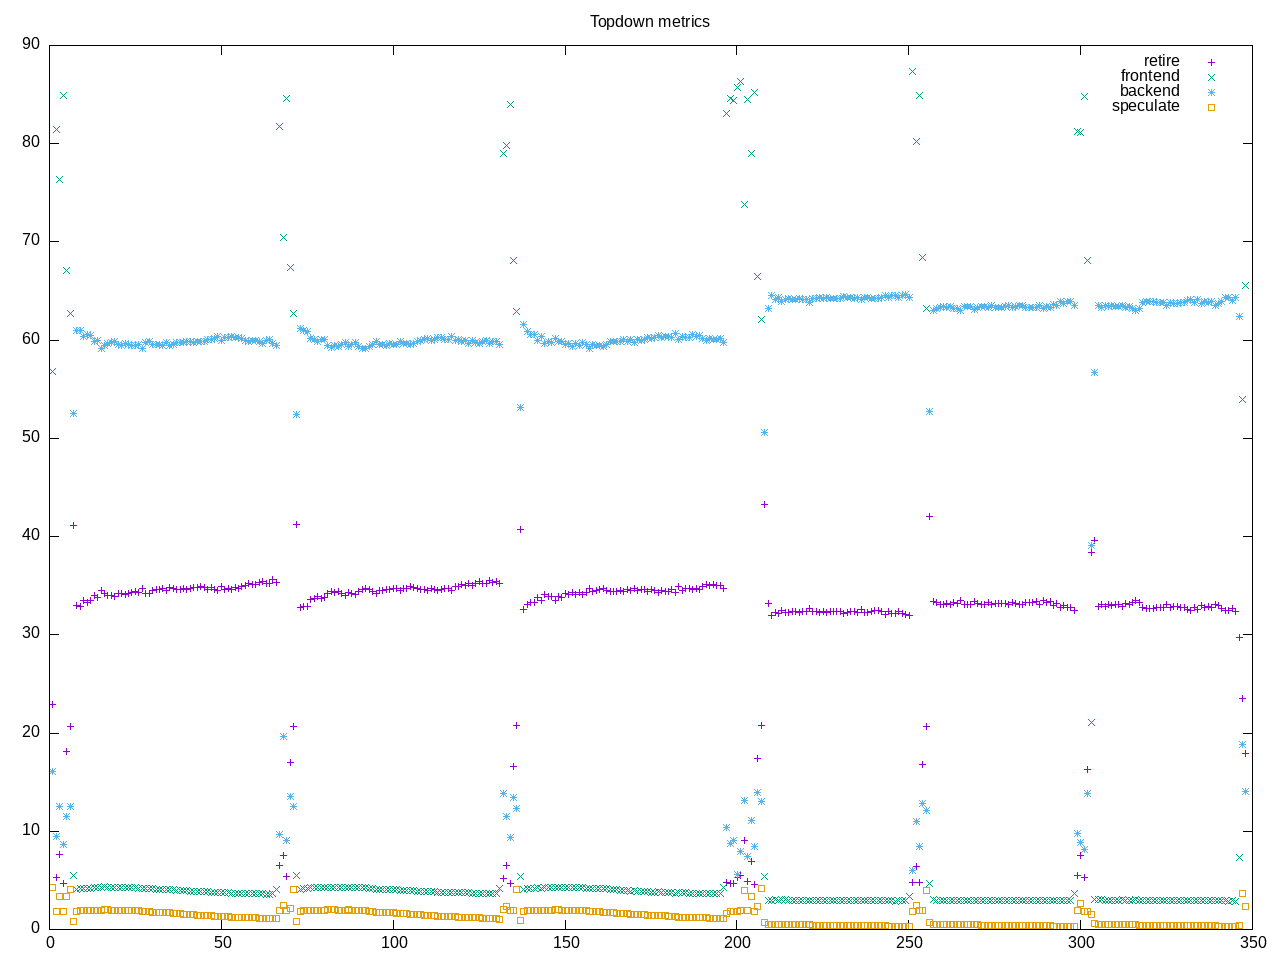
AMD metrics show floating point code. Backend stalls are balanced between memory and CPU. Frontend stalls are low.
elapsed              348.985
on_cpu               0.440          # 7.03 / 16 cores
utime                2447.057
stime                7.693
nvcsw                64303          # 90.24%
nivcsw               6956           # 9.76%
inblock              0              # 0.00/sec
onblock              100816         # 288.88/sec
cpu-clock            2454839428334  # 2454.839 seconds
task-clock           2454864590772  # 2454.865 seconds
page faults          585693         # 238.585/sec
context switches     72808          # 29.659/sec
cpu migrations       4729           # 1.926/sec
major page faults    510            # 0.208/sec
minor page faults    585183         # 238.377/sec
alignment faults     0              # 0.000/sec
emulation faults     0              # 0.000/sec
branches             1405170392315  # 66.567 branches per 1000 inst
branch misses        2889441026     # 0.21% branch miss
conditional          1268663493424  # 60.100 conditional branches per 1000 inst
indirect             23984196334    # 1.136 indirect branches per 1000 inst
cpu-cycles           10932622319963 # 1.92 GHz
instructions         21196256443065 # 1.94 IPC
slots                21869456447430 #
retiring             7385737678440  # 33.8% (33.8%)
-- ucode             1290957661     #     0.0%
-- fastpath          7384446720779  #    33.8%
frontend             805383992505   #  3.7% ( 3.7%) low
-- latency           491365910592   #     2.2%
-- bandwidth         314018081913   #     1.4%
backend              13420593631108 # 61.4% (61.4%)
-- cpu               6892842816665  #    31.5%
-- memory            6527750814443  #    29.8%
speculation          240024275753   #  1.1% ( 1.1%)
-- branch mispredict 109870243527   #     0.5%
-- pipeline restart  130154032226   #     0.6%
smt-contention       17709448967    #  0.1% ( 0.0%)
cpu-cycles           10923049238973 # 1.96 GHz
instructions         21070010698041 # 1.93 IPC
instructions         7025290484683  # 27.155 l2 access per 1000 inst
l2 hit from l1       152693226788   # 17.98% l2 miss
l2 miss from l1      8245427283     #
l2 hit from l2 pf    12025097090    #
l3 hit from l2 pf    1003945621     #
l3 miss from l2 pf   25051373796    #
instructions         7021052031386  # 331.768 float per 1000 inst
float 512            93             # 0.000 AVX-512 per 1000 inst
float 256            888            # 0.000 AVX-256 per 1000 inst
float 128            2329362650245  # 331.768 AVX-128 per 1000 inst
float MMX            0              # 0.000 MMX per 1000 inst
float scalar         0              # 0.000 scalar per 1000 inst
instructions         2384561        #
opcache              896903         # 376.129 opcache per 1000 inst
opcache miss         477070         # 53.2% opcache miss rate
l1 dTLB miss         4104           # 1.721 L1 dTLB per 1000 inst
l2 dTLB miss         973            # 0.408 L2 dTLB per 1000 inst
instructions         2422756        #
icache               1198318        # 494.609 icache per 1000 inst
icache miss          112292         #  9.4% icache miss rate
l1 iTLB miss         8              # 0.003 L1 iTLB per 1000 inst
l2 iTLB miss         0              # 0.000 L2 iTLB per 1000 inst
tlb flush            19             # 0.008 TLB flush per 1000 inst
Intel metrics
elapsed              2939.717
on_cpu               0.733          # 11.73 / 16 cores
utime                34465.043
stime                14.981
nvcsw                179750         # 80.58%
nivcsw               43316          # 19.42%
inblock              22208          # 7.55/sec
onblock              185160         # 62.99/sec
cpu-clock            34480504457611 # 34480.504 seconds
task-clock           34480558245085 # 34480.558 seconds
page faults          1314803        # 38.132/sec
context switches     237469         # 6.887/sec
cpu migrations       34346          # 0.996/sec
major page faults    1445           # 0.042/sec
minor page faults    1313358        # 38.090/sec
alignment faults     0              # 0.000/sec
emulation faults     0              # 0.000/sec
branches             44244560364890 # 165.908 branches per 1000 inst
branch misses        113417834935   # 0.26% branch miss
conditional          44244560391034 # 165.908 conditional branches per 1000 inst
indirect             14350734555496 # 53.812 indirect branches per 1000 inst
slots                258818070782372 #
retiring             165943745858655 # 64.1% (64.1%) high
-- ucode             11698884463456 #     4.5%
-- fastpath          154244861395199 #    59.6%
frontend             22228896025978 #  8.6% ( 8.6%)
-- latency           8941122571912  #     3.5%
-- bandwidth         13287773454066 #     5.1%
backend              57414286431989 # 22.2% (22.2%)
-- cpu               40082922132210 #    15.5%
-- memory            17331364299779 #     6.7%
speculation          11415921070534 #  4.4% ( 4.4%)
-- branch mispredict 7032646758570  #     2.7%
-- pipeline restart  4383274311964  #     1.7%
smt-contention       0              #  0.0% ( 0.0%)
cpu-cycles           96461605636760 # 1.97 GHz
instructions         388850975926936 # 4.03 IPC high
l2 access            351070041147   # 2.360 l2 access per 1000 inst
l2 miss              138857980889   # 39.55% l2 miss
cpu-cycles           37072612143813 #  7.2% memory latency
load stalls          2501412244162  #  2.1% l1 bound
l1 miss              1724915419158  #  1.9% l2 bound
l2 miss              1037045631873  #  0.9% l3 bound
l3 miss              705376648870   #  1.9% dram bound
store_stalls         158962328723   #  0.4% store bound
Process summary shows the pennant process driving the majority of the time.
428 processes
	150 pennant               7307.63    17.49
	 38 vulkaninfo               1.33     1.14
	 24 mpirun                   0.52     2.76
	  4 vulkani:disk$0           0.14     0.12
	  6 glxinfo:gdrv0            0.14     0.09
	  6 glxinfo:gl0              0.13     0.09
	  6 php                      0.07     0.15
	  2 llvmpipe-0               0.07     0.06
	  2 llvmpipe-1               0.07     0.06
	  2 llvmpipe-10              0.07     0.06
	  2 llvmpipe-11              0.07     0.06
	  2 llvmpipe-12              0.07     0.06
	  2 llvmpipe-13              0.07     0.06
	  2 llvmpipe-14              0.07     0.06
	  2 llvmpipe-15              0.07     0.06
	  2 llvmpipe-2               0.07     0.06
	  2 llvmpipe-3               0.07     0.06
	  2 llvmpipe-4               0.07     0.06
	  2 llvmpipe-5               0.07     0.06
	  2 llvmpipe-6               0.07     0.06
	  2 llvmpipe-7               0.07     0.06
	  2 llvmpipe-8               0.07     0.06
	  2 llvmpipe-9               0.07     0.06
	  2 glxinfo                  0.07     0.03
	  2 glxinfo:cs0              0.07     0.03
	  2 glxinfo:disk$0           0.07     0.03
	  2 glxinfo:sh0              0.07     0.03
	  2 glxinfo:shlo0            0.07     0.03
	  1 lspci                    0.02     0.01
	 70 sh                       0.00     0.00
	 13 gcc                      0.00     0.00
	  8 gsettings                0.00     0.00
	  8 stat                     0.00     0.00
	  8 systemd-detect-          0.00     0.00
	  5 gmain                    0.00     0.00
	  5 phoronix-test-s          0.00     0.00
	  3 dconf worker             0.00     0.00
	  2 cc                       0.00     0.00
	  2 clinfo                   0.00     0.00
	  2 lscpu                    0.00     0.00
	  2 uname                    0.00     0.00
	  2 which                    0.00     0.00
	  2 xset                     0.00     0.00
	  1 date                     0.00     0.00
	  1 dirname                  0.00     0.00
	  1 dmesg                    0.00     0.00
	  1 dmidecode                0.00     0.00
	  1 grep                     0.00     0.00
	  1 ifconfig                 0.00     0.00
	  1 ip                       0.00     0.00
	  1 lsmod                    0.00     0.00
	  1 mktemp                   0.00     0.00
	  1 ps                       0.00     0.00
	  1 readlink                 0.00     0.00
	  1 realpath                 0.00     0.00
	  1 sed                      0.00     0.00
	  1 sort                     0.00     0.00
	  1 stty                     0.00     0.00
	  1 systemctl                0.00     0.00
	  1 template.sh              0.00     0.00
	  1 wc                       0.00     0.00
	  1 xrandr                   0.00     0.00
0 processes running
47 maximum processes
Process structure shows MPI being used to distribute pennant processes.
      124349) pennant          cpu=0 start=4.89  finish=65.66
        124350) mpirun           cpu=3 start=4.89  finish=65.66
          124352) mpirun           cpu=15 start=5.43  finish=65.65
          124353) mpirun           cpu=7 start=5.92  finish=65.65
          124354) mpirun           cpu=11 start=5.92  finish=65.66
          124355) pennant          cpu=11 start=5.95  finish=65.65
            124357) pennant          cpu=15 start=5.96  finish=65.64
            124361) pennant          cpu=1 start=5.96  finish=65.64
          124356) pennant          cpu=2 start=5.96  finish=65.65
            124360) pennant          cpu=11 start=5.96  finish=65.64
            124364) pennant          cpu=6 start=5.97  finish=65.64
          124358) pennant          cpu=5 start=5.96  finish=65.65
            124362) pennant          cpu=15 start=5.97  finish=65.64
            124367) pennant          cpu=8 start=5.97  finish=65.64
          124359) pennant          cpu=12 start=5.96  finish=65.65
            124366) pennant          cpu=15 start=5.97  finish=65.64
            124370) pennant          cpu=4 start=5.97  finish=65.64
          124363) pennant          cpu=14 start=5.97  finish=65.64
            124369) pennant          cpu=4 start=5.97  finish=65.64
            124373) pennant          cpu=3 start=5.98  finish=65.64
          124365) pennant          cpu=10 start=5.97  finish=65.65
            124372) pennant          cpu=7 start=5.98  finish=65.64
            124375) pennant          cpu=11 start=5.98  finish=65.64
          124368) pennant          cpu=9 start=5.97  finish=65.64
            124374) pennant          cpu=15 start=5.98  finish=65.64
            124377) pennant          cpu=15 start=5.99  finish=65.64
          124371) pennant          cpu=0 start=5.98  finish=65.64
            124376) pennant          cpu=1 start=5.98  finish=65.64
            124378) pennant          cpu=13 start=5.99  finish=65.64