
A benchmark of the Apache Spark using the PySpark interface. Apache Spark is an open-source unified analytics engine. There are four tests each with different sub-scenarios.

Topdown profile shows a high retirement rate with some backend stalls.
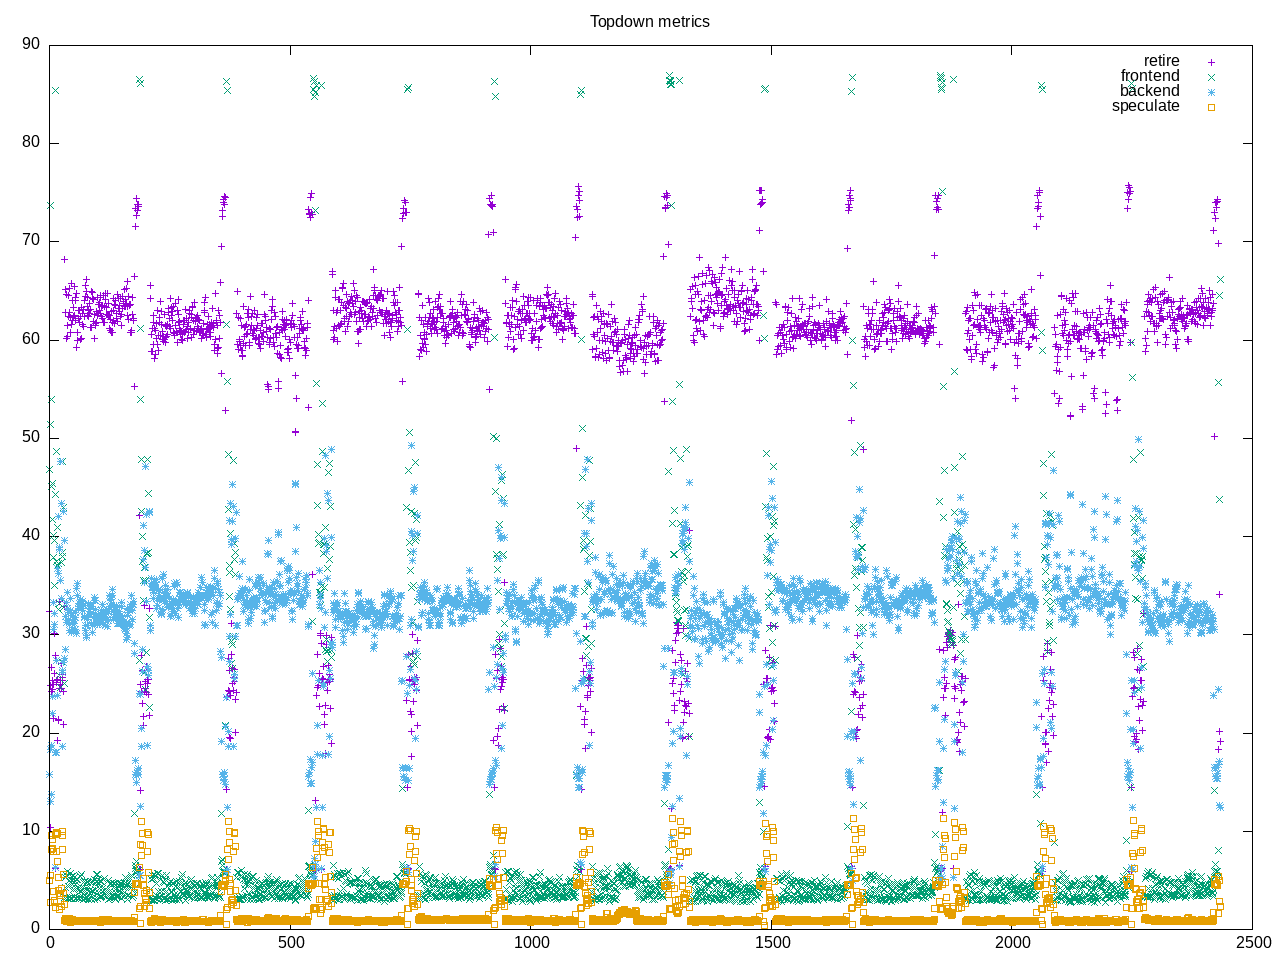
AMD metrics show overall 1.6 cores active, little floating point and high retirement.
elapsed              2951.391
on_cpu               0.101          # 1.61 / 16 cores
utime                4425.534
stime                328.609
nvcsw                4856288        # 86.78%
nivcsw               739739         # 13.22%
inblock              8              # 0.00/sec
onblock              13977128       # 4735.78/sec
cpu-clock            42663814969283 # 42663.815 seconds
task-clock           42665967867809 # 42665.968 seconds
page faults          44053031       # 1032.510/sec
context switches     6717843        # 157.452/sec
cpu migrations       931799         # 21.839/sec
major page faults    1186           # 0.028/sec
minor page faults    44006031       # 1031.408/sec
alignment faults     0              # 0.000/sec
emulation faults     0              # 0.000/sec
branches             64285744518706 # 177.115 branches per 1000 inst
branch misses        116204596704   # 0.18% branch miss
conditional          50330874718377 # 138.668 conditional branches per 1000 inst
indirect             5391625116869  # 14.855 indirect branches per 1000 inst
cpu-cycles           219995811005385 # 3.55 GHz
instructions         474805279426321 # 2.16 IPC
slots                441582327330810 #
retiring             157423348696856 # 35.6% (58.5%) high
-- ucode             567875726893   #     0.1%
-- fastpath          156855472969963 #    35.5%
frontend             19549579490013 #  4.4% ( 7.3%)
-- latency           13520739667860 #     3.1%
-- bandwidth         6028839822153  #     1.4%
backend              88382195394937 # 20.0% (32.8%)
-- cpu               11254725399387 #     2.5%
-- memory            77127469995550 #    17.5%
speculation          3802926667430  #  0.9% ( 1.4%)
-- branch mispredict 2933296078179  #     0.7%
-- pipeline restart  869630589251   #     0.2%
smt-contention       172423207228753 # 39.0% ( 0.0%)
cpu-cycles           218890360802921 # 3.54 GHz
instructions         474914641892602 # 2.17 IPC
instructions         158472945209461 # 13.127 l2 access per 1000 inst
l2 hit from l1       2033359144055  # 3.50% l2 miss
l2 miss from l1      46451580342    #
l2 hit from l2 pf    20499319858    #
l3 hit from l2 pf    12301929165    #
l3 miss from l2 pf   14068223396    #
instructions         158458706917338 # 19.971 float per 1000 inst
float 512            3950           # 0.000 AVX-512 per 1000 inst
float 256            503524         # 0.000 AVX-256 per 1000 inst
float 128            3164589063781  # 19.971 AVX-128 per 1000 inst
float MMX            0              # 0.000 MMX per 1000 inst
float scalar         37917          # 0.000 scalar per 1000 inst
instructions         2709961        #
opcache              1001966        # 369.734 opcache per 1000 inst
opcache miss         534211         # 53.3% opcache miss rate
l1 dTLB miss         7266           # 2.681 L1 dTLB per 1000 inst
l2 dTLB miss         1171           # 0.432 L2 dTLB per 1000 inst
instructions         2703521        #
icache               1299232        # 480.570 icache per 1000 inst
icache miss          111019         #  8.5% icache miss rate
l1 iTLB miss         13             # 0.005 L1 iTLB per 1000 inst
l2 iTLB miss         0              # 0.000 L2 iTLB per 1000 inst
tlb flush            19             # 0.007 TLB flush per 1000 inst
Intel metrics
elapsed              16920.126
on_cpu               0.261          # 4.17 / 16 cores
utime                68536.052
stime                2033.421
nvcsw                20512849       # 60.38%
nivcsw               13458961       # 39.62%
inblock              348193440      # 20578.66/sec
onblock              533099000      # 31506.80/sec
cpu-clock            242347906374008 # 242347.906 seconds
task-clock           242358478400143 # 242358.478 seconds
page faults          351178559      # 1449.005/sec
context switches     47074935       # 194.237/sec
cpu migrations       5096975        # 21.031/sec
major page faults    29159          # 0.120/sec
minor page faults    350541678      # 1446.377/sec
alignment faults     0              # 0.000/sec
emulation faults     0              # 0.000/sec
branches             278766653515579 # 177.353 branches per 1000 inst
branch misses        798092266132   # 0.29% branch miss
conditional          278766666338011 # 177.353 conditional branches per 1000 ins
t
indirect             62205170112713 # 39.575 indirect branches per 1000 inst
slots                1007749798569482 #
retiring             554744105785745 # 55.0% (55.0%) high
-- ucode             31026419537826 #     3.1%
-- fastpath          523717686247919 #    52.0%
frontend             291111717445577 # 28.9% (28.9%)
-- latency           100773439754211 #    10.0%
-- bandwidth         190338277691366 #    18.9%
backend              123976744622939 # 12.3% (12.3%) low
-- cpu               39235397453279 #     3.9%
-- memory            84741347169660 #     8.4%
speculation          38960763394989 #  3.9% ( 3.9%)
-- branch mispredict 35041534228150 #     3.5%
-- pipeline restart  3919229166839  #     0.4%
smt-contention       0              #  0.0% ( 0.0%)
cpu-cycles           481594355727426 # 1.78 GHz
instructions         915628982456618 # 1.90 IPC
l2 access            6943696813220  # 10.398 l2 access per 1000 inst
l2 miss              1685572410210  # 24.27% l2 miss
cpu-cycles           364846275080470 # 25.2% memory latency
load stalls          90138769389868 # 13.4% l1 bound
l1 miss              41084570173389 #  3.7% l2 bound
l2 miss              27487531859349 #  1.6% l3 bound
l3 miss              21589200763974 #  5.9% dram bound
store_stalls         1939852578337  #  0.5% store bound
Process overview includes many processes and a Java set of threads with names by thread, only first part shown here.
114616 processes
	640 dispatcher-even      76964.32  3834.19
	741 block-manager-s      66938.04  6289.06
	494 block-manager-a      44631.10  4193.59
	1994 python3              42767.48  1275.63
	320 shuffle-client-      38489.52  1920.40
	320 shuffle-server-      38489.52  1920.40
	320 map-output-disp      38464.08  1912.89
	160 task-result-get      19229.00   955.73
	162 QueryStageCreat      15328.79  1250.05
	120 spark-listener-      14421.84   716.89
	162 java                  9638.24   483.08
	 80 dispatcher-Bloc       9619.42   479.07
	 81 Finalizer             4819.24   241.59
	 80 Common-Cleaner        4819.23   241.56
	 40 org.apache.hado       4811.23   240.09
	 40 rpc-boss-3-1          4811.23   240.09
	 40 shuffle-boss-6-       4811.23   240.09
	 40 rpc-server-4-1        4811.19   240.05
	 40 rpc-server-4-2        4811.18   240.05
	 40 rpc-server-4-3        4811.18   240.05
	 40 rpc-server-4-4        4811.18   240.05
	 40 rpc-server-4-5        4811.18   240.05
	 40 rpc-server-4-6        4811.18   240.05
	 40 rpc-server-4-7        4811.18   240.05
	 40 rpc-server-4-8        4811.18   240.05
	 40 rpc-client-1-1        4811.17   240.04
	 40 rpc-client-1-2        4811.17   240.04
	 40 rpc-client-1-3        4811.16   240.04
	 40 rpc-client-1-4        4811.16   240.04
	 40 rpc-client-1-5        4811.16   240.04
	 40 rpc-client-1-6        4811.16   240.04
	 40 rpc-client-1-7        4811.16   240.04
	 40 rpc-client-1-8        4811.16   240.04
	 40 Thread-0              4810.92   239.96
	 40 shutdown-hook-0       4810.73   239.88
	 40 element-trackin       4810.44   239.76
	 40 netty-rpc-env-t       4810.13   239.58
	 40 RemoteBlock-tem       4808.39   239.21
	 40 heartbeat-recei       4807.42   238.98
	 40 driver-heartbea       4807.34   238.97
	 40 task-starvation       4807.25   238.92
	 40 task-abort-time       4807.20   238.93
	 40 dag-scheduler-e       4807.03   238.90
	 40 context-cleaner       4807.01   238.90
	 40 SparkUI-57            4806.92   238.86
	 40 SparkUI-58            4806.91   238.86
	 40 SparkUI-59            4806.90   238.86
	 40 SparkUI-60            4806.89   238.85
	 40 SparkUI-61            4806.89   238.85
	 40 SparkUI-62            4806.88   238.85
	 40 SparkUI-63            4806.86   238.85
	 40 SparkUI-64            4806.85   238.85
	 40 SparkUI-65            4806.85   238.85
	 40 SparkUI-66            4806.85   238.85
	 40 executor-kill-m       4806.31   238.73
	 40 executor-heartb       4806.04   238.64
	 40 Logging-Cleaner       4805.67   238.61
	 40 Thread-2              4805.59   238.60
	 40 Thread-4              4804.58   238.53
	 36 Thread-20             4638.91   215.45
	 18 serve-DataFrame       3116.02    68.72
	 36 broadcast-excha       3052.28   295.16
	 72 checkPathsExist        391.91    32.46
	  4 Thread-19              164.64    22.95
	144 process reaper         138.68 12318.76
	  3 Thread-1526            104.07    11.51
	  3 Thread-1525            104.03    11.49
	  3 Thread-1523            103.75    11.43
	  3 Thread-1524            103.59    11.42
	  3 Thread-1519            103.58    11.41
	  3 Thread-1522            103.53    11.41
	  3 Thread-1521            103.51    11.41