
x265 benchmark with standard input and two workloads
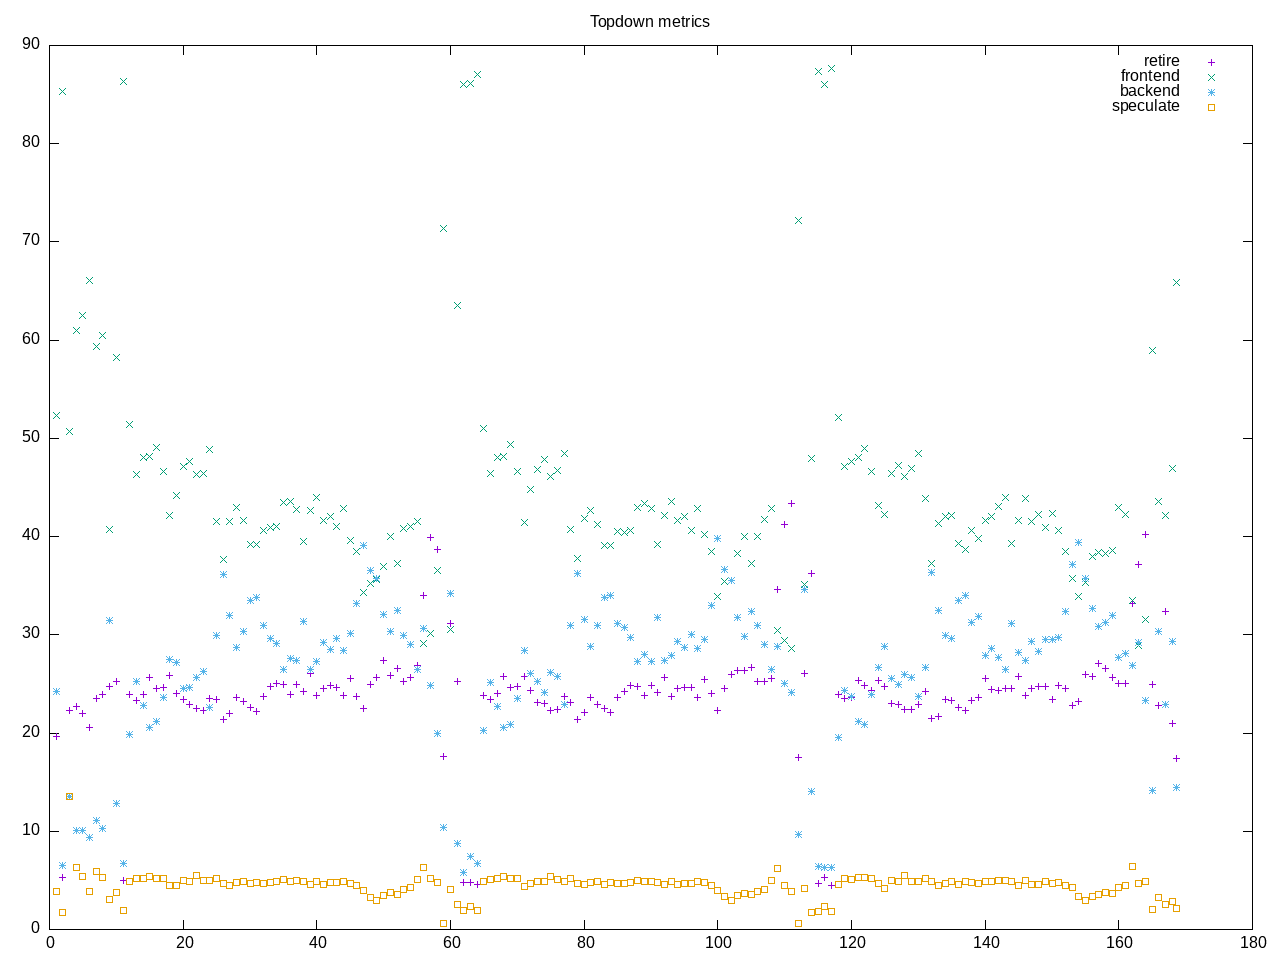
AMD metrics show a 128-bit floating point program with some L2 misses and backend memory but otherwise medium range retiring. We spend ~50% of time on the CPU so threaded but not fully threaded operation?
elapsed              713.905
on_cpu               0.502          # 8.03 / 16 cores
utime                5668.028
stime                66.483
nvcsw                2807701        # 92.74%
nivcsw               219710         # 7.26%
inblock              6170832
onblock              27632
cpu-clock            5730360170277  # 5730.360 seconds
task-clock           5731795930958  # 5731.796 seconds
page faults          6120568        # 1067.827/sec
context switches     3030769        # 528.764/sec
cpu migrations       176614         # 30.813/sec
major page faults    67             # 0.012/sec
minor page faults    6120501        # 1067.816/sec
alignment faults     0              # 0.000/sec
emulation faults     0              # 0.000/sec
branches             2298223476101  # 64.254 branches per 1000 inst
branch misses        38765597182    # 1.69% branch miss
conditional          1447123909275  # 40.459 conditional branches per 1000 inst
indirect             184907459078   # 5.170 indirect branches per 1000 inst
cpu-cycles           6226498530298  # 1.98 GHz
instructions         9678813453851  # 1.55 IPC
slots                12467027650776 #
retiring             3419335741620  # 27.4% (35.4%)
-- ucode             47510862855    #     0.4%
-- fastpath          3371824878765  #    27.0%
frontend             1352978437698  # 10.9% (14.0%)
-- latency           861177646632   #     6.9%
-- bandwidth         491800791066   #     3.9%
backend              4618690961014  # 37.0% (47.8%)
-- cpu               1412014283462  #    11.3%
-- memory            3206676677552  #    25.7%
speculation          263046398653   #  2.1% ( 2.7%)
-- branch mispredict 242439249427   #     1.9%
-- pipeline restart  20607149226    #     0.2%
smt-contention       2812859705014  # 22.6% ( 0.0%)
cpu-cycles           7936497399423  # 2.00 GHz
instructions         12283162200513 # 1.55 IPC
instructions         4099519478946  # 39.677 l2 access per 1000 inst
l2 hit from l1       134192432419   # 12.06% l2 miss
l2 miss from l1      12511817133    #
l2 hit from l2 pf    21366966534    #
l3 hit from l2 pf    3874073579     #
l3 miss from l2 pf   3222493799     #
instructions         4091045784055  # 190.915 float per 1000 inst
float 512            71             # 0.000 AVX-512 per 1000 inst
float 256            1060           # 0.000 AVX-256 per 1000 inst
float 128            781040286672   # 190.915 AVX-128 per 1000 inst
float MMX            0              # 0.000 MMX per 1000 inst
float scalar         0              # 0.000 scalar per 1000 inst
Corresponding Intel metrics shows >50% retiring rate.
elapsed              788.657
on_cpu               0.610          # 9.76 / 16 cores
utime                7603.378
stime                90.091
nvcsw                3688077        # 90.89%
nivcsw               369791         # 9.11%
inblock              31549176
onblock              26776
cpu-clock            7679288766057  # 7679.289 seconds
task-clock           7681427192071  # 7681.427 seconds
page faults          6542506        # 851.731/sec
context switches     4061655        # 528.763/sec
cpu migrations       594059         # 77.337/sec
major page faults    793            # 0.103/sec
minor page faults    6541713        # 851.627/sec
alignment faults     0              # 0.000/sec
emulation faults     0              # 0.000/sec
branches             2477806622104  # 64.408 branches per 1000 inst
branch misses        43684720181    # 1.76% branch miss
conditional          2477806644216  # 64.408 conditional branches per 1000 inst
indirect             880974334257   # 22.900 indirect branches per 1000 inst
slots                10702457016518 #
retiring             5872152202319  # 54.9% (54.9%)
-- ucode             373372570662   #     3.5%
-- fastpath          5498779631657  #    51.4%
frontend             1885584589158  # 17.6% (17.6%)
-- latency           953145946637   #     8.9%
-- bandwidth         932438642521   #     8.7%
backend              2105534559715  # 19.7% (19.7%)
-- cpu               981934933436   #     9.2%
-- memory            1123599626279  #    10.5%
speculation          939803939689   #  8.8% ( 8.8%)
-- branch mispredict 884451371813   #     8.3%
-- pipeline restart  55352567876    #     0.5%
smt-contention       0              #  0.0% ( 0.0%)
cpu-cycles           6467518831703  # 1.91 GHz
instructions         12325634319096 # 1.91 IPC
l2 access            173564026661   # 31.787 l2 access per 1000 inst
l2 miss              36974658876    # 21.30% l2 miss
No surprises from the process summary, all time spent in x265 process
434 processes
	150 x265                 36013.72   343.12
	 38 vulkaninfo               0.76     1.14
	  6 glxinfo:gdrv0            0.16     0.13
	  2 glxinfo                  0.12     0.05
	  2 glxinfo:cs0              0.12     0.05
	  2 glxinfo:disk$0           0.12     0.05
	  2 glxinfo:sh0              0.12     0.05
	  2 glxinfo:shlo0            0.12     0.05
	  4 vulkani:disk$0           0.08     0.12
	  2 llvmpipe-0               0.04     0.06
	  2 llvmpipe-1               0.04     0.06
	  2 llvmpipe-10              0.04     0.06
	  2 llvmpipe-11              0.04     0.06
	  2 llvmpipe-12              0.04     0.06
	  2 llvmpipe-13              0.04     0.06
	  2 llvmpipe-14              0.04     0.06
	  2 llvmpipe-15              0.04     0.06
	  2 llvmpipe-2               0.04     0.06
	  2 llvmpipe-3               0.04     0.06
	  2 llvmpipe-4               0.04     0.06
	  2 llvmpipe-5               0.04     0.06
	  2 llvmpipe-6               0.04     0.06
	  2 llvmpipe-7               0.04     0.06
	  2 llvmpipe-8               0.04     0.06
	  2 llvmpipe-9               0.04     0.06
	  6 php                      0.03     0.14
	  6 clang                    0.02     0.06
	  1 lspci                    0.00     0.03
	 88 sh                       0.00     0.00
	 13 gcc                      0.00     0.00
	  9 gsettings                0.00     0.00
	  9 stty                     0.00     0.00
	  8 stat                     0.00     0.00
	  8 systemd-detect-          0.00     0.00
	  6 llvm-link                0.00     0.00
	  5 phoronix-test-s          0.00     0.00
	  4 gmain                    0.00     0.00
	  3 dconf worker             0.00     0.00
	  2 cc                       0.00     0.00
	  2 lscpu                    0.00     0.00
	  2 uname                    0.00     0.00
	  2 which                    0.00     0.00
	  2 xset                     0.00     0.00
	  1 date                     0.00     0.00
	  1 dirname                  0.00     0.00
	  1 dmesg                    0.00     0.00
	  1 dmidecode                0.00     0.00
	  1 grep                     0.00     0.00
	  1 ifconfig                 0.00     0.00
	  1 ip                       0.00     0.00
	  1 lsmod                    0.00     0.00
	  1 mktemp                   0.00     0.00
	  1 ps                       0.00     0.00
	  1 readlink                 0.00     0.00
	  1 realpath                 0.00     0.00
	  1 sed                      0.00     0.00
	  1 sort                     0.00     0.00
	  1 systemctl                0.00     0.00
	  1 template.sh              0.00     0.00
	  1 wc                       0.00     0.00
	  1 xrandr                   0.00     0.00
The core blocks start slightly more threads than cores
      1666842) x265 start=4.92  finish=52.17
        1666843) x265 start=4.92  finish=52.16
          1666844) x265 start=4.92  finish=50.25
          1666845) x265 start=4.92  finish=52.06
          1666846) x265 start=4.92  finish=52.06
          1666847) x265 start=4.92  finish=52.06
          1666848) x265 start=4.92  finish=52.06
          1666849) x265 start=4.92  finish=52.06
          1666850) x265 start=4.92  finish=52.06
          1666851) x265 start=4.92  finish=52.06
          1666852) x265 start=4.92  finish=52.06
          1666853) x265 start=4.92  finish=52.06
          1666854) x265 start=4.92  finish=52.06
          1666855) x265 start=4.92  finish=52.06
          1666856) x265 start=4.92  finish=52.06
          1666857) x265 start=4.92  finish=52.06
          1666858) x265 start=4.92  finish=52.06
          1666859) x265 start=4.92  finish=52.06
          1666860) x265 start=4.92  finish=52.06
          1666861) x265 start=4.92  finish=52.06
          1666862) x265 start=4.94  finish=52.06
          1666863) x265 start=4.94  finish=52.06
          1666864) x265 start=4.94  finish=52.06
          1666865) x265 start=4.94  finish=52.16
          1666866) x265 start=4.94  finish=50.58
What accounts for the relatively lower amount of on-core time? The AMD metrics provide one clue with the number of inblock/outblock operations (need to update the metrics to provide these as a rate).