
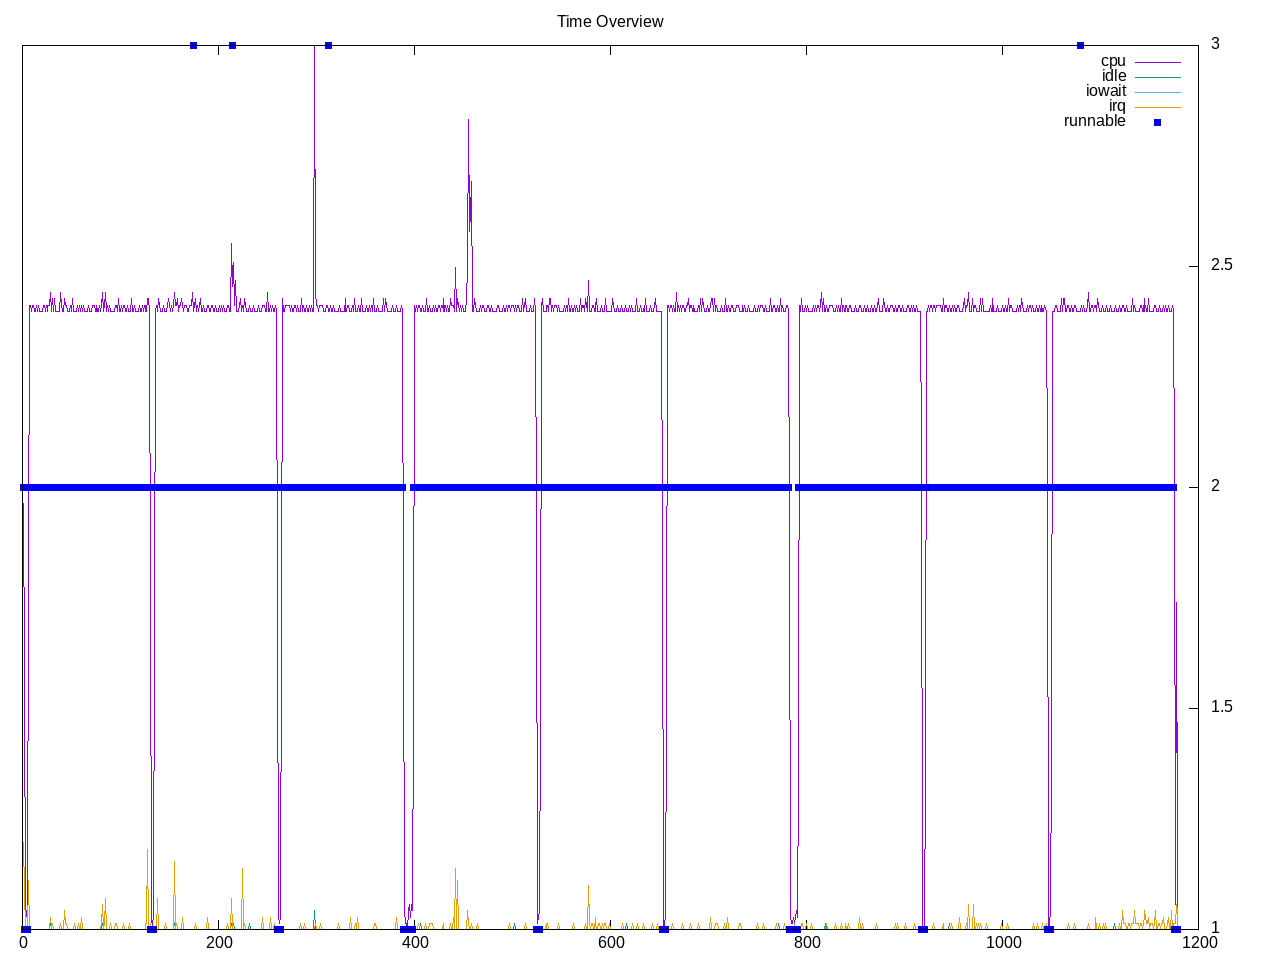
A test of memory and cache bandwidth. There are three subtests: read, write and read/modify/write. From the profile below these look to be single-threaded and taking similar times.
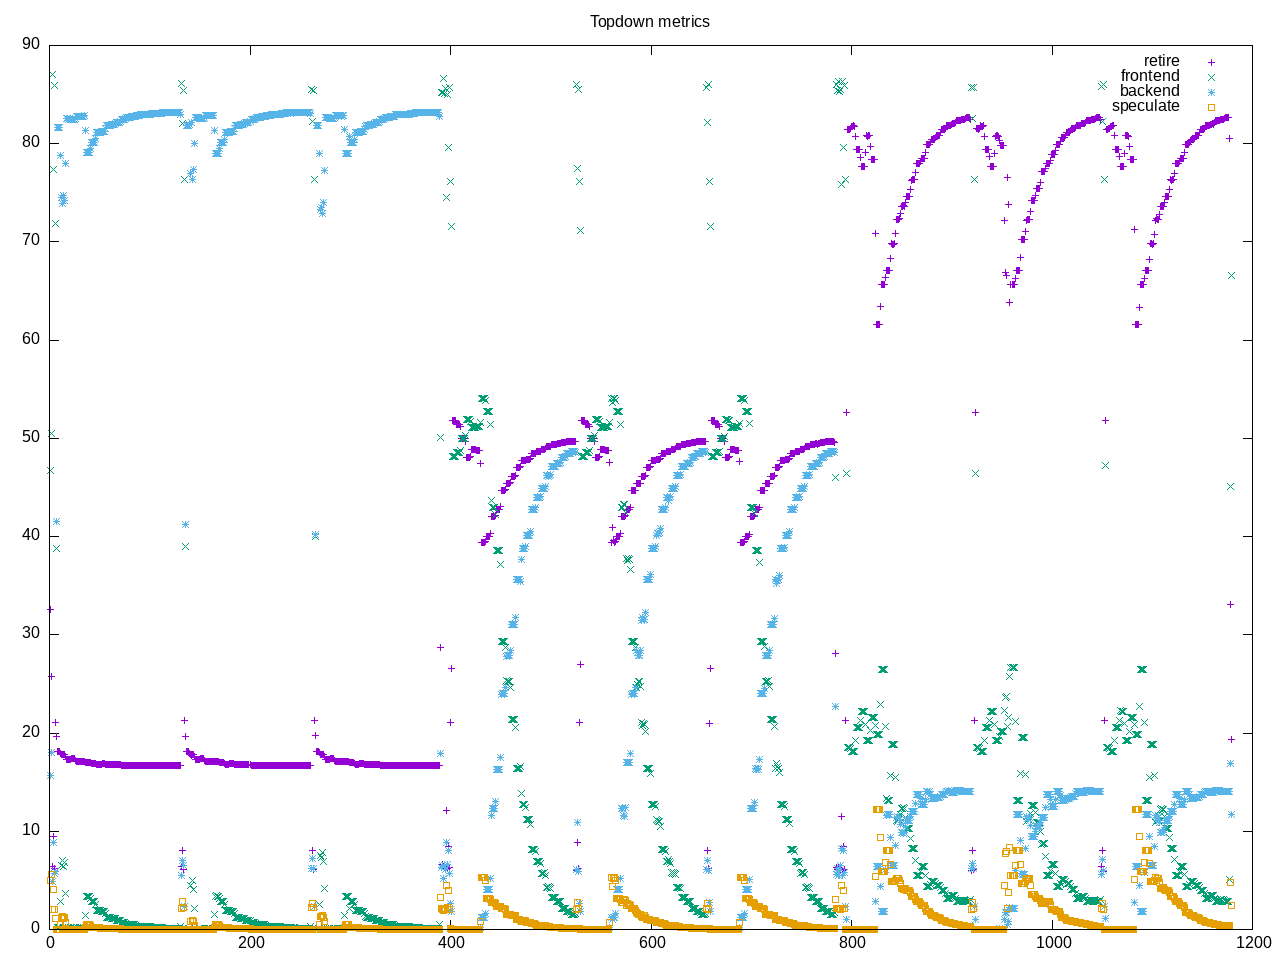
Topdown profile shows the read is memory-bound, write is memory-bound but at lower level and read/write/modify has the highest retirement rate.
AMD metrics show a lot of floating point and relatively low L2 rate.
elapsed              1178.850
on_cpu               0.060          # 0.96 / 16 cores
utime                1126.046
stime                0.815
nvcsw                2097           # 32.65%
nivcsw               4325           # 67.35%
inblock              16             # 0.01/sec
onblock              12792          # 10.85/sec
cpu-clock            1127005636652  # 1127.006 seconds
task-clock           1127015577254  # 1127.016 seconds
page faults          188978         # 167.680/sec
context switches     12122          # 10.756/sec
cpu migrations       292            # 0.259/sec
major page faults    3              # 0.003/sec
minor page faults    188975         # 167.677/sec
alignment faults     0              # 0.000/sec
emulation faults     0              # 0.000/sec
branches             3634315461911  # 196.499 branches per 1000 inst
branch misses        9696274332     # 0.27% branch miss
conditional          3632170862135  # 196.383 conditional branches per 1000 inst
indirect             371552984      # 0.020 indirect branches per 1000 inst
cpu-cycles           5264528460862  # 0.28 GHz
instructions         18466319602366 # 3.51 IPC high
slots                10530906718080 #
retiring             4944646133622  # 47.0% (47.0%)
-- ucode             122706597      #     0.0%
-- fastpath          4944523427025  #    47.0%
frontend             1370144825102  # 13.0% (13.0%)
-- latency           295123694280   #     2.8%
-- bandwidth         1075021130822  #    10.2%
backend              4093208221590  # 38.9% (38.9%)
-- cpu               3679471645191  #    34.9%
-- memory            413736576399   #     3.9%
speculation          122376475801   #  1.2% ( 1.2%)
-- branch mispredict 122366430335   #     1.2%
-- pipeline restart  10045466       #     0.0%
smt-contention       530236733      #  0.0% ( 0.0%)
cpu-cycles           5263576000968  # 0.28 GHz
instructions         18472923856823 # 3.51 IPC high
instructions         6157833251749  # 6.829 l2 access per 1000 inst
l2 hit from l1       38763136163    # 0.06% l2 miss
l2 miss from l1      13623829       #
l2 hit from l2 pf    3276978159     #
l3 hit from l2 pf    5015543        #
l3 miss from l2 pf   5931174        #
instructions         6159376479220  # 375.514 float per 1000 inst
float 512            46             # 0.000 AVX-512 per 1000 inst
float 256            610            # 0.000 AVX-256 per 1000 inst
float 128            2312930817690  # 375.514 AVX-128 per 1000 inst
float MMX            0              # 0.000 MMX per 1000 inst
float scalar         0              # 0.000 scalar per 1000 inst
instructions         18504565007273 #
opcache              2049762220432  # 110.771 opcache per 1000 inst
opcache miss         1017908492     #  0.0% opcache miss rate
l1 dTLB miss         28190064       # 0.002 L1 dTLB per 1000 inst
l2 dTLB miss         5684855        # 0.000 L2 dTLB per 1000 inst
instructions         18499508052063 #
icache               2286810824     # 0.124 icache per 1000 inst
icache miss          211834745      #  9.3% icache miss rate
l1 iTLB miss         8797810        # 0.000 L1 iTLB per 1000 inst
l2 iTLB miss         0              # 0.000 L2 iTLB per 1000 inst
tlb flush            17235          # 0.000 TLB flush per 1000 inst
Intel metrics break things down by levels of memory hierarchy with the L1 being the highest amount.
elapsed              1178.774
on_cpu               0.060          # 0.96 / 16 cores
utime                1126.308
stime                0.563
nvcsw                2104           # 29.23%
nivcsw               5094           # 70.77%
inblock              1136           # 0.96/sec
onblock              1504           # 1.28/sec
cpu-clock            1126963839893  # 1126.964 seconds
task-clock           1126971932472  # 1126.972 seconds
page faults          184328         # 163.560/sec
context switches     12897          # 11.444/sec
cpu migrations       1050           # 0.932/sec
major page faults    0              # 0.000/sec
minor page faults    184328         # 163.560/sec
alignment faults     0              # 0.000/sec
emulation faults     0              # 0.000/sec
branches             3606911258653  # 199.754 branches per 1000 inst
branch misses        7048723296     # 0.20% branch miss
conditional          3606911271773  # 199.754 conditional branches per 1000 inst
indirect             633890851      # 0.035 indirect branches per 1000 inst
slots                25618559493746 #
retiring             14217732274034 # 55.5% (55.5%) high
-- ucode             484349856141   #     1.9%
-- fastpath          13733382417893 #    53.6%
frontend             4621490630497  # 18.0% (18.0%)
-- latency           881073797992   #     3.4%
-- bandwidth         3740416832505  #    14.6%
backend              6967643203188  # 27.2% (27.2%)
-- cpu               5626301638829  #    22.0%
-- memory            1341341564359  #     5.2%
speculation          125507624550   #  0.5% ( 0.5%) low
-- branch mispredict 125315315281   #     0.5%
-- pipeline restart  192309269      #     0.0%
smt-contention       0              #  0.0% ( 0.0%)
cpu-cycles           4270504875023  # 0.23 GHz
instructions         18137358870259 # 4.25 IPC high
l2 access            59921390459    # 3.304 l2 access per 1000 inst
l2 miss              207094023      # 0.35% l2 miss
cpu-cycles           4270576848122  # 11.3% memory latency
load stalls          430798387441   #  8.3% l1 bound
l1 miss              76131137261    #  1.8% l2 bound
l2 miss              433393833      #  0.0% l3 bound
l3 miss              222225184      #  0.0% dram bound
store_stalls         52809562442    #  1.2% store bound
Process summary shows execution mostly in a cachebench executable.
370 processes
	 18 cachebench            1125.03     0.02
	 68 clinfo                  18.19     5.98
	 38 vulkaninfo               1.15     1.15
	  6 glxinfo:gdrv0            0.16     0.06
	  6 glxinfo:gl0              0.16     0.06
	  4 vulkani:disk$0           0.13     0.13
	  6 php                      0.08     0.19
	  2 glxinfo                  0.08     0.02
	  2 glxinfo:cs0              0.08     0.02
	  2 glxinfo:disk$0           0.08     0.02
	  2 glxinfo:sh0              0.08     0.02
	  2 glxinfo:shlo0            0.08     0.02
	  2 llvmpipe-0               0.07     0.07
	  2 llvmpipe-1               0.07     0.07
	  2 llvmpipe-2               0.07     0.07
	  2 llvmpipe-3               0.07     0.07
	  2 llvmpipe-4               0.07     0.07
	  2 llvmpipe-5               0.07     0.07
	  2 llvmpipe-6               0.07     0.07
	  2 llvmpipe-7               0.07     0.07
	  2 llvmpipe-8               0.07     0.07
	  2 llvmpipe-10              0.06     0.07
	  2 llvmpipe-11              0.06     0.07
	  2 llvmpipe-12              0.06     0.07
	  2 llvmpipe-13              0.06     0.07
	  2 llvmpipe-14              0.06     0.07
	  2 llvmpipe-15              0.06     0.07
	  2 llvmpipe-9               0.06     0.07
	  6 clang                    0.06     0.06
	  3 rocminfo                 0.03     0.00
	  1 lspci                    0.00     0.02
	  1 ps                       0.00     0.01
	 86 sh                       0.00     0.00
	 13 gcc                      0.00     0.00
	 10 gsettings                0.00     0.00
	  8 stat                     0.00     0.00
	  8 systemd-detect-          0.00     0.00
	  6 llvm-link                0.00     0.00
	  5 gmain                    0.00     0.00
	  5 phoronix-test-s          0.00     0.00
	  2 cc                       0.00     0.00
	  2 lscpu                    0.00     0.00
	  2 uname                    0.00     0.00
	  2 which                    0.00     0.00
	  2 xset                     0.00     0.00
	  1 date                     0.00     0.00
	  1 dconf worker             0.00     0.00
	  1 dirname                  0.00     0.00
	  1 dmesg                    0.00     0.00
	  1 dmidecode                0.00     0.00
	  1 grep                     0.00     0.00
	  1 ifconfig                 0.00     0.00
	  1 ip                       0.00     0.00
	  1 lsmod                    0.00     0.00
	  1 mktemp                   0.00     0.00
	  1 qdbus                    0.00     0.00
	  1 readlink                 0.00     0.00
	  1 realpath                 0.00     0.00
	  1 sed                      0.00     0.00
	  1 sort                     0.00     0.00
	  1 stty                     0.00     0.00
	  1 systemctl                0.00     0.00
	  1 template.sh              0.00     0.00
	  1 wc                       0.00     0.00
	  1 xrandr                   0.00     0.00
0 processes running
47 maximum processes
Computation blocks are straightforward
      7982) cachebench       cpu=14 start=5.68  finish=130.71
        7983) cachebench       cpu=14 start=5.69  finish=130.71
      7987) cachebench       cpu=8 start=134.71 finish=259.74
        7988) cachebench       cpu=1 start=134.72 finish=259.74
      7990) cachebench       cpu=0 start=263.74 finish=388.77
        7991) cachebench       cpu=9 start=263.75 finish=388.77
      7993) sh               cpu=10 start=388.77 finish=388.77
        7994) sh               cpu=3 start=388.77 finish=388.77
      7995) cachebench       cpu=3 start=399.06 finish=524.08
        7996) cachebench       cpu=12 start=399.06 finish=524.08
      7997) cachebench       cpu=10 start=528.09 finish=653.11
        7998) cachebench       cpu=3 start=528.09 finish=653.11
      8002) cachebench       cpu=2 start=657.12 finish=782.14
        8003) cachebench       cpu=11 start=657.12 finish=782.14
      8004) sh               cpu=2 start=782.14 finish=782.15
        8005) sh               cpu=11 start=782.15 finish=782.15
      8006) cachebench       cpu=2 start=792.33 finish=917.35
        8007) cachebench       cpu=3 start=792.33 finish=917.35
      8009) cachebench       cpu=2 start=921.36 finish=1046.38
        8010) cachebench       cpu=3 start=921.36 finish=1046.38
      8011) cachebench       cpu=10 start=1050.39 finish=1175.41
        8012) cachebench       cpu=3 start=1050.39 finish=1175.41
This is one where breaking out the subtests might show different sets of counter values.