
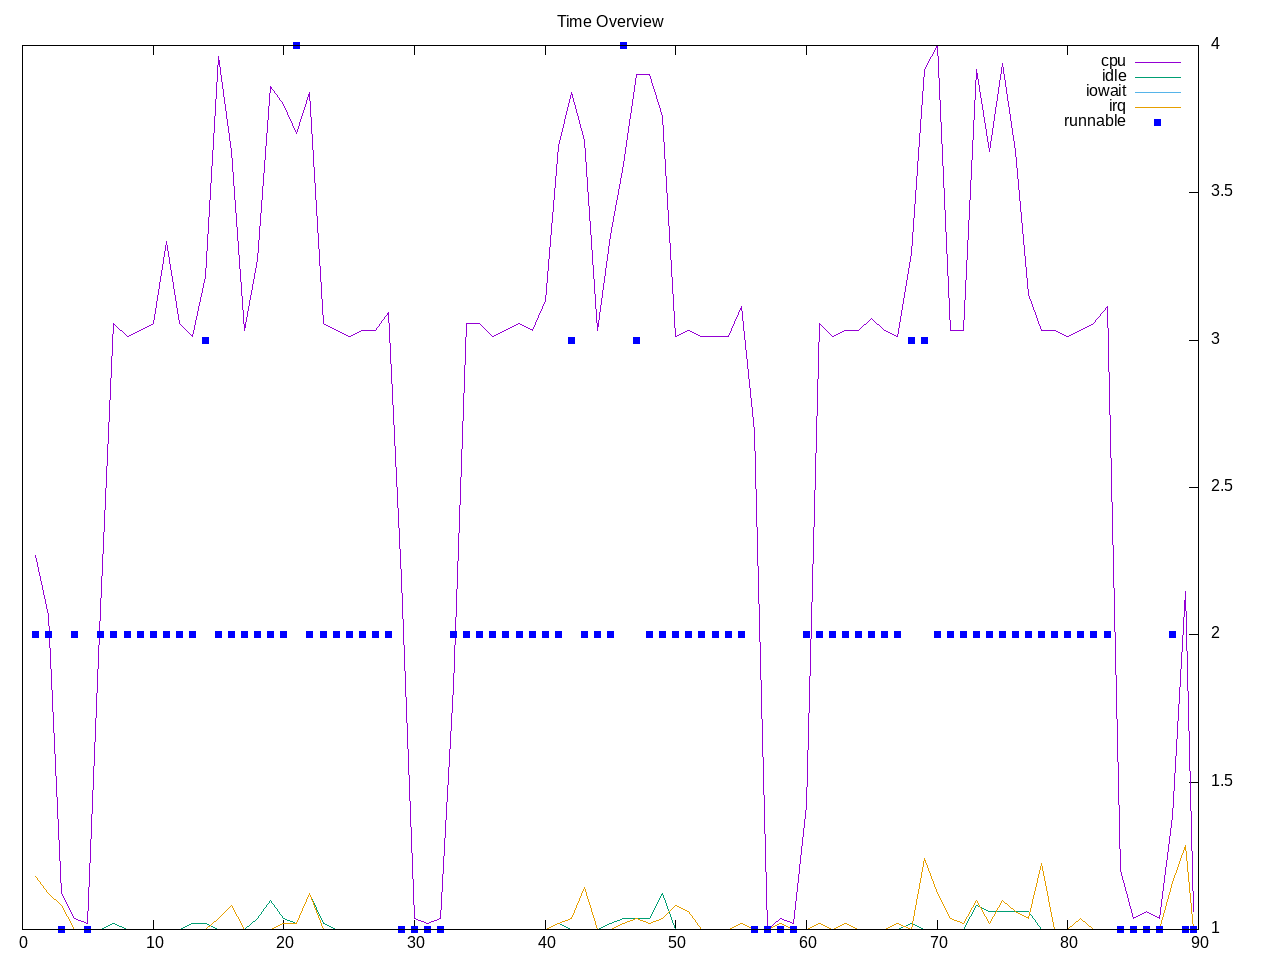
A test of file system operations related to what is used to maintain kernel trees. This has three subtests: compile, initial create and read compiled tree. These tests run quickly and look to be single-threaded.
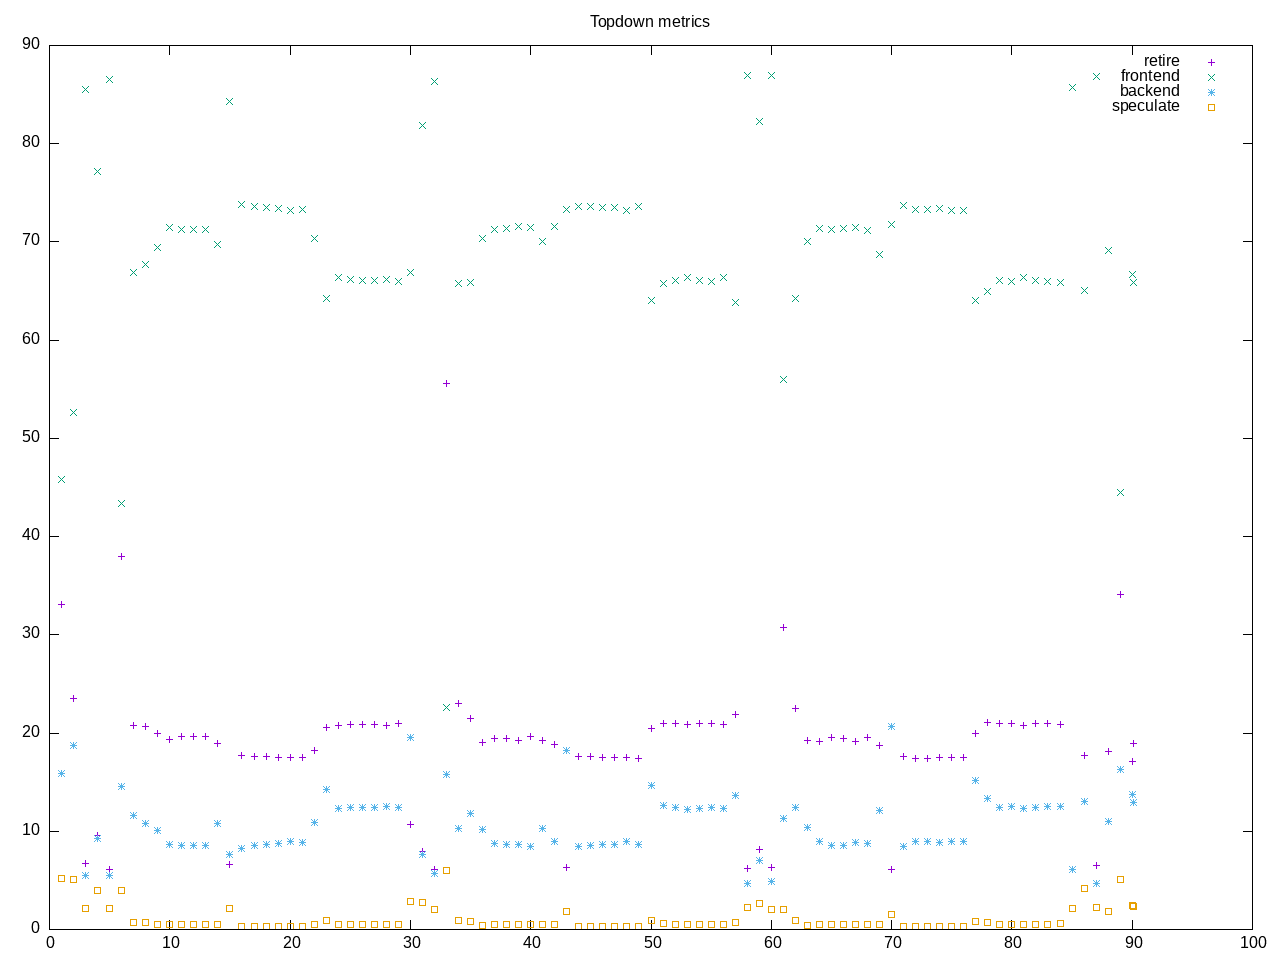
Topdown profile shows frontend stalls as highest with relatively low backend stalls.
AMD metrics show little floating point, a high opcache miss rate and an 11% icache miss rate with 1/5 of the instructions as branches. Frontend latency is high. There is a high amount of output blocks and almost no input blocks.
elapsed              89.996
on_cpu               0.044          # 0.71 / 16 cores
utime                7.809
stime                56.158
nvcsw                2509           # 24.27%
nivcsw               7829           # 75.73%
inblock              8              # 0.09/sec
onblock              65538520       # 728234.48/sec
cpu-clock            63999083442    # 63.999 seconds
task-clock           64004384231    # 64.004 seconds
page faults          178065         # 2782.075/sec
context switches     10580          # 165.301/sec
cpu migrations       394            # 6.156/sec
major page faults    2              # 0.031/sec
minor page faults    178063         # 2782.044/sec
alignment faults     0              # 0.000/sec
emulation faults     0              # 0.000/sec
branches             63013567795    # 198.359 branches per 1000 inst
branch misses        5940612790     # 9.43% branch miss
conditional          35303103205    # 111.130 conditional branches per 1000 inst
indirect             1192983745     # 3.755 indirect branches per 1000 inst
cpu-cycles           290958943660   # 0.20 GHz
instructions         317320090766   # 1.09 IPC
slots                583966234098   #
retiring             116929459720   # 20.0% (20.0%)
-- ucode             571788094      #     0.1%
-- fastpath          116357671626   #    19.9%
frontend             401304724510   # 68.7% (68.7%) high
-- latency           336924894132   #    57.7%
-- bandwidth         64379830378    #    11.0%
backend              62079412727    # 10.6% (10.6%) low
-- cpu               13257356583    #     2.3%
-- memory            48822056144    #     8.4%
speculation          3454155649     #  0.6% ( 0.6%) low
-- branch mispredict 3447845685     #     0.6%
-- pipeline restart  6309964        #     0.0%
smt-contention       198173313      #  0.0% ( 0.0%)
cpu-cycles           289259190827   # 0.20 GHz
instructions         315675605246   # 1.09 IPC
instructions         105762868493   # 68.909 l2 access per 1000 inst
l2 hit from l1       6720971259     # 6.82% l2 miss
l2 miss from l1      241036077      #
l2 hit from l2 pf    311085299      #
l3 hit from l2 pf    88085211       #
l3 miss from l2 pf   167888574      #
instructions         105756026935   # 12.301 float per 1000 inst
float 512            74             # 0.000 AVX-512 per 1000 inst
float 256            668            # 0.000 AVX-256 per 1000 inst
float 128            1300940242     # 12.301 AVX-128 per 1000 inst
float MMX            0              # 0.000 MMX per 1000 inst
float scalar         21             # 0.000 scalar per 1000 inst
instructions         317305283501   #
opcache              96197134370    # 303.169 opcache per 1000 inst
opcache miss         57752090686    # 60.0% opcache miss rate
l1 dTLB miss         978514157      # 3.084 L1 dTLB per 1000 inst
l2 dTLB miss         13665626       # 0.043 L2 dTLB per 1000 inst
instructions         318170252018   #
icache               124538457131   # 391.421 icache per 1000 inst
icache miss          13704861327    # 11.0% icache miss rate
l1 iTLB miss         112977480      # 0.355 L1 iTLB per 1000 inst
l2 iTLB miss         0              # 0.000 L2 iTLB per 1000 inst
tlb flush            24981          # 0.000 TLB flush per 1000 inst
Intel metrics show L2 as the largest part of memory bound aspects.
elapsed              103.155
on_cpu               0.025          # 0.41 / 16 cores
utime                7.438
stime                34.585
nvcsw                6535           # 75.58%
nivcsw               2112           # 24.42%
inblock              1336           # 12.95/sec
onblock              65527288       # 635229.35/sec
cpu-clock            42023931539    # 42.024 seconds
task-clock           42032493432    # 42.032 seconds
page faults          167919         # 3994.981/sec
context switches     8957           # 213.097/sec
cpu migrations       491            # 11.681/sec
major page faults    0              # 0.000/sec
minor page faults    167919         # 3994.981/sec
alignment faults     0              # 0.000/sec
emulation faults     0              # 0.000/sec
branches             50807657927    # 172.266 branches per 1000 inst
branch misses        135894069      # 0.27% branch miss
conditional          50807670919    # 172.266 conditional branches per 1000 inst
indirect             1194939709     # 4.052 indirect branches per 1000 inst
slots                773415976724   #
retiring             331308877913   # 42.8% (42.8%)
-- ucode             35167431992    #     4.5%
-- fastpath          296141445921   #    38.3%
frontend             233006981567   # 30.1% (30.1%)
-- latency           80228342919    #    10.4%
-- bandwidth         152778638648   #    19.8%
backend              181914046624   # 23.5% (23.5%)
-- cpu               69711483930    #     9.0%
-- memory            112202562694   #    14.5%
speculation          39111851292    #  5.1% ( 5.1%)
-- branch mispredict 32350542141    #     4.2%
-- pipeline restart  6761309151     #     0.9%
smt-contention       0              #  0.0% ( 0.0%)
cpu-cycles           129783140930   # 0.08 GHz
instructions         294812371436   # 2.27 IPC
l2 access            16882455472    # 57.333 l2 access per 1000 inst
l2 miss              2140286539     # 12.68% l2 miss
cpu-cycles           129742170073   # 23.8% memory latency
load stalls          25972698653    #  4.1% l1 bound
l1 miss              20702278744    # 10.4% l2 bound
l2 miss              7150731886     #  1.4% l3 bound
l3 miss              5283474262     #  4.1% dram bound
store_stalls         4878082314     #  3.8% store bound
The process overview shows this driven from python with system time as the largest portion.
390 processes
	 68 clinfo                  17.19     8.64
	  3 python2                  6.44    55.32
	 38 vulkaninfo               1.14     1.80
	  6 glxinfo:gdrv0            0.13     0.07
	  6 glxinfo:gl0              0.13     0.07
	  4 vulkani:disk$0           0.12     0.19
	  6 php                      0.09     0.06
	  2 glxinfo                  0.07     0.03
	  2 glxinfo:cs0              0.07     0.03
	  2 glxinfo:disk$0           0.07     0.03
	  2 glxinfo:sh0              0.07     0.03
	  2 glxinfo:shlo0            0.07     0.03
	  2 llvmpipe-0               0.06     0.10
	  2 llvmpipe-1               0.06     0.10
	  2 llvmpipe-10              0.06     0.10
	  2 llvmpipe-11              0.06     0.10
	  2 llvmpipe-12              0.06     0.10
	  2 llvmpipe-13              0.06     0.10
	  2 llvmpipe-14              0.06     0.10
	  2 llvmpipe-15              0.06     0.10
	  2 llvmpipe-2               0.06     0.10
	  2 llvmpipe-3               0.06     0.10
	  2 llvmpipe-4               0.06     0.10
	  2 llvmpipe-5               0.06     0.10
	  2 llvmpipe-6               0.06     0.10
	  2 llvmpipe-7               0.06     0.10
	  2 llvmpipe-8               0.06     0.10
	  2 llvmpipe-9               0.06     0.10
	  6 clang                    0.05     0.07
	  3 rocminfo                 0.03     0.00
	  1 lspci                    0.01     0.02
	 12 sync                     0.00     0.13
	 96 sh                       0.00     0.00
	 12 gcc                      0.00     0.00
	 12 gsettings                0.00     0.00
	  9 stat                     0.00     0.00
	  8 systemd-detect-          0.00     0.00
	  6 llvm-link                0.00     0.00
	  5 phoronix-test-s          0.00     0.00
	  5 which                    0.00     0.00
	  3 compilebench             0.00     0.00
	  3 gmain                    0.00     0.00
	  3 mkdir                    0.00     0.00
	  3 rm                       0.00     0.00
	  2 lscpu                    0.00     0.00
	  2 uname                    0.00     0.00
	  2 xset                     0.00     0.00
	  1 cc                       0.00     0.00
	  1 date                     0.00     0.00
	  1 dconf worker             0.00     0.00
	  1 dirname                  0.00     0.00
	  1 dmesg                    0.00     0.00
	  1 dmidecode                0.00     0.00
	  1 grep                     0.00     0.00
	  1 ifconfig                 0.00     0.00
	  1 ip                       0.00     0.00
	  1 lsmod                    0.00     0.00
	  1 mktemp                   0.00     0.00
	  1 ps                       0.00     0.00
	  1 python                   0.00     0.00
	  1 python3                  0.00     0.00
	  1 qdbus                    0.00     0.00
	  1 readlink                 0.00     0.00
	  1 realpath                 0.00     0.00
	  1 sed                      0.00     0.00
	  1 sort                     0.00     0.00
	  1 stty                     0.00     0.00
	  1 systemctl                0.00     0.00
	  1 template.sh              0.00     0.00
	  1 wc                       0.00     0.00
	  1 xrandr                   0.00     0.00
0 processes running
47 maximum processes
Computation blocks look as follows
      12442) compilebench     cpu=9 start=6.64  finish=29.93
        12443) rm               cpu=11 start=6.64  finish=6.64
        12444) mkdir            cpu=15 start=6.64  finish=6.64
        12445) which            cpu=12 start=6.64  finish=6.64
        12446) python2          cpu=1 start=6.64  finish=29.92
          12448) sh               cpu=4 start=15.08 finish=16.91
            12449) sync             cpu=5 start=15.09 finish=16.91
          12450) sh               cpu=12 start=22.44 finish=23.04
            12451) sync             cpu=5 start=22.44 finish=23.04
          12452) sh               cpu=12 start=23.99 finish=24.03
            12453) sync             cpu=5 start=23.99 finish=24.03
          12454) sh               cpu=10 start=29.87 finish=29.92
            12455) sync             cpu=3 start=29.87 finish=29.92