
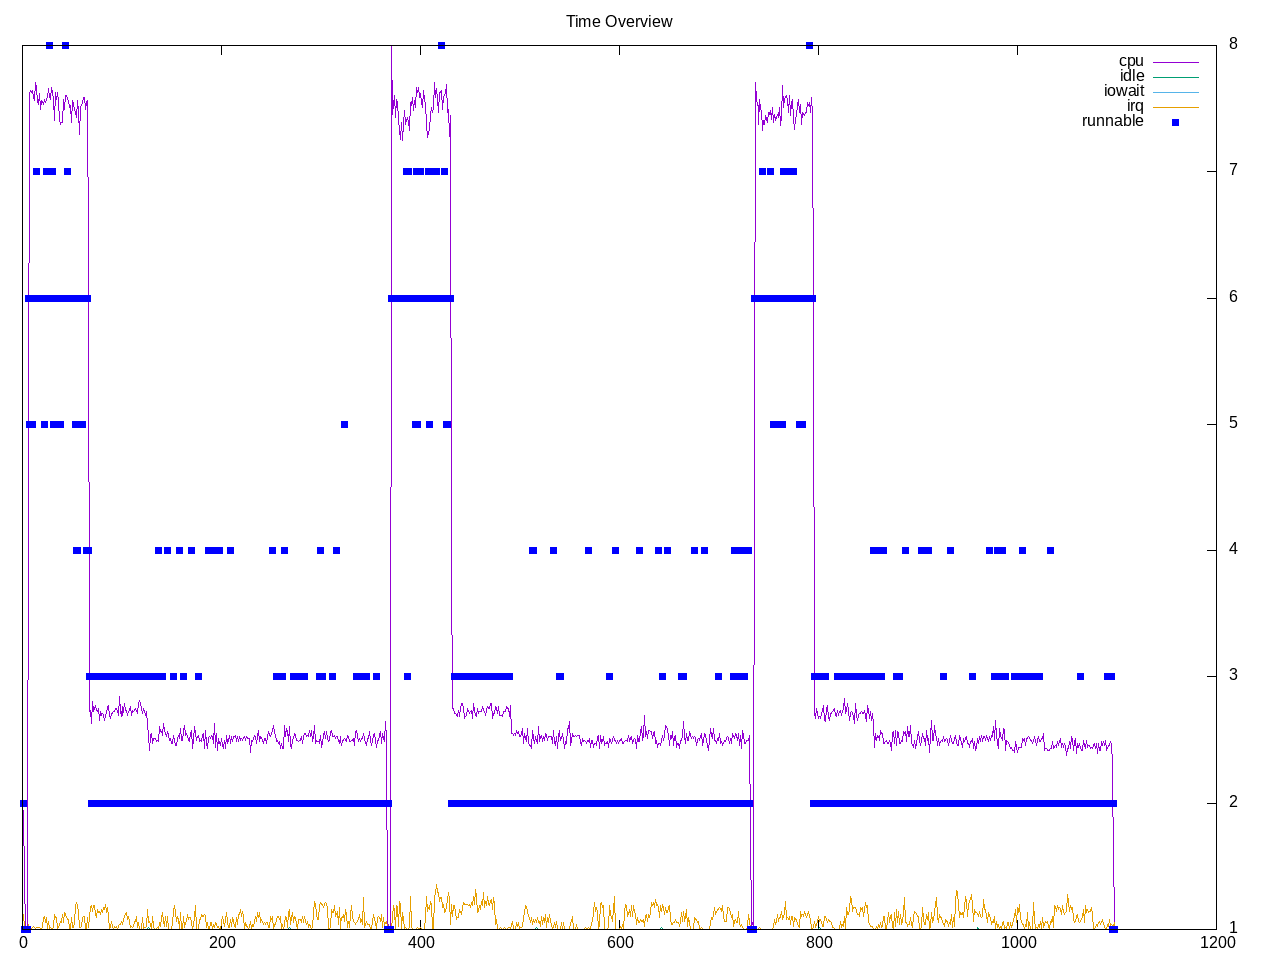
Signal processing blocks for software-defined radio. There is one result but it reports on six subtests. The later ones look single-threaded with earier ones have more multi-threaded aspects.
Topdown profile shows variation amount the subtests with a few backend bound and a few with high retirement rates.
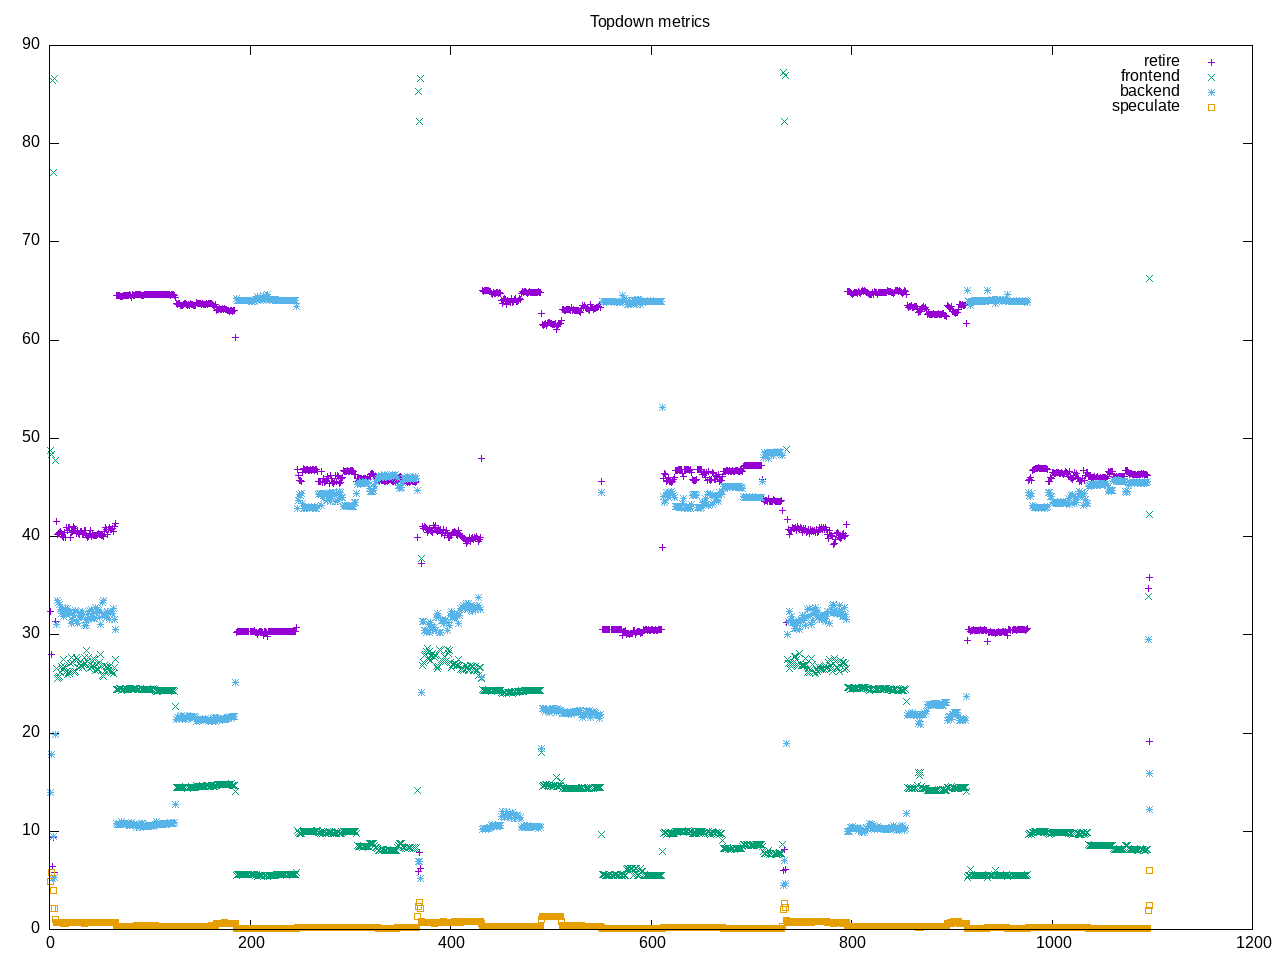
AMD metrics are a composite. This is floating point code with moderate retirement rate.
elapsed              1097.637
on_cpu               0.121          # 1.93 / 16 cores
utime                1562.452
stime                558.792
nvcsw                89602927       # 99.99%
nivcsw               4545           # 0.01%
inblock              0              # 0.00/sec
onblock              13920          # 12.68/sec
cpu-clock            2095272795070  # 2095.273 seconds
task-clock           2114354833498  # 2114.355 seconds
page faults          170110         # 80.455/sec
context switches     89612779       # 42383.037/sec
cpu migrations       2779           # 1.314/sec
major page faults    21             # 0.010/sec
minor page faults    170089         # 80.445/sec
alignment faults     0              # 0.000/sec
emulation faults     0              # 0.000/sec
branches             1845636929664  # 82.601 branches per 1000 inst
branch misses        21723197141    # 1.18% branch miss
conditional          1537264132256  # 68.800 conditional branches per 1000 inst
indirect             57598335588    # 2.578 indirect branches per 1000 inst
cpu-cycles           8302100851453  # 0.47 GHz
instructions         23094745269927 # 2.78 IPC
slots                16383275123232 #
retiring             7492118350882  # 45.7% (45.9%)
-- ucode             15744683433    #     0.1%
-- fastpath          7476373667449  #    45.6%
frontend             3012954823010  # 18.4% (18.5%)
-- latency           1575453553086  #     9.6%
-- bandwidth         1437501269924  #     8.8%
backend              5747613614802  # 35.1% (35.2%)
-- cpu               3038521545725  #    18.5%
-- memory            2709092069077  #    16.5%
speculation          74801905916    #  0.5% ( 0.5%) low
-- branch mispredict 72868715607    #     0.4%
-- pipeline restart  1933190309     #     0.0%
smt-contention       55386719908    #  0.3% ( 0.0%)
cpu-cycles           8319796035258  # 0.47 GHz
instructions         23115058974537 # 2.78 IPC
instructions         7616531900660  # 31.420 l2 access per 1000 inst
l2 hit from l1       177670026785   # 7.21% l2 miss
l2 miss from l1      11066886113    #
l2 hit from l2 pf    55458519661    #
l3 hit from l2 pf    6175744674     #
l3 miss from l2 pf   6063535        #
instructions         7592977884179  # 211.400 float per 1000 inst
float 512            67             # 0.000 AVX-512 per 1000 inst
float 256            388            # 0.000 AVX-256 per 1000 inst
float 128            1605156885414  # 211.400 AVX-128 per 1000 inst
float MMX            0              # 0.000 MMX per 1000 inst
float scalar         37             # 0.000 scalar per 1000 inst
instructions         22861285368694 #
opcache              2139250028244  # 93.575 opcache per 1000 inst
opcache miss         624186820575   # 29.2% opcache miss rate
l1 dTLB miss         7418045926     # 0.324 L1 dTLB per 1000 inst
l2 dTLB miss         241724207      # 0.011 L2 dTLB per 1000 inst
instructions         22559155812921 #
icache               878817198627   # 38.956 icache per 1000 inst
icache miss          131715842092   # 15.0% icache miss rate
l1 iTLB miss         1830144713     # 0.081 L1 iTLB per 1000 inst
l2 iTLB miss         0              # 0.000 L2 iTLB per 1000 inst
tlb flush            28298          # 0.000 TLB flush per 1000 inst
Intel metrics show this fits in L3.
elapsed              1096.987
on_cpu               0.101          # 1.62 / 16 cores
utime                1506.299
stime                270.634
nvcsw                84433775       # 99.95%
nivcsw               41809          # 0.05%
inblock              36576          # 33.34/sec
onblock              2664           # 2.43/sec
cpu-clock            1739532062505  # 1739.532 seconds
task-clock           1748408579524  # 1748.409 seconds
page faults          165661         # 94.750/sec
context switches     84480901       # 48318.741/sec
cpu migrations       98036          # 56.072/sec
major page faults    228            # 0.130/sec
minor page faults    165433         # 94.619/sec
alignment faults     0              # 0.000/sec
emulation faults     0              # 0.000/sec
branches             1578650529620  # 83.347 branches per 1000 inst
branch misses        1664132624     # 0.11% branch miss
conditional          1578650549844  # 83.347 conditional branches per 1000 inst
indirect             112747402928   # 5.953 indirect branches per 1000 inst
slots                40609276691846 #
retiring             22874172887876 # 56.3% (56.3%) high
-- ucode             1613706177400  #     4.0%
-- fastpath          21260466710476 #    52.4%
frontend             4677518049216  # 11.5% (11.5%)
-- latency           2149216887370  #     5.3%
-- bandwidth         2528301161846  #     6.2%
backend              12344914421614 # 30.4% (30.4%)
-- cpu               7984307851491  #    19.7%
-- memory            4360606570123  #    10.7%
speculation          698457345576   #  1.7% ( 1.7%)
-- branch mispredict 617169797578   #     1.5%
-- pipeline restart  81287547998    #     0.2%
smt-contention       0              #  0.0% ( 0.0%)
cpu-cycles           5871574534741  # 0.33 GHz
instructions         20031105148449 # 3.41 IPC high
l2 access            179866949012   # 10.334 l2 access per 1000 inst
l2 miss              20298180768    # 11.29% l2 miss
cpu-cycles           5168426575314  # 17.0% memory latency
load stalls          842343722814   #  7.7% l1 bound
l1 miss              444045056065   #  4.7% l2 bound
l2 miss              199180657463   #  3.8% l3 bound
l3 miss              291145344      #  0.0% dram bound
store_stalls         37279648653    #  0.7% store bound
Process overview shows python code with subproceses for different tests.
634 processes
	 78 python3              45334.92  8184.34
	 21 fft_filter_ccf1       4164.37   662.14
	  6 iir_filter_ffd6       2949.47   557.66
	  6 iir_filter_ccf5       2688.09   518.63
	 12 fft_filter_ccf2       2602.84   411.60
	  6 fft_filter_fff3       2165.59   449.15
	  3 hilbert_fc82          1766.19   318.90
	  3 null_source81         1766.19   318.90
	  3 probe_rate83          1766.19   318.90
	  3 hilbert_fc78          1702.13   310.71
	  3 null_source77         1702.13   310.71
	  3 probe_rate79          1702.13   310.71
	  3 hilbert_fc74          1637.99   302.50
	  3 null_source73         1637.99   302.50
	  3 probe_rate75          1637.99   302.50
	  3 iir_filter_ffd7       1573.31   294.79
	  3 null_source68         1573.31   294.79
	  3 probe_rate71          1573.31   294.79
	  3 null_source63         1507.53   284.26
	  3 probe_rate66          1507.53   284.26
	  3 null_source58         1441.94   273.40
	  3 probe_rate61          1441.94   273.40
	  3 null_source54         1376.21   262.97
	  3 probe_rate56          1376.21   262.97
	  3 null_source50         1311.88   255.66
	  3 probe_rate52          1311.88   255.66
	  3 iir_filter_ccf4       1247.54   248.43
	  3 null_source46         1247.54   248.43
	  3 probe_rate48          1247.54   248.43
	  3 fft_filter_fff4       1183.22   241.11
	  3 null_source42         1183.22   241.11
	  3 probe_rate44          1183.22   241.11
	  3 null_source38         1116.25   230.21
	  3 probe_rate40          1116.25   230.21
	  3 null_source34         1049.34   218.94
	  3 probe_rate36          1049.34   218.94
	  3 probe_rate32           982.48   207.45
	  3 sig_source31           982.48   207.45
	  3 probe_rate29           915.38   179.32
	  3 sig_source28           915.38   179.32
	  3 probe_rate26           848.06   150.99
	  3 sig_source25           848.06   150.99
	  3 null_source17          780.91   122.77
	  3 probe_rate23           780.91   122.77
	  3 null_source9           520.51    83.32
	  3 probe_rate15           520.51    83.32
	  3 fft_filter_ccf3        260.11    43.29
	  3 fft_filter_ccf4        260.11    43.29
	  3 fft_filter_ccf5        260.11    43.29
	  3 fft_filter_ccf6        260.11    43.29
	  3 null_source1           260.11    43.29
	  3 probe_rate7            260.11    43.29
	 68 clinfo                  16.86     5.33
	 38 vulkaninfo               0.96     1.33
	  4 vulkani:disk$0           0.10     0.14
	  6 clang                    0.09     0.02
	  6 php                      0.06     0.14
	  2 llvmpipe-0               0.05     0.07
	  2 llvmpipe-1               0.05     0.07
	  2 llvmpipe-10              0.05     0.07
	  2 llvmpipe-11              0.05     0.07
	  2 llvmpipe-12              0.05     0.07
	  2 llvmpipe-13              0.05     0.07
	  2 llvmpipe-14              0.05     0.07
	  2 llvmpipe-15              0.05     0.07
	  2 llvmpipe-2               0.05     0.07
	  2 llvmpipe-3               0.05     0.07
	  2 llvmpipe-4               0.05     0.07
	  2 llvmpipe-5               0.05     0.07
	  2 llvmpipe-6               0.05     0.07
	  2 llvmpipe-7               0.05     0.07
	  2 llvmpipe-8               0.05     0.07
	  2 llvmpipe-9               0.05     0.07
	  1 lspci                    0.00     0.01
	 84 sh                       0.00     0.00
	 15 gnuradio-config          0.00     0.00
	 12 gcc                      0.00     0.00
	  9 gsettings                0.00     0.00
	  8 stat                     0.00     0.00
	  8 systemd-detect-          0.00     0.00
	  6 llvm-link                0.00     0.00
	  5 phoronix-test-s          0.00     0.00
	  4 glxinfo                  0.00     0.00
	  4 gmain                    0.00     0.00
	  3 dconf worker             0.00     0.00
	  3 gnuradio                 0.00     0.00
	  3 rocminfo                 0.00     0.00
	  2 lscpu                    0.00     0.00
	  2 setterm                  0.00     0.00
	  2 uname                    0.00     0.00
	  2 which                    0.00     0.00
	  1 cc                       0.00     0.00
	  1 date                     0.00     0.00
	  1 dirname                  0.00     0.00
	  1 dmesg                    0.00     0.00
	  1 dmidecode                0.00     0.00
	  1 grep                     0.00     0.00
	  1 ifconfig                 0.00     0.00
	  1 ip                       0.00     0.00
	  1 lsmod                    0.00     0.00
	  1 mktemp                   0.00     0.00
	  1 ps                       0.00     0.00
	  1 python                   0.00     0.00
	  1 qdbus                    0.00     0.00
	  1 readlink                 0.00     0.00
	  1 realpath                 0.00     0.00
	  1 sed                      0.00     0.00
	  1 sort                     0.00     0.00
	  1 stty                     0.00     0.00
	  1 systemctl                0.00     0.00
	  1 template.sh              0.00     0.00
	  1 wc                       0.00     0.00
19 processes running
66 maximum processes