
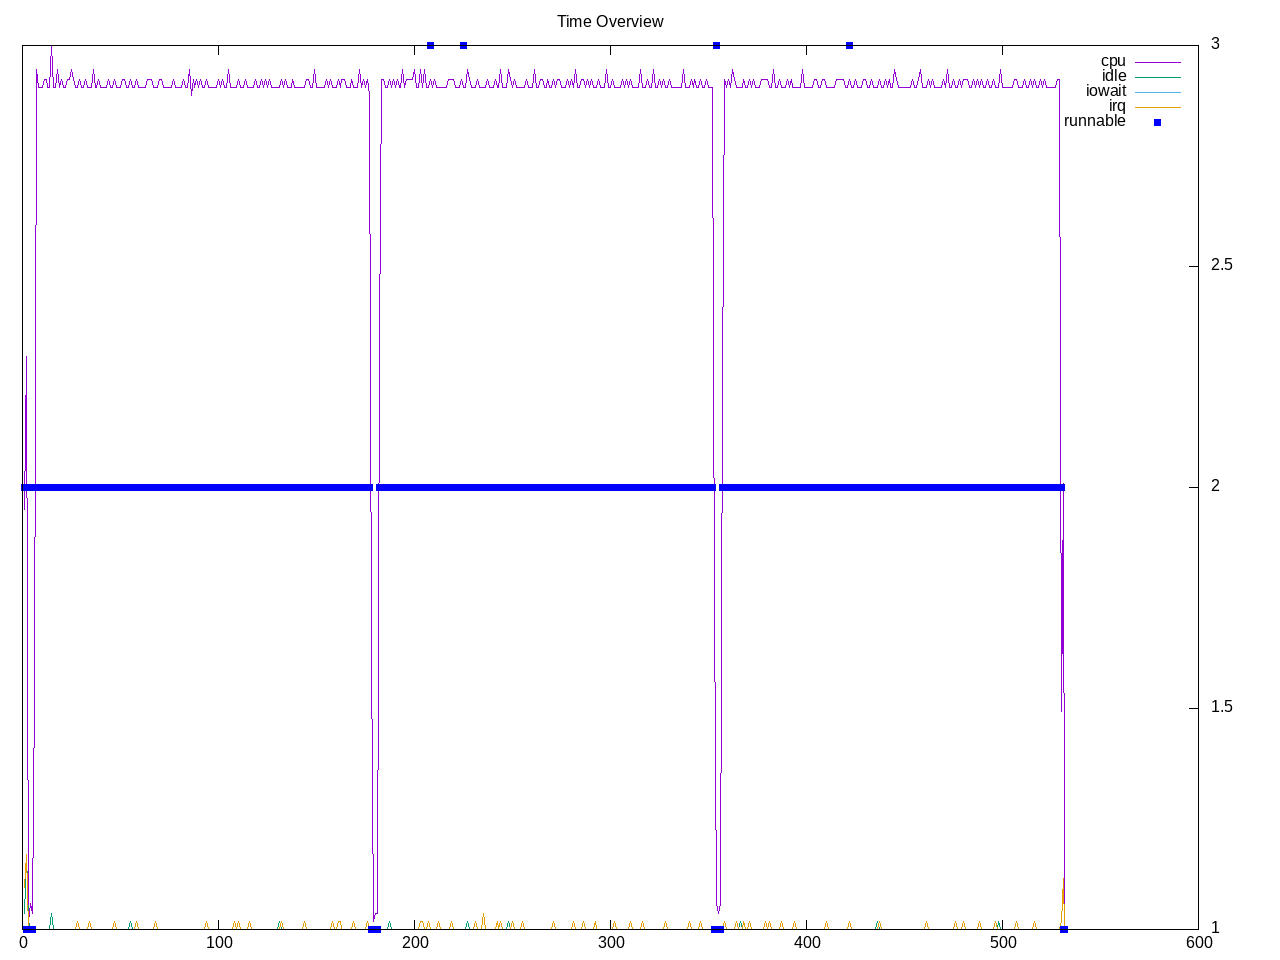
Testing libgcrypt with the integrated benchmark. Looks to be single-threaded.
Topdown profile shows some blurring, probably from different crypt subtests.
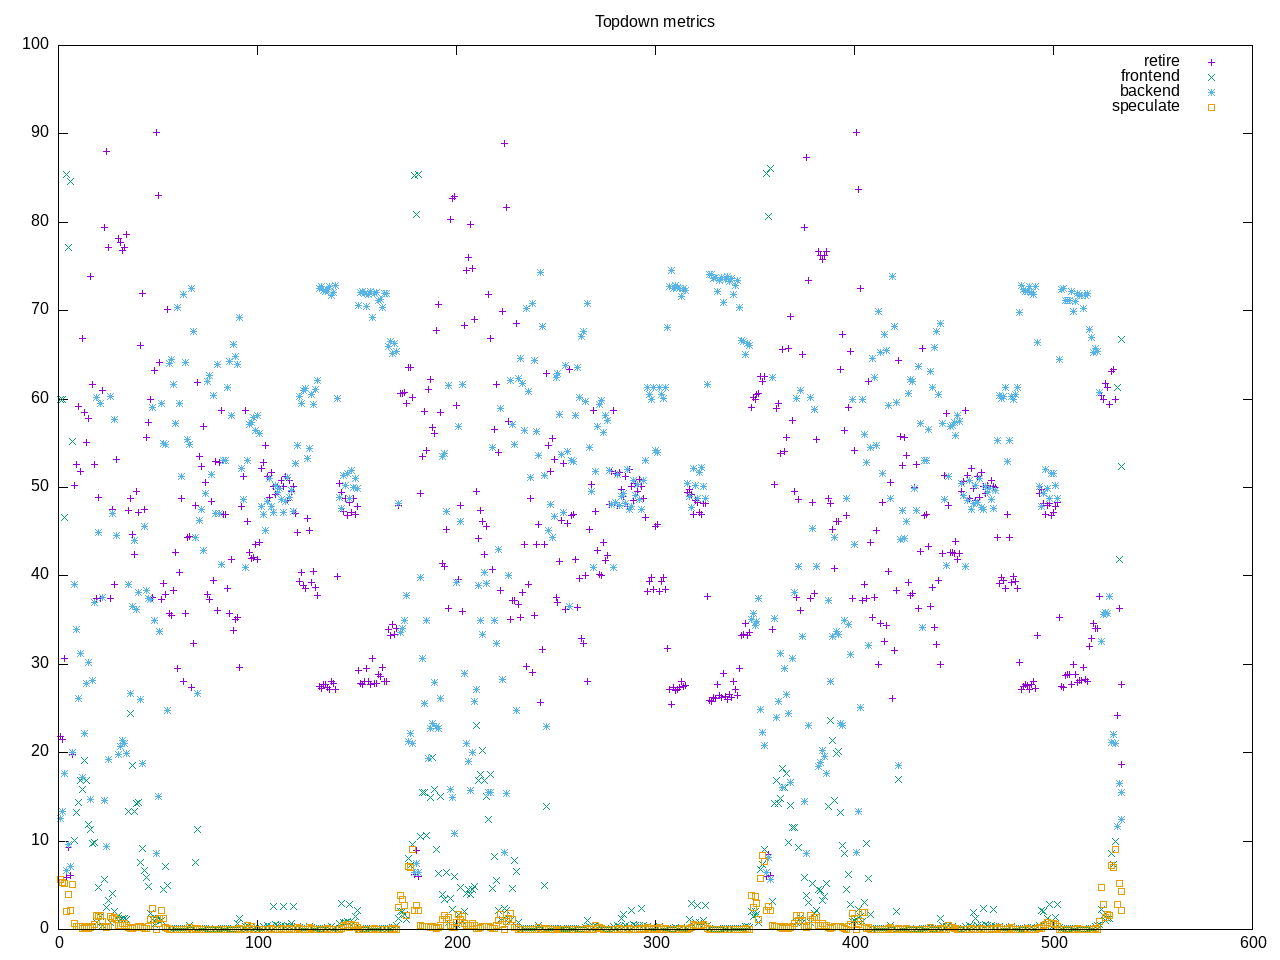
AMD metrics show little floaitng point, a very low amount of frontend stalls and very little L2 access.
elapsed              531.902
on_cpu               0.061          # 0.97 / 16 cores
utime                516.828
stime                0.740
nvcsw                2043           # 43.96%
nivcsw               2604           # 56.04%
inblock              64             # 0.12/sec
onblock              13832          # 26.00/sec
cpu-clock            517639332237   # 517.639 seconds
task-clock           517645091350   # 517.645 seconds
page faults          147616         # 285.168/sec
context switches     7137           # 13.787/sec
cpu migrations       331            # 0.639/sec
major page faults    3              # 0.006/sec
minor page faults    147613         # 285.163/sec
alignment faults     0              # 0.000/sec
emulation faults     0              # 0.000/sec
branches             380131956406   # 60.983 branches per 1000 inst
branch misses        431943792      # 0.11% branch miss
conditional          262048446662   # 42.039 conditional branches per 1000 inst
indirect             26285539920    # 4.217 indirect branches per 1000 inst
cpu-cycles           2417266512530  # 0.28 GHz
instructions         6219334247412  # 2.57 IPC
slots                4842841465530  #
retiring             2252950350168  # 46.5% (46.5%)
-- ucode             3132389809     #     0.1%
-- fastpath          2249817960359  #    46.5%
frontend             135360904140   #  2.8% ( 2.8%) low
-- latency           41369303016    #     0.9%
-- bandwidth         93991601124    #     1.9%
backend              2433230177150  # 50.2% (50.2%)
-- cpu               472885962398   #     9.8%
-- memory            1960344214752  #    40.5%
speculation          20862241606    #  0.4% ( 0.4%) low
-- branch mispredict 16213481345    #     0.3%
-- pipeline restart  4648760261     #     0.1%
smt-contention       437317253      #  0.0% ( 0.0%)
cpu-cycles           2413505785886  # 0.28 GHz
instructions         6212281735247  # 2.57 IPC
instructions         2071438044827  # 0.094 l2 access per 1000 inst
l2 hit from l1       178758560      # 12.16% l2 miss
l2 miss from l1      14677271       #
l2 hit from l2 pf    7254392        #
l3 hit from l2 pf    4271893        #
l3 miss from l2 pf   4767842        #
instructions         2070106154657  # 22.429 float per 1000 inst
float 512            60             # 0.000 AVX-512 per 1000 inst
float 256            620            # 0.000 AVX-256 per 1000 inst
float 128            46429470920    # 22.429 AVX-128 per 1000 inst
float MMX            0              # 0.000 MMX per 1000 inst
float scalar         0              # 0.000 scalar per 1000 inst
instructions         6226129956548  #
opcache              601881526493   # 96.670 opcache per 1000 inst
opcache miss         7859374446     #  1.3% opcache miss rate
l1 dTLB miss         28467427       # 0.005 L1 dTLB per 1000 inst
l2 dTLB miss         4893619        # 0.001 L2 dTLB per 1000 inst
instructions         6234336458913  #
icache               13440378870    # 2.156 icache per 1000 inst
icache miss          654545777      #  4.9% icache miss rate
l1 iTLB miss         7928289        # 0.001 L1 iTLB per 1000 inst
l2 iTLB miss         0              # 0.000 L2 iTLB per 1000 inst
tlb flush            16577          # 0.000 TLB flush per 1000 inst
Intel metrics show memory accesses are all L1. Interesting to see relative amounts of memory-bound vs cpu-bound flipped between AMD and Intel.
elapsed              635.257
on_cpu               0.061          # 0.98 / 16 cores
utime                619.955
stime                0.494
nvcsw                2947           # 49.68%
nivcsw               2985           # 50.32%
inblock              225048         # 354.26/sec
onblock              2688           # 4.23/sec
cpu-clock            620494490675   # 620.494 seconds
task-clock           620499746686   # 620.500 seconds
page faults          138394         # 223.036/sec
context switches     8940           # 14.408/sec
cpu migrations       472            # 0.761/sec
major page faults    1148           # 1.850/sec
minor page faults    137246         # 221.186/sec
alignment faults     0              # 0.000/sec
emulation faults     0              # 0.000/sec
branches             370758952846   # 60.936 branches per 1000 inst
branch misses        576569854      # 0.16% branch miss
conditional          370758964686   # 60.936 conditional branches per 1000 inst
indirect             26280180628    # 4.319 indirect branches per 1000 inst
slots                14166997571918 #
retiring             7649074520400  # 54.0% (54.0%)
-- ucode             500008685427   #     3.5%
-- fastpath          7149065834973  #    50.5%
frontend             1409343082210  #  9.9% ( 9.9%)
-- latency           280678924673   #     2.0%
-- bandwidth         1128664157537  #     8.0%
backend              5938083799852  # 41.9% (41.9%)
-- cpu               5064130744520  #    35.7%
-- memory            873953055332   #     6.2%
speculation          113614731650   #  0.8% ( 0.8%) low
-- branch mispredict 113465068431   #     0.8%
-- pipeline restart  149663219      #     0.0%
smt-contention       0              #  0.0% ( 0.0%)
cpu-cycles           2352185195712  # 0.23 GHz
instructions         6088304938733  # 2.59 IPC
l2 access            490630406      # 0.081 l2 access per 1000 inst
l2 miss              98092730       # 19.99% l2 miss
cpu-cycles           2352817541230  #  9.6% memory latency
load stalls          225825885761   #  9.6% l1 bound
l1 miss              938789868      #  0.0% l2 bound
l2 miss              410168589      #  0.0% l3 bound
l3 miss              261950789      #  0.0% dram bound
store_stalls         101113868      #  0.0% store bound
Process time shows most all the time spent in a benchmark application.
354 processes
	  3 benchmark              514.36     0.00
	 68 clinfo                  16.22     6.31
	 38 vulkaninfo               1.52     0.94
	  4 vulkani:disk$0           0.16     0.10
	  6 glxinfo:gdrv0            0.11     0.05
	  6 glxinfo:gl0              0.11     0.05
	  6 php                      0.08     0.09
	  2 llvmpipe-0               0.08     0.05
	  2 llvmpipe-1               0.08     0.05
	  2 llvmpipe-10              0.08     0.05
	  2 llvmpipe-11              0.08     0.05
	  2 llvmpipe-12              0.08     0.05
	  2 llvmpipe-13              0.08     0.05
	  2 llvmpipe-14              0.08     0.05
	  2 llvmpipe-15              0.08     0.05
	  2 llvmpipe-2               0.08     0.05
	  2 llvmpipe-3               0.08     0.05
	  2 llvmpipe-4               0.08     0.05
	  2 llvmpipe-5               0.08     0.05
	  2 llvmpipe-6               0.08     0.05
	  2 llvmpipe-7               0.08     0.05
	  2 llvmpipe-8               0.08     0.05
	  2 llvmpipe-9               0.08     0.05
	  2 glxinfo                  0.06     0.02
	  2 glxinfo:cs0              0.06     0.02
	  2 glxinfo:disk$0           0.06     0.02
	  2 glxinfo:sh0              0.06     0.02
	  2 glxinfo:shlo0            0.06     0.02
	  6 clang                    0.04     0.08
	  3 rocminfo                 0.00     0.03
	  1 lspci                    0.00     0.02
	 82 sh                       0.00     0.00
	 13 gcc                      0.00     0.00
	 11 gsettings                0.00     0.00
	  8 stat                     0.00     0.00
	  8 systemd-detect-          0.00     0.00
	  6 llvm-link                0.00     0.00
	  5 phoronix-test-s          0.00     0.00
	  3 gcrypt                   0.00     0.00
	  3 gmain                    0.00     0.00
	  2 cc                       0.00     0.00
	  2 dconf worker             0.00     0.00
	  2 lscpu                    0.00     0.00
	  2 uname                    0.00     0.00
	  2 which                    0.00     0.00
	  2 xset                     0.00     0.00
	  1 date                     0.00     0.00
	  1 dirname                  0.00     0.00
	  1 dmesg                    0.00     0.00
	  1 dmidecode                0.00     0.00
	  1 grep                     0.00     0.00
	  1 ifconfig                 0.00     0.00
	  1 ip                       0.00     0.00
	  1 lsmod                    0.00     0.00
	  1 mktemp                   0.00     0.00
	  1 ps                       0.00     0.00
	  1 qdbus                    0.00     0.00
	  1 readlink                 0.00     0.00
	  1 realpath                 0.00     0.00
	  1 sed                      0.00     0.00
	  1 sort                     0.00     0.00
	  1 stty                     0.00     0.00
	  1 systemctl                0.00     0.00
	  1 template.sh              0.00     0.00
	  1 wc                       0.00     0.00
	  1 xrandr                   0.00     0.00
0 processes running
47 maximum processes
Core computation pieces
      823837) gcrypt           cpu=1 start=5.64  finish=177.28
        823838) benchmark        cpu=11 start=5.64  finish=177.28
      823842) gcrypt           cpu=1 start=181.28 finish=352.58
        823843) benchmark        cpu=10 start=181.28 finish=352.58
      823967) gcrypt           cpu=1 start=356.58 finish=528.03
        823968) benchmark        cpu=10 start=356.59 finish=528.03