
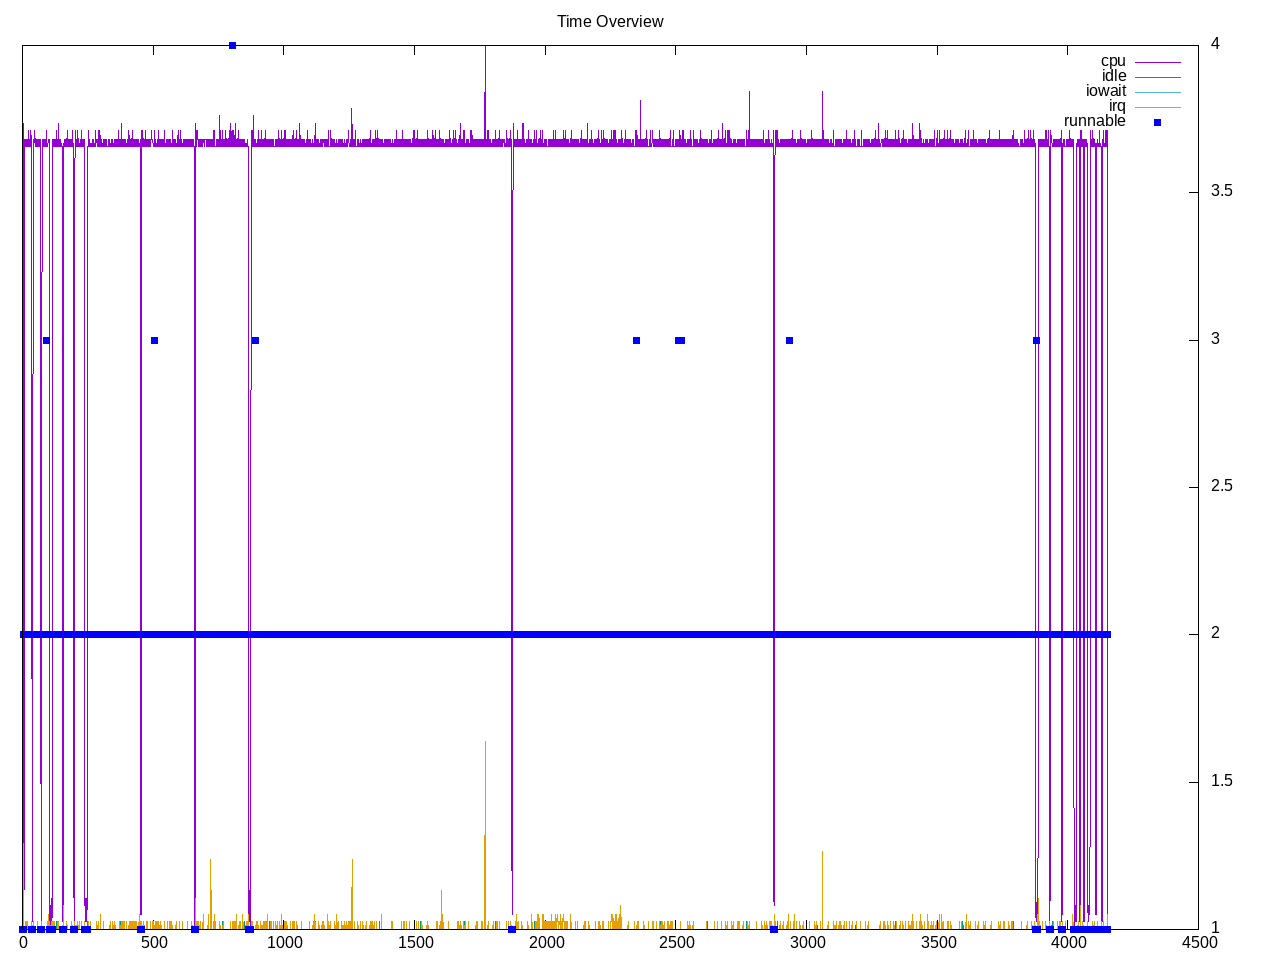
A set of C++ compiler performance benchmarks. There are seven workloads but the 4th workload takes ~75% of the time and the 3rd workload takes 13% of the time. It looks to be mostly single-threaded.
Topdown profile shows the longest workload is backend bound.
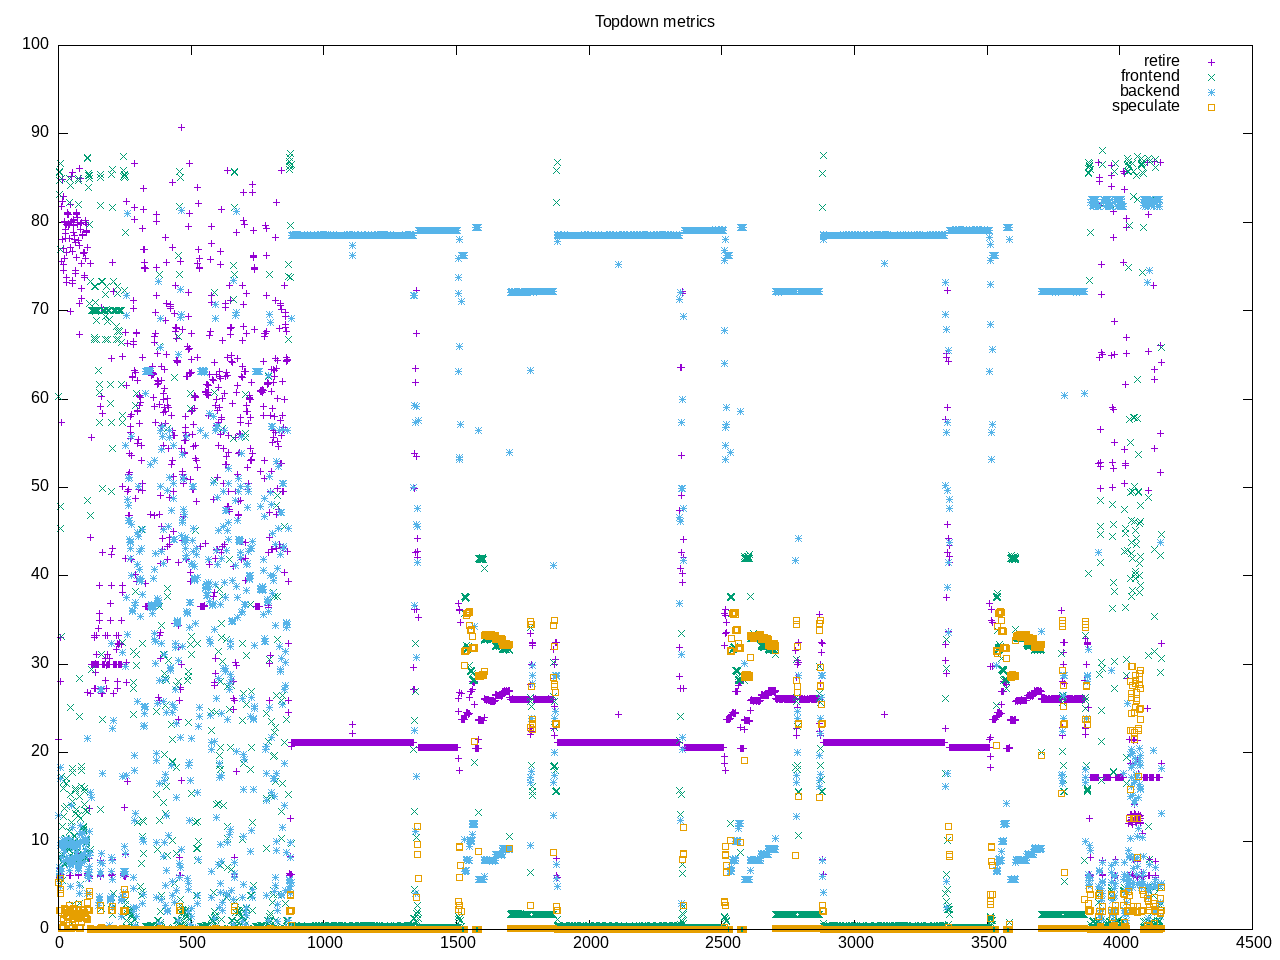
AMD metrics show low frontend stalls, a moderate amount of floating point and low L2 access.
elapsed              4152.282
on_cpu               0.061          # 0.97 / 16 cores
utime                4028.006
stime                0.861
nvcsw                2304           # 10.11%
nivcsw               20482          # 89.89%
inblock              0              # 0.00/sec
onblock              13664          # 3.29/sec
cpu-clock            4029353979373  # 4029.354 seconds
task-clock           4029386424465  # 4029.386 seconds
page faults          161021         # 39.962/sec
context switches     43316          # 10.750/sec
cpu migrations       570            # 0.141/sec
major page faults    2              # 0.000/sec
minor page faults    161019         # 39.961/sec
alignment faults     0              # 0.000/sec
emulation faults     0              # 0.000/sec
branches             5053525210204  # 148.848 branches per 1000 inst
branch misses        86945679275    # 1.72% branch miss
conditional          4056265160749  # 119.474 conditional branches per 1000 inst
indirect             209326902213   # 6.166 indirect branches per 1000 inst
cpu-cycles           18870987219583 # 0.28 GHz
instructions         33949846979899 # 1.80 IPC
slots                37743699269016 #
retiring             11352214902392 # 30.1% (30.1%)
-- ucode             6928674796     #     0.0%
-- fastpath          11345286227596 #    30.1%
frontend             3328560349222  #  8.8% ( 8.8%)
-- latency           2235953077110  #     5.9%
-- bandwidth         1092607272112  #     2.9%
backend              21313619382131 # 56.5% (56.5%)
-- cpu               10866513489890 #    28.8%
-- memory            10447105892241 #    27.7%
speculation          1747934988006  #  4.6% ( 4.6%)
-- branch mispredict 1746614988191  #     4.6%
-- pipeline restart  1319999815     #     0.0%
smt-contention       1368585558     #  0.0% ( 0.0%)
cpu-cycles           18866636234420 # 0.28 GHz
instructions         33951875487897 # 1.80 IPC
instructions         11323796838173 # 0.388 l2 access per 1000 inst
l2 hit from l1       4168381036     # 0.81% l2 miss
l2 miss from l1      24526213       #
l2 hit from l2 pf    214160338      #
l3 hit from l2 pf    6348965        #
l3 miss from l2 pf   4623318        #
instructions         11315727437411 # 166.242 float per 1000 inst
float 512            68             # 0.000 AVX-512 per 1000 inst
float 256            632            # 0.000 AVX-256 per 1000 inst
float 128            1881152882630  # 166.242 AVX-128 per 1000 inst
float MMX            0              # 0.000 MMX per 1000 inst
float scalar         0              # 0.000 scalar per 1000 inst
instructions         33950818366915 #
opcache              4901373308194  # 144.367 opcache per 1000 inst
opcache miss         2315040492     #  0.0% opcache miss rate
l1 dTLB miss         31795935       # 0.001 L1 dTLB per 1000 inst
l2 dTLB miss         5675743        # 0.000 L2 dTLB per 1000 inst
instructions         33950996153328 #
icache               5905104655     # 0.174 icache per 1000 inst
icache miss          897406472      # 15.2% icache miss rate
l1 iTLB miss         7905312        # 0.000 L1 iTLB per 1000 inst
l2 iTLB miss         0              # 0.000 L2 iTLB per 1000 inst
tlb flush            19119          # 0.000 TLB flush per 1000 inst
Intel metrics
elapsed              4467.158
on_cpu               0.061          # 0.97 / 16 cores
utime                4342.517
stime                0.608
nvcsw                2027           # 9.04%
nivcsw               20386          # 90.96%
inblock              48             # 0.01/sec
onblock              2416           # 0.54/sec
cpu-clock            4343393637491  # 4343.394 seconds
task-clock           4343415265454  # 4343.415 seconds
page faults          152329         # 35.071/sec
context switches     44509          # 10.247/sec
cpu migrations       1413           # 0.325/sec
major page faults    1              # 0.000/sec
minor page faults    152328         # 35.071/sec
alignment faults     0              # 0.000/sec
emulation faults     0              # 0.000/sec
branches             5050781688168  # 148.766 branches per 1000 inst
branch misses        105902632923   # 2.10% branch miss
conditional          5050781701544  # 148.766 conditional branches per 1000 inst
indirect             209332837884   # 6.166 indirect branches per 1000 inst
slots                98709135518408 #
retiring             36963729109576 # 37.4% (37.4%)
-- ucode             2799260266597  #     2.8%
-- fastpath          34164468842979 #    34.6%
frontend             2241641598206  #  2.3% ( 2.3%) low
-- latency           833581705701   #     0.8%
-- bandwidth         1408059892505  #     1.4%
backend              57810001474260 # 58.6% (58.6%)
-- cpu               47545445041758 #    48.2%
-- memory            10264556432502 #    10.4%
speculation          1590680411824  #  1.6% ( 1.6%)
-- branch mispredict 1587076175543  #     1.6%
-- pipeline restart  3604236281     #     0.0%
smt-contention       0              #  0.0% ( 0.0%)
cpu-cycles           16468750380538 # 0.23 GHz
instructions         33952046966307 # 2.06 IPC
l2 access            11355265062    # 0.334 l2 access per 1000 inst
l2 miss              185670977      # 1.64% l2 miss
cpu-cycles           16465770641254 #  7.9% memory latency
load stalls          1286875525462  #  7.7% l1 bound
l1 miss              11102829142    #  0.1% l2 bound
l2 miss              800643499      #  0.0% l3 bound
l3 miss              306221980      #  0.0% dram bound
store_stalls         6164687781     #  0.0% store bound
Process overview crashed part way through but had the most time in the random_numbers application
260 processes
	  2 random_numbers        1995.58     0.00
	  3 mathlib                607.24     0.00
	  3 ctype                  116.07     0.00
	  3 atol                    90.41     0.00
	 34 clinfo                  10.25     3.00
	 19 vulkaninfo               0.57     0.94
	  2 vulkani:disk$0           0.06     0.10
	  6 clang                    0.06     0.06
	  3 glxinfo:gdrv0            0.05     0.06
	  3 glxinfo:gl0              0.05     0.06
	  1 llvmpipe-0               0.03     0.05
	  1 llvmpipe-1               0.03     0.05
	  1 llvmpipe-10              0.03     0.05
	  1 llvmpipe-11              0.03     0.05
	  1 llvmpipe-12              0.03     0.05
	  1 llvmpipe-13              0.03     0.05
	  1 llvmpipe-14              0.03     0.05
	  1 llvmpipe-15              0.03     0.05
	  1 llvmpipe-2               0.03     0.05
	  1 llvmpipe-3               0.03     0.05
	  1 llvmpipe-4               0.03     0.05
	  1 llvmpipe-5               0.03     0.05
	  1 llvmpipe-6               0.03     0.05
	  1 llvmpipe-7               0.03     0.05
	  1 llvmpipe-8               0.03     0.05
	  1 llvmpipe-9               0.03     0.05
	  1 glxinfo                  0.03     0.02
	  1 glxinfo:cs0              0.03     0.02
	  1 glxinfo:disk$0           0.03     0.02
	  1 glxinfo:sh0              0.03     0.02
	  1 glxinfo:shlo0            0.03     0.02
	  1 ps                       0.00     0.01
	 64 sh                       0.00     0.00
	 13 gcc                      0.00     0.00
	 11 cpp-perf-bench           0.00     0.00
	  8 systemd-detect-          0.00     0.00
	  7 gsettings                0.00     0.00
	  7 stat                     0.00     0.00
	  6 llvm-link                0.00     0.00
	  4 dconf worker             0.00     0.00
	  4 gmain                    0.00     0.00
	  4 phoronix-test-s          0.00     0.00
	  2 which                    0.00     0.00
	  1 cc                       0.00     0.00
	  1 date                     0.00     0.00
	  1 dirname                  0.00     0.00
	  1 grep                     0.00     0.00
	  1 ifconfig                 0.00     0.00
	  1 ip                       0.00     0.00
	  1 lscpu                    0.00     0.00
	  1 mktemp                   0.00     0.00
	  1 qdbus                    0.00     0.00
	  1 readlink                 0.00     0.00
	  1 realpath                 0.00     0.00
	  1 sed                      0.00     0.00
	  1 sort                     0.00     0.00
	  1 stty                     0.00     0.00
	  1 systemctl                0.00     0.00
	  1 template.sh              0.00     0.00
	  1 wc                       0.00     0.00
	  1 xrandr                   0.00     0.00
	  1 xset                     0.00     0.00
11 processes running
47 maximum processes
Random numbers is also where it crashed
      841561) cpp-perf-bench   cpu=9 start=874.16 finish=1871.99
        841562) random_numbers   cpu=3 start=874.16 finish=1871.99
      842462) cpp-perf-bench   cpu=9 start=1876.00 finish=2873.75
        842463) random_numbers   cpu=3 start=1876.00 finish=2873.75
      842636) ?? cpu=0 start=2877.75 finish=0.00
        842637) ?? cpu=0 start=2877.76 finish=0.00