
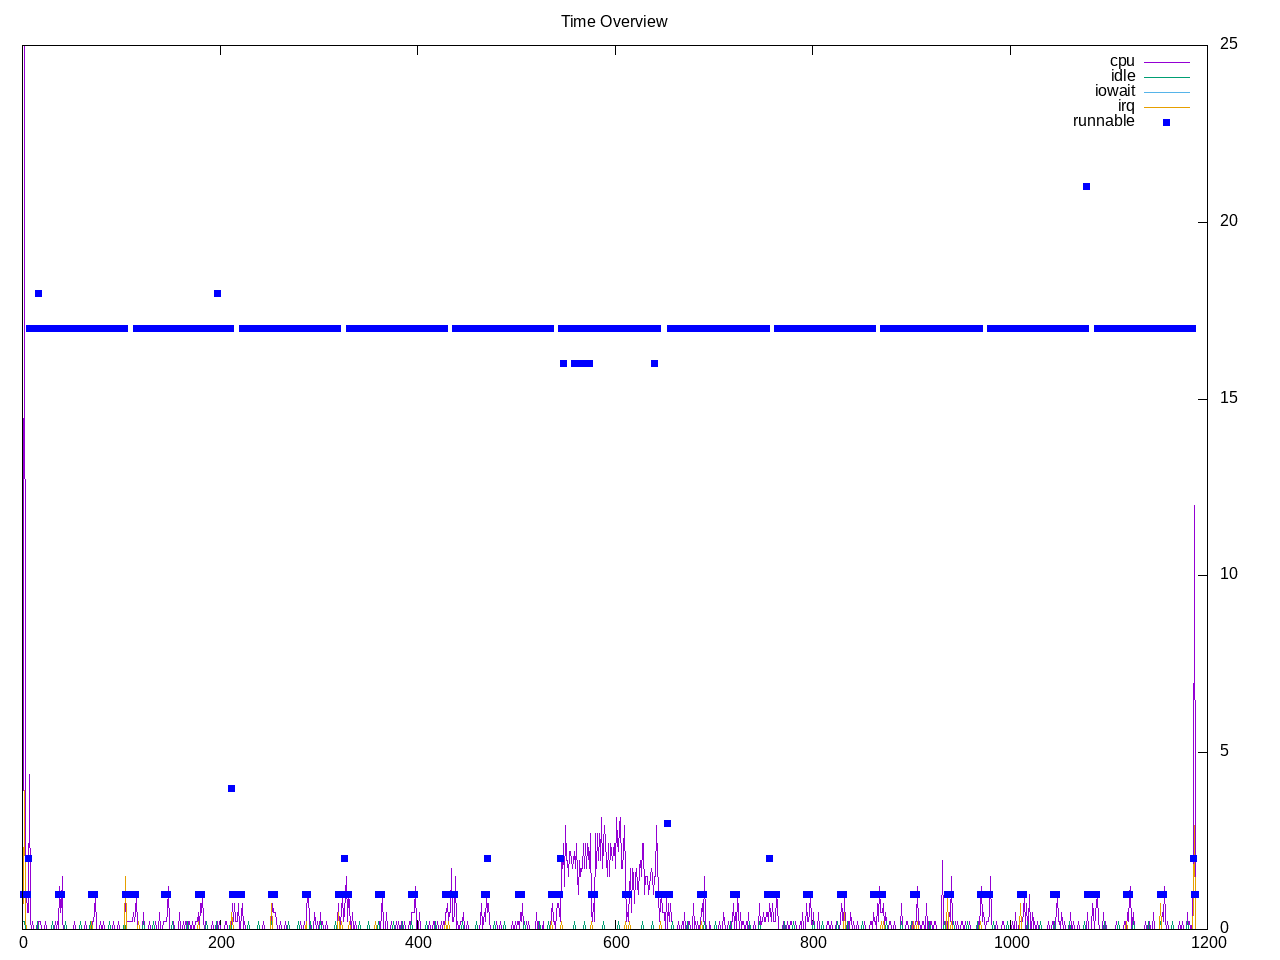
A test of mining crypto currency algorithms. There are 11 different subtests these seem to run on all cores.
Topdown profile varies by workload but generally has a high retirement rate.
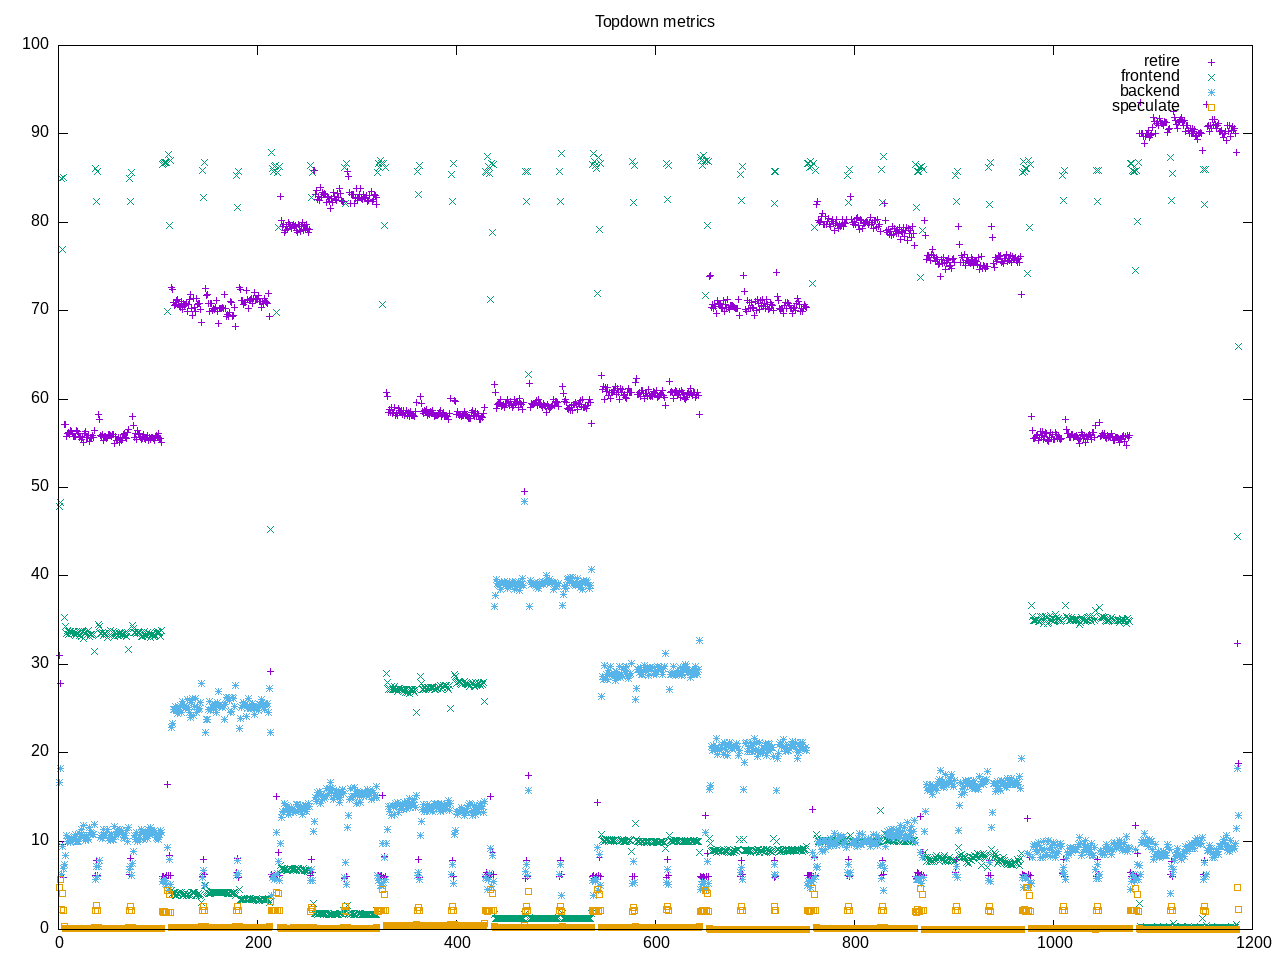
AMD metrics confirm a high retirement rate and low backend stalls. These are heavy users of floating point and have low l2 access.
elapsed              1186.942
on_cpu               0.829          # 13.26 / 16 cores
utime                15726.834
stime                13.029
nvcsw                256859         # 60.07%
nivcsw               170746         # 39.93%
inblock              696            # 0.59/sec
onblock              16936          # 14.27/sec
cpu-clock            15740358273528 # 15740.358 seconds
task-clock           15740514667117 # 15740.515 seconds
page faults          511031         # 32.466/sec
context switches     433255         # 27.525/sec
cpu migrations       926            # 0.059/sec
major page faults    3              # 0.000/sec
minor page faults    511028         # 32.466/sec
alignment faults     0              # 0.000/sec
emulation faults     0              # 0.000/sec
branches             2090369343773  # 14.338 branches per 1000 inst
branch misses        3813560343     # 0.18% branch miss
conditional          1647812055510  # 11.302 conditional branches per 1000 inst
indirect             43048271602    # 0.295 indirect branches per 1000 inst
cpu-cycles           67447012867666 # 3.36 GHz
instructions         153480915748738 # 2.28 IPC
slots                134919266203302 #
retiring             53357281273014 # 39.5% (67.7%) high
-- ucode             6047913102     #     0.0%
-- fastpath          53351233359912 #    39.5%
frontend             11600223754461 #  8.6% (14.7%)
-- latency           6449312850150  #     4.8%
-- bandwidth         5150910904311  #     3.8%
backend              13668219129691 # 10.1% (17.4%) low
-- cpu               6385106468801  #     4.7%
-- memory            7283112660890  #     5.4%
speculation          137310283792   #  0.1% ( 0.2%) low
-- branch mispredict 103973737424   #     0.1%
-- pipeline restart  33336546368    #     0.0%
smt-contention       56155929162151 # 41.6% ( 0.0%)
cpu-cycles           86598124912935 # 3.39 GHz
instructions         194339496558672 # 2.24 IPC
instructions         64776067771495 # 9.871 l2 access per 1000 inst
l2 hit from l1       502652839432   # 1.96% l2 miss
l2 miss from l1      6399129863     #
l2 hit from l2 pf    130677289731   #
l3 hit from l2 pf    6090078866     #
l3 miss from l2 pf   15348144       #
instructions         64773315824514 # 412.281 float per 1000 inst
float 512            105            # 0.000 AVX-512 per 1000 inst
float 256            396            # 0.000 AVX-256 per 1000 inst
float 128            26704775475676 # 412.281 AVX-128 per 1000 inst
float MMX            0              # 0.000 MMX per 1000 inst
float scalar         0              # 0.000 scalar per 1000 inst
instructions         150080388093265 #
opcache              12215943573405 # 81.396 opcache per 1000 inst
opcache miss         2349395900729  # 19.2% opcache miss rate
l1 dTLB miss         9781304650     # 0.065 L1 dTLB per 1000 inst
l2 dTLB miss         59821905       # 0.000 L2 dTLB per 1000 inst
instructions         145591861587551 #
icache               2424868764773  # 16.655 icache per 1000 inst
icache miss          349158176071   # 14.4% icache miss rate
l1 iTLB miss         9568505376     # 0.066 L1 iTLB per 1000 inst
l2 iTLB miss         0              # 0.000 L2 iTLB per 1000 inst
tlb flush            39405          # 0.000 TLB flush per 1000 inst
Intel metrics confirm the high retirement rate and most of the load stalls are in L1.
elapsed              1727.587
on_cpu               0.828          # 13.25 / 16 cores
utime                22841.922
stime                41.821
nvcsw                6141143        # 96.75%
nivcsw               206599         # 3.25%
inblock              21224          # 12.29/sec
onblock              5984           # 3.46/sec
cpu-clock            22880383776525 # 22880.384 seconds
task-clock           22881586483761 # 22881.586 seconds
page faults          659851         # 28.838/sec
context switches     6356052        # 277.780/sec
cpu migrations       1202           # 0.053/sec
major page faults    108            # 0.005/sec
minor page faults    659743         # 28.833/sec
alignment faults     0              # 0.000/sec
emulation faults     0              # 0.000/sec
branches             5064640396537  # 27.581 branches per 1000 inst
branch misses        8449691387     # 0.17% branch miss
conditional          5064640439545  # 27.581 conditional branches per 1000 inst
indirect             2271735861178  # 12.371 indirect branches per 1000 inst
slots                87294144025490 #
retiring             61295422610381 # 70.2% (70.2%) high
-- ucode             741043489965   #     0.8%
-- fastpath          60554379120416 #    69.4%
frontend             22874749087179 # 26.2% (26.2%)
-- latency           16506085956484 #    18.9%
-- bandwidth         6368663130695  #     7.3%
backend              2902802335508  #  3.3% ( 3.3%) low
-- cpu               2302827560561  #     2.6%
-- memory            599974774947   #     0.7%
speculation          201710698859   #  0.2% ( 0.2%) low
-- branch mispredict 175915295288   #     0.2%
-- pipeline restart  25795403571    #     0.0%
smt-contention       0              #  0.0% ( 0.0%)
cpu-cycles           26530424318137 # 1.40 GHz
instructions         55820306624790 # 2.10 IPC
l2 access            240757767124   # 4.314 l2 access per 1000 inst
l2 miss              14209076422    # 5.90% l2 miss
cpu-cycles           26539736731262 #  8.5% memory latency
load stalls          2218592855843  #  7.3% l1 bound
l1 miss              272119502032   #  0.7% l2 bound
l2 miss              93202531099    #  0.3% l3 bound
l3 miss              476989596      #  0.0% dram bound
store_stalls         40924997470    #  0.2% store bound
Process overview shows time spent in the cpuminer driver application.
1028 processes
	594 cpuminer             282960.95   136.17
	 68 clinfo                  17.53     4.65
	 38 vulkaninfo               1.14     1.33
	  6 php                      0.13     0.20
	  4 vulkani:disk$0           0.12     0.14
	  6 glxinfo:gdrv0            0.09     0.10
	  6 glxinfo:gl0              0.09     0.10
	  2 llvmpipe-0               0.06     0.07
	  2 llvmpipe-1               0.06     0.07
	  2 llvmpipe-10              0.06     0.07
	  2 llvmpipe-11              0.06     0.07
	  2 llvmpipe-12              0.06     0.07
	  2 llvmpipe-13              0.06     0.07
	  2 llvmpipe-14              0.06     0.07
	  2 llvmpipe-15              0.06     0.07
	  2 llvmpipe-2               0.06     0.07
	  2 llvmpipe-3               0.06     0.07
	  2 llvmpipe-4               0.06     0.07
	  2 llvmpipe-5               0.06     0.07
	  2 llvmpipe-6               0.06     0.07
	  2 llvmpipe-7               0.06     0.07
	  2 llvmpipe-8               0.06     0.07
	  2 llvmpipe-9               0.06     0.07
	  2 glxinfo                  0.05     0.04
	  2 glxinfo:cs0              0.05     0.04
	  2 glxinfo:disk$0           0.05     0.04
	  2 glxinfo:sh0              0.05     0.04
	  2 glxinfo:shlo0            0.05     0.04
	  6 clang                    0.04     0.08
	  1 lspci                    0.00     0.02
	  1 ps                       0.00     0.01
	102 sh                       0.00     0.00
	 34 grep                     0.00     0.00
	 33 cpuminer-opt             0.00     0.00
	 13 gcc                      0.00     0.00
	 10 gsettings                0.00     0.00
	  8 stat                     0.00     0.00
	  8 systemd-detect-          0.00     0.00
	  6 llvm-link                0.00     0.00
	  5 phoronix-test-s          0.00     0.00
	  4 gmain                    0.00     0.00
	  3 rocminfo                 0.00     0.00
	  2 cc                       0.00     0.00
	  2 dconf worker             0.00     0.00
	  2 lscpu                    0.00     0.00
	  2 uname                    0.00     0.00
	  2 which                    0.00     0.00
	  2 xset                     0.00     0.00
	  1 date                     0.00     0.00
	  1 dirname                  0.00     0.00
	  1 dmesg                    0.00     0.00
	  1 dmidecode                0.00     0.00
	  1 ifconfig                 0.00     0.00
	  1 ip                       0.00     0.00
	  1 lsmod                    0.00     0.00
	  1 mktemp                   0.00     0.00
	  1 qdbus                    0.00     0.00
	  1 readlink                 0.00     0.00
	  1 realpath                 0.00     0.00
	  1 sed                      0.00     0.00
	  1 sort                     0.00     0.00
	  1 stty                     0.00     0.00
	  1 systemctl                0.00     0.00
	  1 template.sh              0.00     0.00
	  1 wc                       0.00     0.00
	  1 xrandr                   0.00     0.00
0 processes running
47 maximum processes
An example of the computation block
      865661) cpuminer-opt     cpu=4 start=6.16  finish=36.12
        865662) cpuminer         cpu=1 start=6.16  finish=36.12
          865664) cpuminer         cpu=6 start=6.17  finish=36.12
          865665) cpuminer         cpu=0 start=6.17  finish=36.12
          865666) cpuminer         cpu=1 start=6.17  finish=36.12
          865667) cpuminer         cpu=2 start=6.17  finish=36.12
          865668) cpuminer         cpu=3 start=6.17  finish=36.12
          865669) cpuminer         cpu=4 start=6.17  finish=36.12
          865670) cpuminer         cpu=5 start=6.17  finish=36.12
          865671) cpuminer         cpu=6 start=6.17  finish=36.12
          865672) cpuminer         cpu=7 start=6.17  finish=36.12
          865673) cpuminer         cpu=8 start=6.17  finish=36.12
          865674) cpuminer         cpu=9 start=6.18  finish=36.12
          865675) cpuminer         cpu=10 start=6.18  finish=36.12
          865676) cpuminer         cpu=11 start=6.18  finish=36.12
          865677) cpuminer         cpu=12 start=6.18  finish=36.12
          865678) cpuminer         cpu=13 start=6.18  finish=36.12
          865679) cpuminer         cpu=14 start=6.18  finish=36.12
          865680) cpuminer         cpu=15 start=6.18  finish=36.12
        865663) grep             cpu=0 start=6.16  finish=36.12