
A C++ library of cryptographic algorithms. There are three subtests. These are single-threaded
Topdown profile shows some blurring over time with sections of strong branch misses and other sections with high retirement rates.
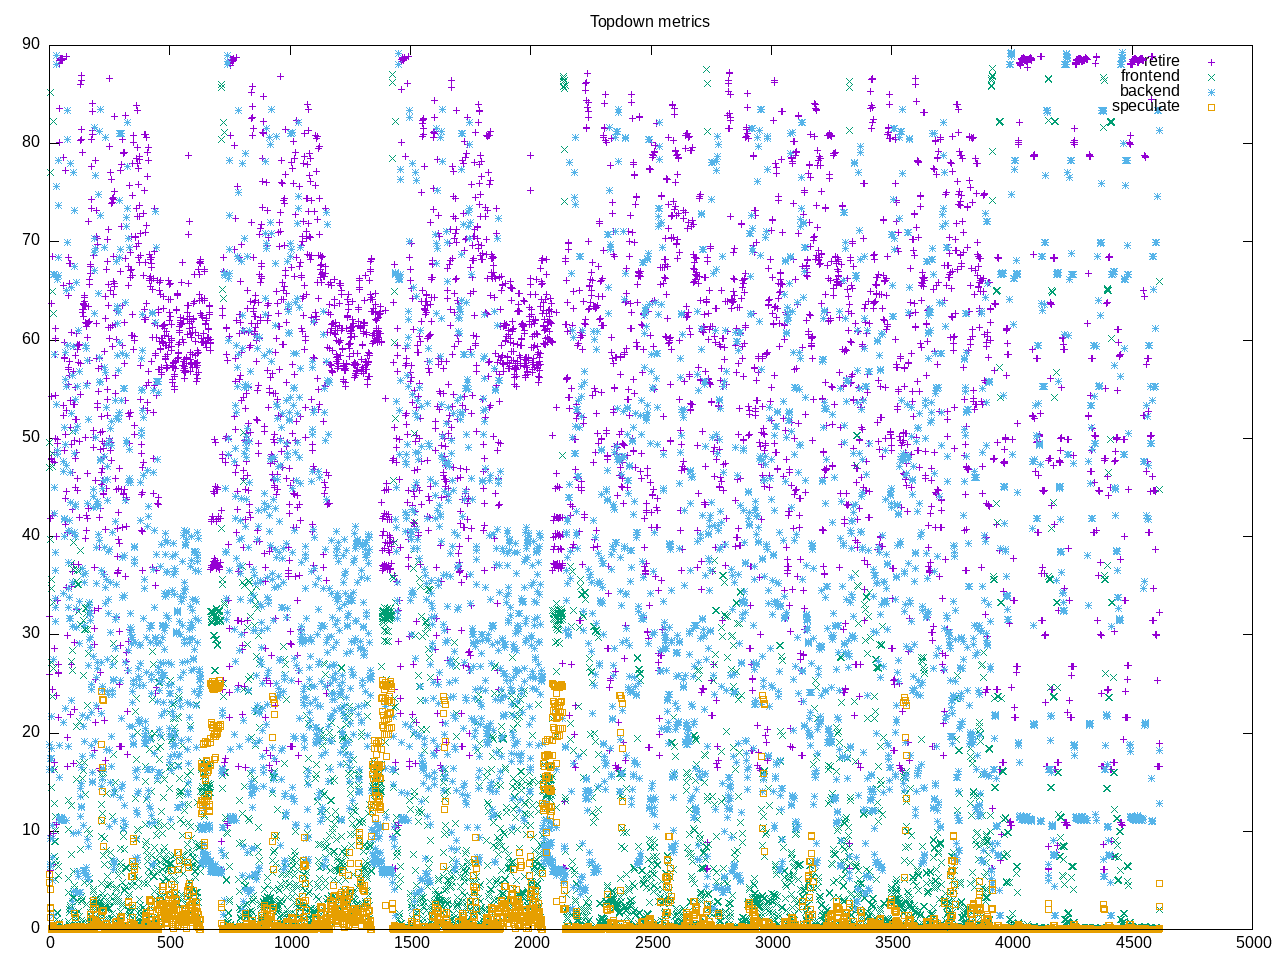
AMD metrics show a composite of time above with a high retirement rate, very low L2 access and moderate floating point.
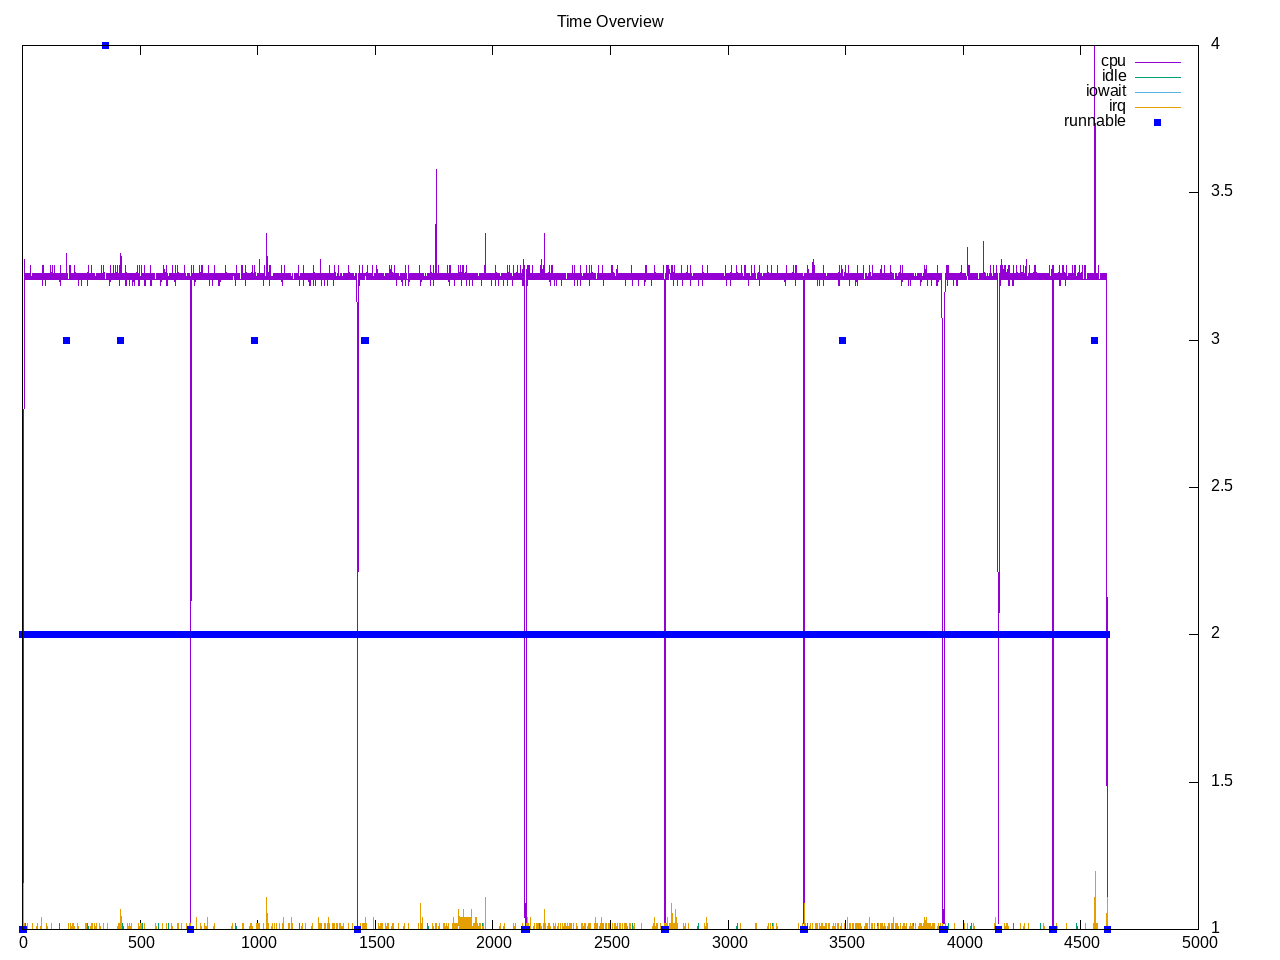
elapsed              4614.176
on_cpu               0.062          # 0.99 / 16 cores
utime                4491.688
stime                71.636
nvcsw                2130           # 8.67%
nivcsw               22440          # 91.33%
inblock              40             # 0.01/sec
onblock              13456          # 2.92/sec
cpu-clock            4563847328027  # 4563.847 seconds
task-clock           4563881396725  # 4563.881 seconds
page faults          154861         # 33.932/sec
context switches     47433          # 10.393/sec
cpu migrations       487            # 0.107/sec
major page faults    2              # 0.000/sec
minor page faults    154859         # 33.931/sec
alignment faults     0              # 0.000/sec
emulation faults     0              # 0.000/sec
branches             5789893124590  # 85.621 branches per 1000 inst
branch misses        31078971808    # 0.54% branch miss
conditional          3613871219875  # 53.442 conditional branches per 1000 inst
indirect             593046133137   # 8.770 indirect branches per 1000 inst
cpu-cycles           21357774623017 # 0.29 GHz
instructions         67329943777452 # 3.15 IPC high
slots                42754788897924 #
retiring             23867981834567 # 55.8% (55.8%) high
-- ucode             136121249997   #     0.3%
-- fastpath          23731860584570 #    55.5%
frontend             3429779846680  #  8.0% ( 8.0%)
-- latency           1720307625228  #     4.0%
-- bandwidth         1709472221452  #     4.0%
backend              14666755989532 # 34.3% (34.3%)
-- cpu               7007591544627  #    16.4%
-- memory            7659164444905  #    17.9%
speculation          788361817288   #  1.8% ( 1.8%)
-- branch mispredict 730229597536   #     1.7%
-- pipeline restart  58132219752    #     0.1%
smt-contention       1908036767     #  0.0% ( 0.0%)
cpu-cycles           21382053512225 # 0.29 GHz
instructions         67482325548422 # 3.16 IPC high
instructions         22516142668079 # 0.409 l2 access per 1000 inst
l2 hit from l1       9043385311     # 0.42% l2 miss
l2 miss from l1      26560619       #
l2 hit from l2 pf    156633725      #
l3 hit from l2 pf    6342843        #
l3 miss from l2 pf   5348991        #
instructions         22477322361631 # 157.699 float per 1000 inst
float 512            70             # 0.000 AVX-512 per 1000 inst
float 256            592            # 0.000 AVX-256 per 1000 inst
float 128            3544660228636  # 157.699 AVX-128 per 1000 inst
float MMX            0              # 0.000 MMX per 1000 inst
float scalar         0              # 0.000 scalar per 1000 inst
instructions         67660090601363 #
opcache              7884274756157  # 116.528 opcache per 1000 inst
opcache miss         167387550460   #  2.1% opcache miss rate
l1 dTLB miss         259601094      # 0.004 L1 dTLB per 1000 inst
l2 dTLB miss         16186847       # 0.000 L2 dTLB per 1000 inst
instructions         67533906040380 #
icache               291969263562   # 4.323 icache per 1000 inst
icache miss          34966057596    # 12.0% icache miss rate
l1 iTLB miss         876689298      # 0.013 L1 iTLB per 1000 inst
l2 iTLB miss         0              # 0.000 L2 iTLB per 1000 inst
tlb flush            17675          # 0.000 TLB flush per 1000 inst
Intel metrics
elapsed              4550.013
on_cpu               0.062          # 0.99 / 16 cores
utime                4448.938
stime                49.145
nvcsw                1993           # 7.90%
nivcsw               23241          # 92.10%
inblock              14968          # 3.29/sec
onblock              2216           # 0.49/sec
cpu-clock            4498416176788  # 4498.416 seconds
task-clock           4498439582280  # 4498.440 seconds
page faults          145439         # 32.331/sec
context switches     47777          # 10.621/sec
cpu migrations       2283           # 0.508/sec
major page faults    90             # 0.020/sec
minor page faults    145349         # 32.311/sec
alignment faults     0              # 0.000/sec
emulation faults     0              # 0.000/sec
branches             5166302482442  # 88.345 branches per 1000 inst
branch misses        19255392592    # 0.37% branch miss
conditional          5166302494794  # 88.345 conditional branches per 1000 inst
indirect             550724717523   # 9.418 indirect branches per 1000 inst
slots                102305511353450 #
retiring             60450511192544 # 59.1% (59.1%) high
-- ucode             6087643284108  #     6.0%
-- fastpath          54362867908436 #    53.1%
frontend             12410187785666 # 12.1% (12.1%)
-- latency           4685028534180  #     4.6%
-- bandwidth         7725159251486  #     7.6%
backend              33429410663649 # 32.7% (32.7%)
-- cpu               21585532615300 #    21.1%
-- memory            11843878048349 #    11.6%
speculation          518853703704   #  0.5% ( 0.5%) low
-- branch mispredict 347239340245   #     0.3%
-- pipeline restart  171614363459   #     0.2%
smt-contention       0              #  0.0% ( 0.0%)
cpu-cycles           17065464664099 # 0.23 GHz
instructions         58523794701375 # 3.43 IPC high
l2 access            15405968960    # 0.263 l2 access per 1000 inst
l2 miss              194271575      # 1.26% l2 miss
cpu-cycles           17064835008985 #  7.0% memory latency
load stalls          1191866350783  #  7.0% l1 bound
l1 miss              3223869244     #  0.0% l2 bound
l2 miss              751143074      #  0.0% l3 bound
l3 miss              309765400      #  0.0% dram bound
store_stalls         917268020      #  0.0% store bound
Process overview shows time spent in the cryptest,exe
244 processes
	  5 cryptest.exe          3265.47    25.39
	 34 clinfo                   9.58     3.34
	 19 vulkaninfo               0.76     0.76
	  2 vulkani:disk$0           0.08     0.08
	  6 clang                    0.07     0.05
	  3 glxinfo:gdrv0            0.04     0.07
	  3 glxinfo:gl0              0.04     0.07
	  1 llvmpipe-0               0.04     0.04
	  1 llvmpipe-1               0.04     0.04
	  1 llvmpipe-10              0.04     0.04
	  1 llvmpipe-11              0.04     0.04
	  1 llvmpipe-12              0.04     0.04
	  1 llvmpipe-13              0.04     0.04
	  1 llvmpipe-14              0.04     0.04
	  1 llvmpipe-15              0.04     0.04
	  1 llvmpipe-2               0.04     0.04
	  1 llvmpipe-3               0.04     0.04
	  1 llvmpipe-4               0.04     0.04
	  1 llvmpipe-5               0.04     0.04
	  1 llvmpipe-6               0.04     0.04
	  1 llvmpipe-7               0.04     0.04
	  1 llvmpipe-8               0.04     0.04
	  1 llvmpipe-9               0.04     0.04
	  1 glxinfo                  0.02     0.03
	  1 glxinfo:cs0              0.02     0.03
	  1 glxinfo:disk$0           0.02     0.03
	  1 glxinfo:sh0              0.02     0.03
	  1 glxinfo:shlo0            0.02     0.03
	 60 sh                       0.00     0.00
	 13 gcc                      0.00     0.00
	 13 gsettings                0.00     0.00
	  8 systemd-detect-          0.00     0.00
	  7 stat                     0.00     0.00
	  6 llvm-link                0.00     0.00
	  5 cryptopp                 0.00     0.00
	  4 phoronix-test-s          0.00     0.00
	  2 gmain                    0.00     0.00
	  2 which                    0.00     0.00
	  1 cc                       0.00     0.00
	  1 date                     0.00     0.00
	  1 dirname                  0.00     0.00
	  1 grep                     0.00     0.00
	  1 ifconfig                 0.00     0.00
	  1 ip                       0.00     0.00
	  1 lscpu                    0.00     0.00
	  1 mktemp                   0.00     0.00
	  1 ps                       0.00     0.00
	  1 qdbus                    0.00     0.00
	  1 readlink                 0.00     0.00
	  1 realpath                 0.00     0.00
	  1 sed                      0.00     0.00
	  1 sort                     0.00     0.00
	  1 stty                     0.00     0.00
	  1 systemctl                0.00     0.00
	  1 template.sh              0.00     0.00
	  1 wc                       0.00     0.00
	  1 xrandr                   0.00     0.00
	  1 xset                     0.00     0.00
11 processes running
47 maximum processes
Example computation block
      872071) cryptopp         cpu=2 start=5.70  finish=711.80
        872072) cryptest.exe     cpu=4 start=5.70  finish=711.80