
A simple test to measure context switch times. These show 304 with CraftyOS, 342 with Ubuntu on AMD and 210 with Ubuntu on Intel. This is a quick running single-threaded test.
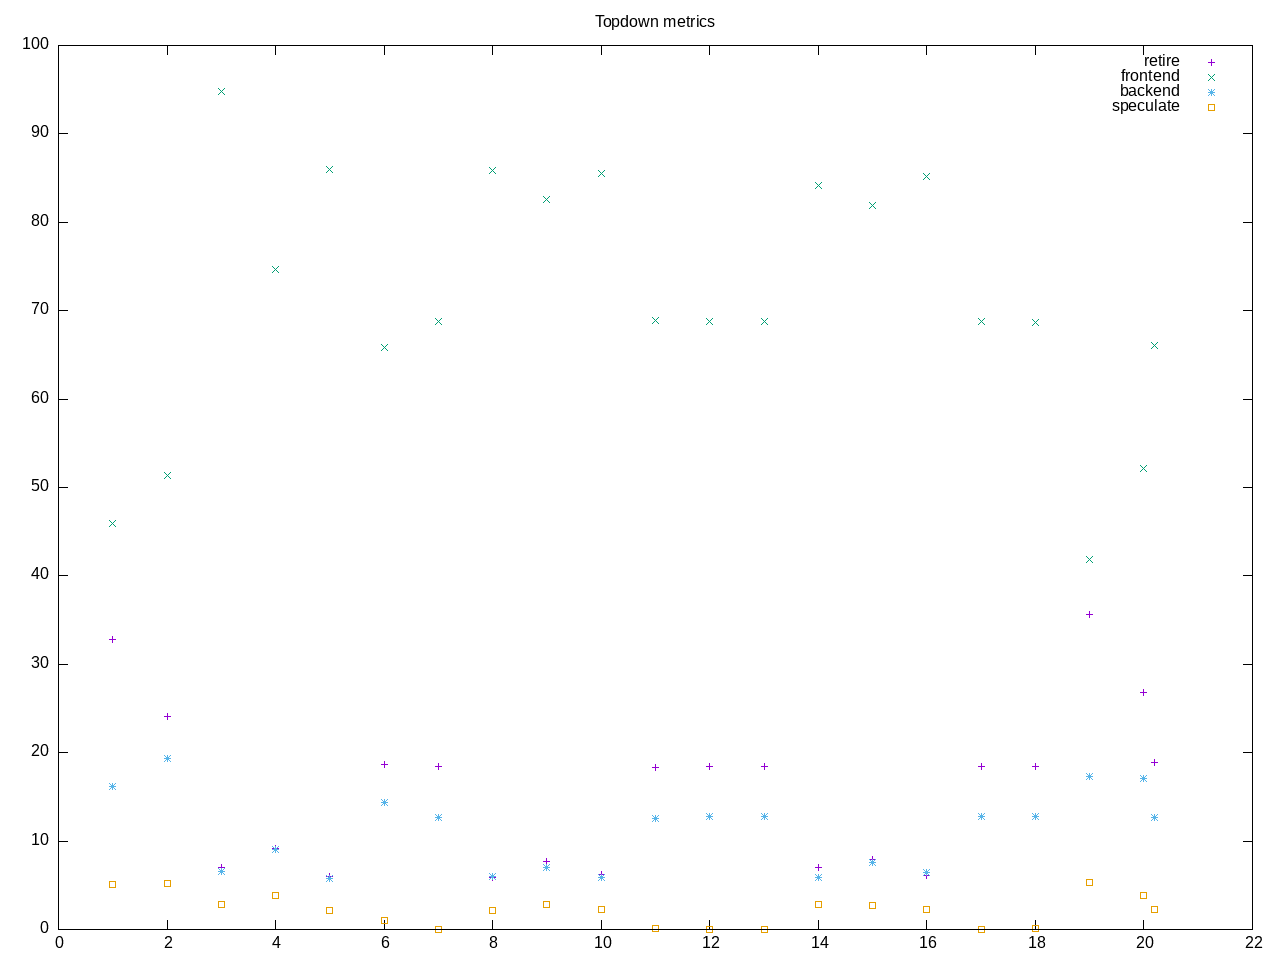
Topdown profile has just a few data points
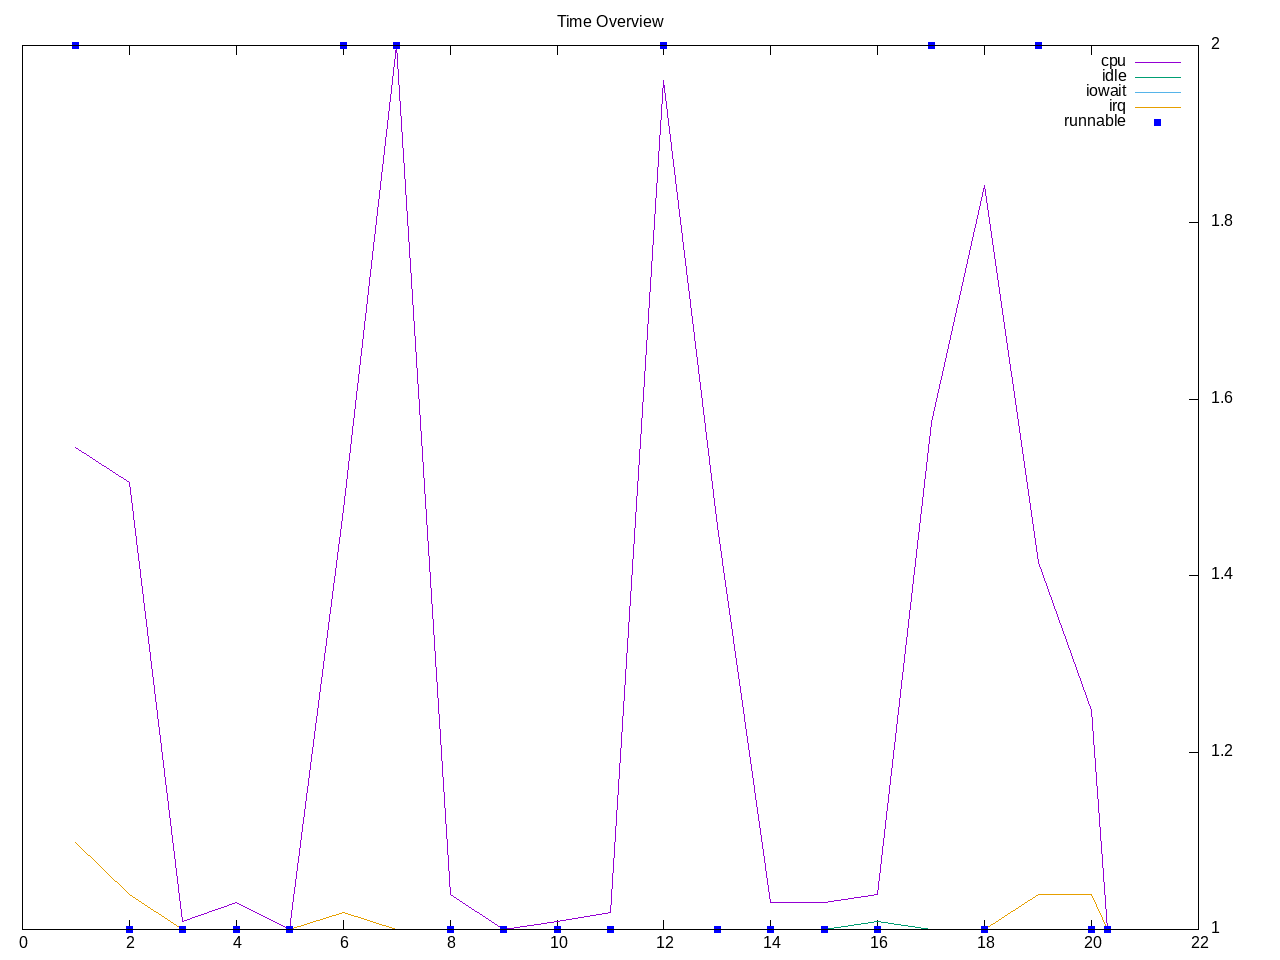
AMD metrics show only 20 seconds total and 0.29 cores, so also a good portion is test overhead.
elapsed              20.054
on_cpu               0.018          # 0.29 / 16 cores
utime                4.042
stime                1.866
nvcsw                1983           # 87.51%
nivcsw               283            # 12.49%
inblock              16             # 0.80/sec
onblock              12544          # 625.52/sec
cpu-clock            5923191652     # 5.923 seconds
task-clock           5925358739     # 5.925 seconds
page faults          140133         # 23649.707/sec
context switches     2208           # 372.636/sec
cpu migrations       256            # 43.204/sec
major page faults    2              # 0.338/sec
minor page faults    140131         # 23649.370/sec
alignment faults     0              # 0.000/sec
emulation faults     0              # 0.000/sec
branches             3629543676     # 199.805 branches per 1000 inst
branch misses        371673029      # 10.24% branch miss
conditional          1807110712     # 99.481 conditional branches per 1000 inst
indirect             75718384       # 4.168 indirect branches per 1000 inst
cpu-cycles           19927118685    # 0.06 GHz
instructions         18009441706    # 0.90 IPC
slots                41533810722    #
retiring             8878414099     # 21.4% (21.4%)
-- ucode             98614793       #     0.2%
-- fastpath          8779799306     #    21.1%
frontend             26228231198    # 63.1% (63.2%) high
-- latency           22577908482    #    54.4%
-- bandwidth         3650322716     #     8.8%
backend              5866295650     # 14.1% (14.1%) low
-- cpu               1052188093     #     2.5%
-- memory            4814107557     #    11.6%
speculation          536345946      #  1.3% ( 1.3%)
-- branch mispredict 535403653      #     1.3%
-- pipeline restart  942293         #     0.0%
smt-contention       24259787       #  0.1% ( 0.0%)
cpu-cycles           19881119763    # 0.06 GHz
instructions         17840215116    # 0.90 IPC
instructions         6060750171     # 17.474 l2 access per 1000 inst
l2 hit from l1       89913971       # 19.00% l2 miss
l2 miss from l1      11199606       #
l2 hit from l2 pf    7069515        #
l3 hit from l2 pf    4232960        #
l3 miss from l2 pf   4690054        #
instructions         6068369854     # 7.045 float per 1000 inst
float 512            67             # 0.000 AVX-512 per 1000 inst
float 256            8              # 0.000 AVX-256 per 1000 inst
float 128            42754042       # 7.045 AVX-128 per 1000 inst
float MMX            0              # 0.000 MMX per 1000 inst
float scalar         0              # 0.000 scalar per 1000 inst
instructions         18108100860    #
opcache              6120325302     # 337.988 opcache per 1000 inst
opcache miss         2693214500     # 44.0% opcache miss rate
l1 dTLB miss         25740136       # 1.421 L1 dTLB per 1000 inst
l2 dTLB miss         4195826        # 0.232 L2 dTLB per 1000 inst
instructions         18080295033    #
icache               6535414495     # 361.466 icache per 1000 inst
icache miss          149961081      #  2.3% icache miss rate
l1 iTLB miss         7771605        # 0.430 L1 iTLB per 1000 inst
l2 iTLB miss         0              # 0.000 L2 iTLB per 1000 inst
tlb flush            14969          # 0.001 TLB flush per 1000 inst
Intel metrics
elapsed              18.250
on_cpu               0.013          # 0.21 / 16 cores
utime                2.545
stime                1.207
nvcsw                1883           # 92.85%
nivcsw               145            # 7.15%
inblock              368            # 20.16/sec
onblock              1312           # 71.89/sec
cpu-clock            3762909328     # 3.763 seconds
task-clock           3765381454     # 3.765 seconds
page faults          136945         # 36369.489/sec
context switches     1949           # 517.610/sec
cpu migrations       247            # 65.598/sec
major page faults    2              # 0.531/sec
minor page faults    136943         # 36368.958/sec
alignment faults     0              # 0.000/sec
emulation faults     0              # 0.000/sec
branches             2890931293     # 177.255 branches per 1000 inst
branch misses        18691925       # 0.65% branch miss
conditional          2890943133     # 177.256 conditional branches per 1000 inst
indirect             80373303       # 4.928 indirect branches per 1000 inst
slots                77725376588    #
retiring             20898113762    # 26.9% (26.9%)
-- ucode             6193687965     #     8.0%
-- fastpath          14704425797    #    18.9%
frontend             22874502550    # 29.4% (29.4%)
-- latency           12004279543    #    15.4%
-- bandwidth         10870223007    #    14.0%
backend              31453841215    # 40.5% (40.5%)
-- cpu               26097993769    #    33.6%
-- memory            5355847446     #     6.9%
speculation          2567763043     #  3.3% ( 3.3%)
-- branch mispredict 2409561026     #     3.1%
-- pipeline restart  158202017      #     0.2%
smt-contention       0              #  0.0% ( 0.0%)
cpu-cycles           12974231376    # 0.05 GHz
instructions         15984695138    # 1.23 IPC
l2 access            250615984      # 15.719 l2 access per 1000 inst
l2 miss              78419869       # 31.29% l2 miss
cpu-cycles           13129389639    # 11.0% memory latency
load stalls          1364727104     #  5.0% l1 bound
l1 miss              703062088      #  2.7% l2 bound
l2 miss              350707746      #  0.8% l3 bound
l3 miss              251978924      #  1.9% dram bound
store_stalls         80035758       #  0.6% store bound
Process overview shows more time in Phoronix test suite routines than in the ctx_clock executable
354 processes
	 68 clinfo                  18.85     6.28
	  3 ctx_clock                3.04     1.11
	 38 vulkaninfo               1.33     1.33
	  4 vulkani:disk$0           0.14     0.14
	  6 glxinfo:gdrv0            0.11     0.11
	  6 glxinfo:gl0              0.11     0.11
	  6 php                      0.08     0.06
	  2 llvmpipe-0               0.07     0.07
	  2 llvmpipe-1               0.07     0.07
	  2 llvmpipe-10              0.07     0.07
	  2 llvmpipe-11              0.07     0.07
	  2 llvmpipe-12              0.07     0.07
	  2 llvmpipe-13              0.07     0.07
	  2 llvmpipe-14              0.07     0.07
	  2 llvmpipe-15              0.07     0.07
	  2 llvmpipe-2               0.07     0.07
	  2 llvmpipe-3               0.07     0.07
	  2 llvmpipe-4               0.07     0.07
	  2 llvmpipe-5               0.07     0.07
	  2 llvmpipe-6               0.07     0.07
	  2 llvmpipe-7               0.07     0.07
	  2 llvmpipe-8               0.07     0.07
	  2 llvmpipe-9               0.07     0.07
	  2 glxinfo                  0.05     0.05
	  2 glxinfo:cs0              0.05     0.05
	  2 glxinfo:disk$0           0.05     0.05
	  2 glxinfo:sh0              0.05     0.05
	  2 glxinfo:shlo0            0.05     0.05
	  6 clang                    0.04     0.08
	  1 lspci                    0.01     0.01
	  3 rocminfo                 0.00     0.01
	  1 ps                       0.00     0.01
	 82 sh                       0.00     0.00
	 13 gcc                      0.00     0.00
	 12 gsettings                0.00     0.00
	  8 stat                     0.00     0.00
	  8 systemd-detect-          0.00     0.00
	  6 llvm-link                0.00     0.00
	  5 phoronix-test-s          0.00     0.00
	  3 ctx-clock                0.00     0.00
	  3 gmain                    0.00     0.00
	  2 cc                       0.00     0.00
	  2 lscpu                    0.00     0.00
	  2 uname                    0.00     0.00
	  2 which                    0.00     0.00
	  2 xset                     0.00     0.00
	  1 date                     0.00     0.00
	  1 dconf worker             0.00     0.00
	  1 dirname                  0.00     0.00
	  1 dmesg                    0.00     0.00
	  1 dmidecode                0.00     0.00
	  1 grep                     0.00     0.00
	  1 ifconfig                 0.00     0.00
	  1 ip                       0.00     0.00
	  1 lsmod                    0.00     0.00
	  1 mktemp                   0.00     0.00
	  1 qdbus                    0.00     0.00
	  1 readlink                 0.00     0.00
	  1 realpath                 0.00     0.00
	  1 sed                      0.00     0.00
	  1 sort                     0.00     0.00
	  1 stty                     0.00     0.00
	  1 systemctl                0.00     0.00
	  1 template.sh              0.00     0.00
	  1 wc                       0.00     0.00
	  1 xrandr                   0.00     0.00
0 processes running
47 maximum processes
Computation structure shows ~1.4 seconds per invocation
      875082) ctx-clock        cpu=1 start=5.60  finish=6.97
        875083) ctx_clock        cpu=4 start=5.60  finish=6.97
      875084) ctx-clock        cpu=8 start=10.97 finish=12.38
        875085) ctx_clock        cpu=9 start=10.98 finish=12.38
      875088) ctx-clock        cpu=0 start=16.39 finish=17.79
        875089) ctx_clock        cpu=9 start=16.39 finish=17.79