
A package computing discrete fourier transforms. Overall a quick running test.
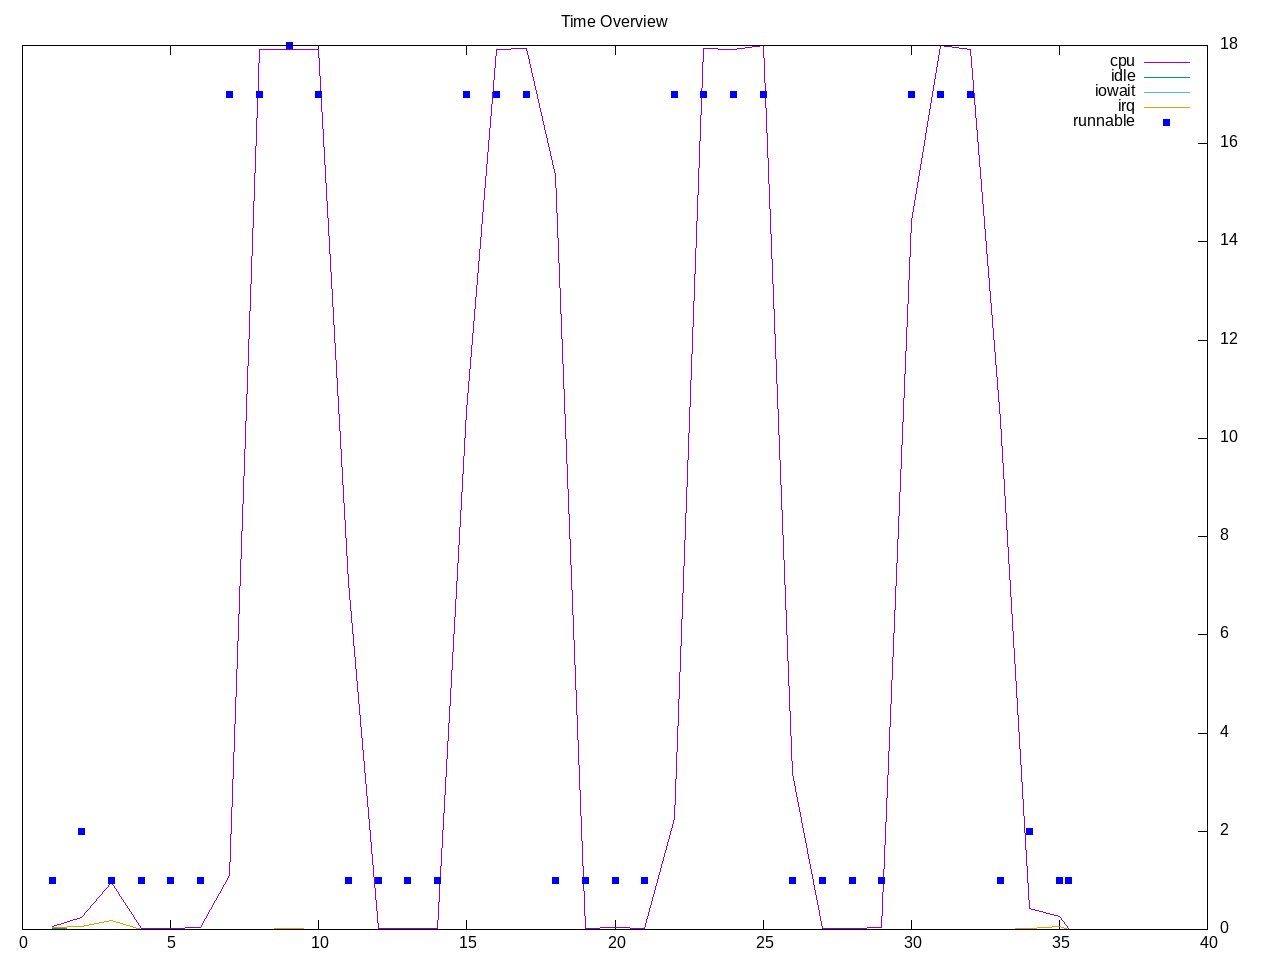
Topdown profile doesn’t have many data points but shows somewhat high backend stalls.
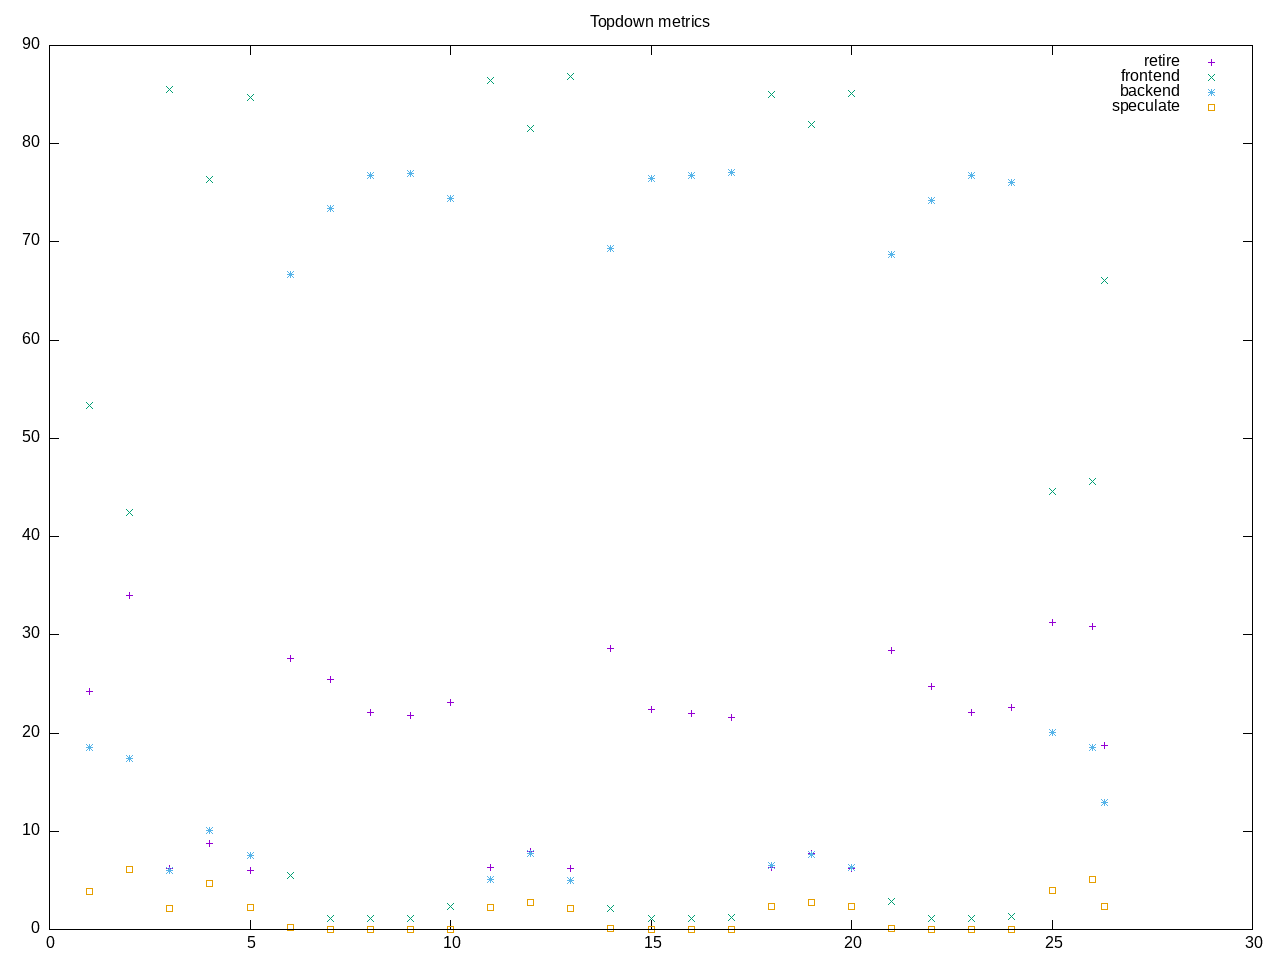
AMD metrics confirm the backend stalls. The rest of the code has a lot of floating point and low frontend stalls.
elapsed              28.735
on_cpu               0.357          # 5.72 / 16 cores
utime                162.839
stime                1.511
nvcsw                2031           # 48.45%
nivcsw               2161           # 51.55%
inblock              0              # 0.00/sec
onblock              12576          # 437.65/sec
cpu-clock            164440980158   # 164.441 seconds
task-clock           164446588922   # 164.447 seconds
page faults          344700         # 2096.121/sec
context switches     4162           # 25.309/sec
cpu migrations       267            # 1.624/sec
major page faults    2              # 0.012/sec
minor page faults    344698         # 2096.109/sec
alignment faults     0              # 0.000/sec
emulation faults     0              # 0.000/sec
branches             22525014483    # 29.306 branches per 1000 inst
branch misses        142525357      # 0.63% branch miss
conditional          21315112292    # 27.731 conditional branches per 1000 inst
indirect             46909573       # 0.061 indirect branches per 1000 inst
cpu-cycles           645340177349   # 1.47 GHz
instructions         766939873997   # 1.19 IPC
slots                1295578399398  #
retiring             253149782597   # 19.5% (23.4%)
-- ucode             63790386       #     0.0%
-- fastpath          253085992211   #    19.5%
frontend             18599786075    #  1.4% ( 1.7%) low
-- latency           15794612688    #     1.2%
-- bandwidth         2805173387     #     0.2%
backend              808271511988   # 62.4% (74.8%) high
-- cpu               255543083595   #    19.7%
-- memory            552728428393   #    42.7%
speculation          975977428      #  0.1% ( 0.1%) low
-- branch mispredict 930800943      #     0.1%
-- pipeline restart  45176485       #     0.0%
smt-contention       214580577475   # 16.6% ( 0.0%)
cpu-cycles           643126094843   # 1.49 GHz
instructions         769855395585   # 1.20 IPC
instructions         254848664760   # 26.837 l2 access per 1000 inst
l2 hit from l1       5626317105     # 27.97% l2 miss
l2 miss from l1      1342573404     #
l2 hit from l2 pf    642580883      #
l3 hit from l2 pf    236038076      #
l3 miss from l2 pf   334478930      #
instructions         256599436858   # 606.108 float per 1000 inst
float 512            56             # 0.000 AVX-512 per 1000 inst
float 256            626            # 0.000 AVX-256 per 1000 inst
float 128            155527078471   # 606.108 AVX-128 per 1000 inst
float MMX            0              # 0.000 MMX per 1000 inst
float scalar         0              # 0.000 scalar per 1000 inst
instructions         768061234133   #
opcache              68672979636    # 89.411 opcache per 1000 inst
opcache miss         1051822848     #  1.5% opcache miss rate
l1 dTLB miss         1192723295     # 1.553 L1 dTLB per 1000 inst
l2 dTLB miss         471669429      # 0.614 L2 dTLB per 1000 inst
instructions         768451506345   #
icache               1985334320     # 2.584 icache per 1000 inst
icache miss          244207249      # 12.3% icache miss rate
l1 iTLB miss         9159987        # 0.012 L1 iTLB per 1000 inst
l2 iTLB miss         0              # 0.000 L2 iTLB per 1000 inst
tlb flush            16882          # 0.000 TLB flush per 1000 inst
Intel metrics confirm the dram stalls.
elapsed              24.293
on_cpu               0.389          # 6.22 / 16 cores
utime                149.928
stime                1.105
nvcsw                1443           # 48.36%
nivcsw               1541           # 51.64%
inblock              1584           # 65.20/sec
onblock              1128           # 46.43/sec
cpu-clock            151138846294   # 151.139 seconds
task-clock           151141771739   # 151.142 seconds
page faults          326444         # 2159.853/sec
context switches     2928           # 19.373/sec
cpu migrations       254            # 1.681/sec
major page faults    9              # 0.060/sec
minor page faults    326434         # 2159.787/sec
alignment faults     0              # 0.000/sec
emulation faults     0              # 0.000/sec
branches             22322682452    # 29.078 branches per 1000 inst
branch misses        65479584       # 0.29% branch miss
conditional          22322694676    # 29.078 conditional branches per 1000 inst
indirect             9267166486     # 12.072 indirect branches per 1000 inst
slots                826186570826   #
retiring             379324008162   # 45.9% (45.9%)
-- ucode             4477105158     #     0.5%
-- fastpath          374846903004   #    45.4%
frontend             83216234818    # 10.1% (10.1%)
-- latency           70320222173    #     8.5%
-- bandwidth         12896012645    #     1.6%
backend              358420851091   # 43.4% (43.4%)
-- cpu               169928088458   #    20.6%
-- memory            188492762633   #    22.8%
speculation          5807426002     #  0.7% ( 0.7%) low
-- branch mispredict 5507934937     #     0.7%
-- pipeline restart  299491065      #     0.0%
smt-contention       0              #  0.0% ( 0.0%)
cpu-cycles           272415717150   # 0.70 GHz
instructions         388269199233   # 1.43 IPC
l2 access            8466469743     # 21.811 l2 access per 1000 inst
l2 miss              2813444552     # 33.23% l2 miss
cpu-cycles           272455895543   # 38.5% memory latency
load stalls          92399258775    #  4.7% l1 bound
l1 miss              79638938324    #  5.8% l2 bound
l2 miss              63787703172    #  4.1% l3 bound
l3 miss              52617857012    # 19.3% dram bound
store_stalls         12418643836    #  4.6% store bound
Process summary gives name of the benchmark thread as speed3d
402 processes
	 48 speed3d               2605.28     9.12
	 68 clinfo                  17.13     5.66
	 38 vulkaninfo               1.30     1.34
	  4 vulkani:disk$0           0.13     0.15
	  6 php                      0.08     0.05
	  2 llvmpipe-0               0.07     0.08
	  2 llvmpipe-1               0.07     0.08
	  2 llvmpipe-10              0.07     0.08
	  2 llvmpipe-11              0.07     0.08
	  2 llvmpipe-12              0.07     0.08
	  2 llvmpipe-13              0.07     0.08
	  2 llvmpipe-14              0.07     0.08
	  2 llvmpipe-15              0.07     0.08
	  2 llvmpipe-2               0.07     0.08
	  2 llvmpipe-3               0.07     0.08
	  2 llvmpipe-4               0.07     0.08
	  2 llvmpipe-5               0.07     0.08
	  2 llvmpipe-6               0.07     0.08
	  2 llvmpipe-7               0.07     0.08
	  2 llvmpipe-8               0.07     0.08
	  2 llvmpipe-9               0.07     0.08
	  6 glxinfo:gdrv0            0.06     0.13
	  6 glxinfo:gl0              0.06     0.13
	  6 clang                    0.04     0.08
	  2 glxinfo                  0.04     0.05
	  2 glxinfo:cs0              0.04     0.05
	  2 glxinfo:disk$0           0.04     0.05
	  2 glxinfo:sh0              0.04     0.05
	  2 glxinfo:shlo0            0.04     0.05
	  3 rocminfo                 0.00     0.03
	  1 lspci                    0.00     0.03
	 82 sh                       0.00     0.00
	 13 gcc                      0.00     0.00
	 13 gsettings                0.00     0.00
	  8 stat                     0.00     0.00
	  8 systemd-detect-          0.00     0.00
	  6 ffte                     0.00     0.00
	  6 llvm-link                0.00     0.00
	  5 phoronix-test-s          0.00     0.00
	  2 cc                       0.00     0.00
	  2 gmain                    0.00     0.00
	  2 lscpu                    0.00     0.00
	  2 uname                    0.00     0.00
	  2 which                    0.00     0.00
	  2 xset                     0.00     0.00
	  1 date                     0.00     0.00
	  1 dconf worker             0.00     0.00
	  1 dirname                  0.00     0.00
	  1 dmesg                    0.00     0.00
	  1 dmidecode                0.00     0.00
	  1 grep                     0.00     0.00
	  1 ifconfig                 0.00     0.00
	  1 ip                       0.00     0.00
	  1 lsmod                    0.00     0.00
	  1 mktemp                   0.00     0.00
	  1 ps                       0.00     0.00
	  1 qdbus                    0.00     0.00
	  1 readlink                 0.00     0.00
	  1 realpath                 0.00     0.00
	  1 sed                      0.00     0.00
	  1 sort                     0.00     0.00
	  1 stty                     0.00     0.00
	  1 systemctl                0.00     0.00
	  1 template.sh              0.00     0.00
	  1 wc                       0.00     0.00
	  1 xrandr                   0.00     0.00
0 processes running
47 maximum processes
Computation blocks
      1032593) ffte             cpu=9 start=5.82  finish=9.27
        1032594) ffte             cpu=3 start=5.82  finish=5.82
        1032595) speed3d          cpu=6 start=5.82  finish=9.26
          1032596) speed3d          cpu=7 start=5.82  finish=9.26
          1032597) speed3d          cpu=12 start=5.82  finish=9.26
          1032598) speed3d          cpu=10 start=5.82  finish=9.26
          1032599) speed3d          cpu=0 start=5.82  finish=9.26
          1032600) speed3d          cpu=13 start=5.82  finish=9.26
          1032601) speed3d          cpu=9 start=5.82  finish=9.26
          1032602) speed3d          cpu=11 start=5.82  finish=9.26
          1032603) speed3d          cpu=14 start=5.83  finish=9.26
          1032604) speed3d          cpu=8 start=5.83  finish=9.26
          1032605) speed3d          cpu=4 start=5.83  finish=9.26
          1032606) speed3d          cpu=2 start=5.83  finish=9.26
          1032607) speed3d          cpu=5 start=5.83  finish=9.26
          1032608) speed3d          cpu=15 start=5.83  finish=9.26
          1032609) speed3d          cpu=1 start=5.83  finish=9.26
          1032610) speed3d          cpu=3 start=5.83  finish=9.26