
Open Radio Access Network (ORAN) solution to build software-defined radio. There are four workloads The first two workloads look to be parallel, the last two are sequential.

Topdown profile shows each worload with slightly different profile. The first two have half of time spent with backend stalls and a ~40% retirement rate. The third has a higher retirement rate and the last is closer to 50% retirement rate.
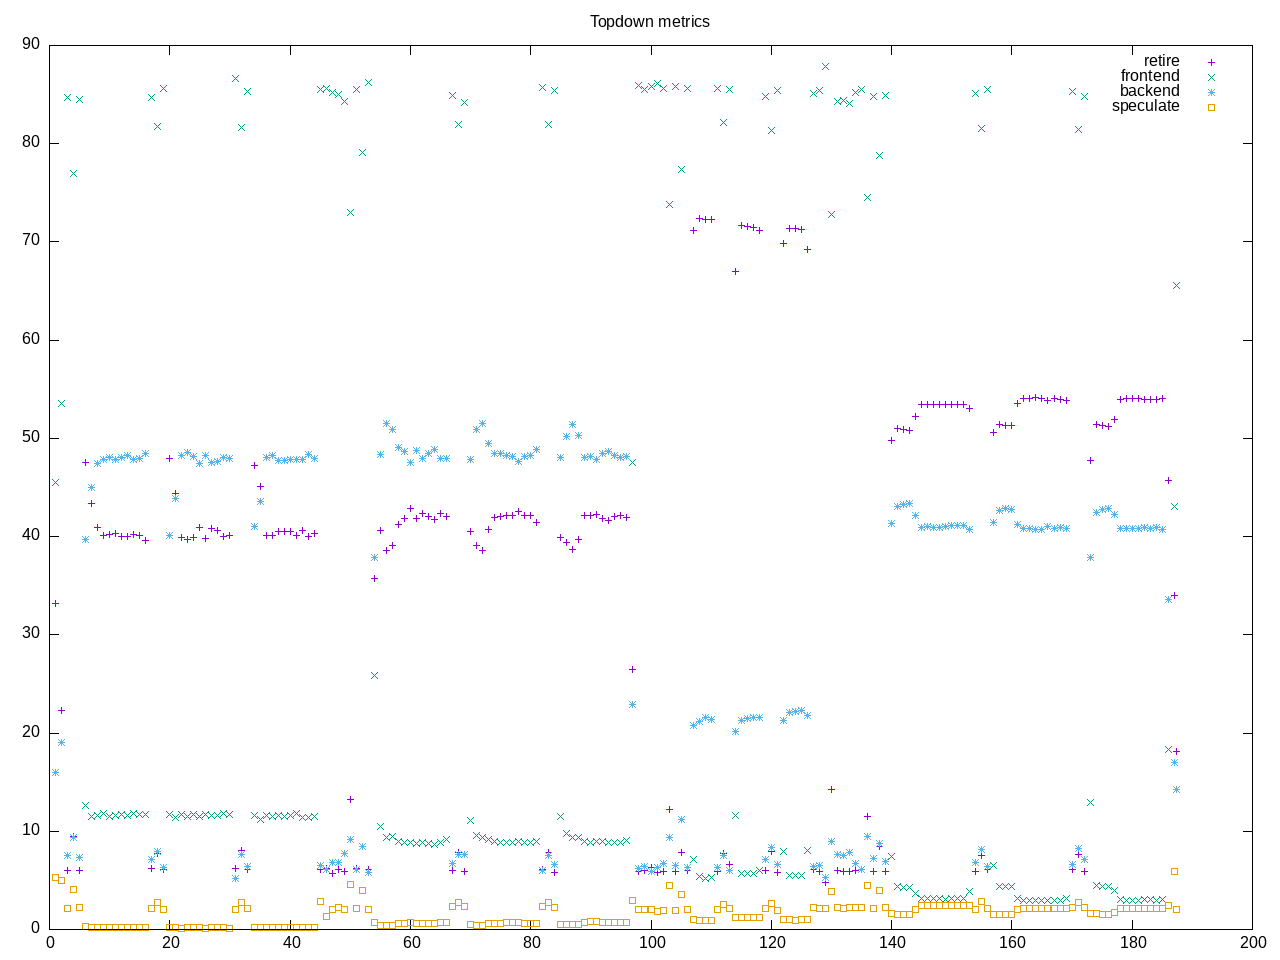
AMD metrics confirm a ~40% retirement rate overall and a higher backend stalls. This has some floating point but not much.
elapsed              184.315
on_cpu               0.304          # 4.86 / 16 cores
utime                858.389
stime                37.924
nvcsw                7080326        # 97.64%
nivcsw               171397         # 2.36%
inblock              16             # 0.09/sec
onblock              18120          # 98.31/sec
cpu-clock            888938811651   # 888.939 seconds
task-clock           891136487519   # 891.136 seconds
page faults          325548         # 365.318/sec
context switches     7252444        # 8138.421/sec
cpu migrations       3043963        # 3415.821/sec
major page faults    20             # 0.022/sec
minor page faults    325528         # 365.295/sec
alignment faults     0              # 0.000/sec
emulation faults     0              # 0.000/sec
branches             1115058070415  # 168.313 branches per 1000 inst
branch misses        2159669589     # 0.19% branch miss
conditional          1031833810350  # 155.751 conditional branches per 1000 inst
indirect             12837134731    # 1.938 indirect branches per 1000 inst
cpu-cycles           3384434849412  # 1.15 GHz
instructions         6634137352435  # 1.96 IPC
slots                6739184752614  #
retiring             2175581102386  # 32.3% (42.1%)
-- ucode             3289331883     #     0.0%
-- fastpath          2172291770503  #    32.2%
frontend             517226906119   #  7.7% (10.0%)
-- latency           238154875566   #     3.5%
-- bandwidth         279072030553   #     4.1%
backend              2445323400774  # 36.3% (47.4%)
-- cpu               881640170675   #    13.1%
-- memory            1563683230099  #    23.2%
speculation          25160402672    #  0.4% ( 0.5%) low
-- branch mispredict 22567719323    #     0.3%
-- pipeline restart  2592683349     #     0.0%
smt-contention       1575202293052  # 23.4% ( 0.0%)
cpu-cycles           3373182492320  # 1.15 GHz
instructions         6633293431705  # 1.97 IPC
instructions         2207163897959  # 37.149 l2 access per 1000 inst
l2 hit from l1       57435278307    # 7.04% l2 miss
l2 miss from l1      1601444587     #
l2 hit from l2 pf    20391479329    #
l3 hit from l2 pf    2534642588     #
l3 miss from l2 pf   1633034321     #
instructions         2203789809437  # 39.588 float per 1000 inst
float 512            53             # 0.000 AVX-512 per 1000 inst
float 256            2743661914     # 1.245 AVX-256 per 1000 inst
float 128            84500288655    # 38.343 AVX-128 per 1000 inst
float MMX            0              # 0.000 MMX per 1000 inst
float scalar         0              # 0.000 scalar per 1000 inst
instructions         6624926556106  #
opcache              666508147179   # 100.606 opcache per 1000 inst
opcache miss         19798144485    #  3.0% opcache miss rate
l1 dTLB miss         1809004813     # 0.273 L1 dTLB per 1000 inst
l2 dTLB miss         149171427      # 0.023 L2 dTLB per 1000 inst
instructions         6804331263951  #
icache               34604771673    # 5.086 icache per 1000 inst
icache miss          7194374108     # 20.8% icache miss rate
l1 iTLB miss         82777390       # 0.012 L1 iTLB per 1000 inst
l2 iTLB miss         0              # 0.000 L2 iTLB per 1000 inst
tlb flush            23454          # 0.000 TLB flush per 1000 inst
Intel version appears to hang. It is unclear why. No entries in syslog and there is enough memory
mev@hobart:~$ free
               total        used        free      shared  buff/cache   available
Mem:        16128408     1411212    10187172      868684     4530024    13537592
Swap:        2097148           0     2097148
It is in the second workload after having run multiple versions already
srsRAN Project 23.10.1-20240219:
    pts/srsran-2.2.0 [Test: PUSCH Processor Benchmark, Throughput Total]
    Test 2 of 4
    Estimated Trial Run Count:    3
    Estimated Test Run-Time:      1 Minute
    Estimated Time To Completion: 3 Minutes [14:14 CDT]
        Started Run 1 @ 14:12:10
        Started Run 2 @ 14:12:30
        Started Run 3 @ 14:12:51
        Started Run 4 @ 14:13:12 *
        Started Run 5 @ 14:13:34 *
        Started Run 6 @ 14:13:55 *
        Started Run 7 @ 14:14:17 *
        Started Run 8 @ 14:14:38 *
        Started Run 9 @ 14:15:00 *
        Started Run 10 @ 14:15:21 *
        Started Run 11 @ 14:15:43 *
        Started Run 12 @ 14:16:04 *
        Started Run 13 @ 14:16:25 *
        Started Run 14 @ 14:16:47 *
Nothing immediately obvious from the thread profile – all the children of the pusch-processor_benchmark appear to have exited but the parent still appears to be hung.
mev         5831    3627  0 14:11 pts/0    00:00:00           /bin/bash ./run_test.sh
mev         5833    5831  0 14:11 pts/0    00:00:00             /home/mev/source/wspy/wspy -o software.branch.txt --rusage --software --branch --no-ipc phoronix-test-suite batch-run srsran
mev         5835    5833  0 14:11 pts/0    00:00:00               /bin/sh /usr/bin/phoronix-test-suite batch-run srsran
mev         5848    5835  0 14:11 pts/0    00:00:00                 sh -c  php /usr/share/phoronix-test-suite//pts-core/phoronix-test-suite.php batch-run srsran
mev         5849    5848  0 14:11 pts/0    00:00:00                   Phoronix Test Suite
mev         5880    5849  0 14:11 pts/0    00:00:00                     sh -c php -S localhost:8211 -t /usr/share/phoronix-test-suite/pts-core/static/dynamic-result-viewer/
mev         5881    5880  0 14:11 pts/0    00:00:00                       php -S localhost:8211 -t /usr/share/phoronix-test-suite/pts-core/static/dynamic-result-viewer/
mev         5882    5881  0 14:11 pts/0    00:00:00                         php -S localhost:8211 -t /usr/share/phoronix-test-suite/pts-core/static/dynamic-result-viewer/
mev         5883    5881  0 14:11 pts/0    00:00:00                         php -S localhost:8211 -t /usr/share/phoronix-test-suite/pts-core/static/dynamic-result-viewer/
mev         5884    5881  0 14:11 pts/0    00:00:00                         php -S localhost:8211 -t /usr/share/phoronix-test-suite/pts-core/static/dynamic-result-viewer/
mev         5885    5881  0 14:11 pts/0    00:00:00                         php -S localhost:8211 -t /usr/share/phoronix-test-suite/pts-core/static/dynamic-result-viewer/
mev         6686    5849  0 14:16 pts/0    00:00:00                     /bin/sh ./srsran tests/benchmarks/phy/upper/channel_processors/pusch/pusch_processor_benchmark -m throughput_total -R 100 -B 10 -P pusch_scs30_100MHz_256qam_max
mev         6687    6686 46 14:16 pts/0    00:07:14                       ./tests/benchmarks/phy/upper/channel_processors/pusch/pusch_processor_benchmark -m throughput_total -R 100 -B 10 -P pusch_scs30_100MHz_256qam_max
mev         5834    5831  0 14:11 pts/0    00:00:00             tee intel.srsran.out
Process overview gives explicitly named threads
55 processes
	 18 thread_0               959.10    34.70
	  9 thread_1               898.78    33.68
	  9 thread_11              898.78    33.68
	  9 thread_12              898.78    33.68
	  9 thread_13              898.78    33.68
	  9 thread_14              898.78    33.68
	  9 thread_2               898.78    33.68
	  9 thread_3               898.78    33.68
	  9 thread_4               898.78    33.68
	  9 thread_5               898.78    33.68
	  9 thread_6               898.78    33.68
	  9 thread_7               898.78    33.68
	  9 thread_8               898.78    33.68
	  9 thread_9               898.78    33.68
	  9 thread_10              898.77    33.68
	  9 thread_15              898.77    33.68
	  6 pdsch_processor        471.26     4.86
	  6 pusch_processor        370.21    23.42
	  3 decoder#0              332.26    22.85
	  3 decoder#1              332.26    22.85
	  3 decoder#2              332.26    22.85
	  3 decoder#3              332.26    22.85
	  3 decoder#4              332.26    22.85
	  3 decoder#5              332.26    22.85
	  3 decoder#6              332.26    22.85
	  3 decoder#7              332.26    22.85
	 68 clinfo                  15.86     6.99
	 38 vulkaninfo               0.94     1.52
	  4 vulkani:disk$0           0.10     0.16
	  6 glxinfo:gdrv0            0.09     0.06
	  6 glxinfo:gl0              0.09     0.06
	  6 php                      0.07     0.11
	  2 glxinfo                  0.06     0.02
	  2 llvmpipe-0               0.05     0.08
	  2 llvmpipe-1               0.05     0.08
	  2 llvmpipe-10              0.05     0.08
	  2 llvmpipe-11              0.05     0.08
	  2 llvmpipe-12              0.05     0.08
	  2 llvmpipe-13              0.05     0.08
	  2 llvmpipe-14              0.05     0.08
	  2 llvmpipe-15              0.05     0.08
	  2 llvmpipe-2               0.05     0.08
	  2 llvmpipe-3               0.05     0.08
	  2 llvmpipe-4               0.05     0.08
	  2 llvmpipe-5               0.05     0.08
	  2 llvmpipe-6               0.05     0.08
	  2 llvmpipe-7               0.05     0.08
	  2 llvmpipe-8               0.05     0.08
	  2 llvmpipe-9               0.05     0.08
	  2 glxinfo:cs0              0.05     0.02
	  2 glxinfo:disk$0           0.05     0.02
	  2 glxinfo:sh0              0.05     0.02
	  2 glxinfo:shlo0            0.05     0.02
	  6 clang                    0.04     0.08
	  3 rocminfo                 0.03     0.00
	  1 lspci                    0.01     0.02
	  1 ps                       0.00     0.01
	 88 sh                       0.00     0.00
	 13 gcc                      0.00     0.00
	 12 srsran                   0.00     0.00
	 10 gsettings                0.00     0.00
	  8 stat                     0.00     0.00
	  8 systemd-detect-          0.00     0.00
	  6 llvm-link                0.00     0.00
	  5 phoronix-test-s          0.00     0.00
	  4 gmain                    0.00     0.00
	  2 cc                       0.00     0.00
	  2 dconf worker             0.00     0.00
	  2 lscpu                    0.00     0.00
	  2 uname                    0.00     0.00
	  2 which                    0.00     0.00
	  2 xset                     0.00     0.00
	  1 date                     0.00     0.00
	  1 dirname                  0.00     0.00
	  1 dmesg                    0.00     0.00
	  1 dmidecode                0.00     0.00
	  1 grep                     0.00     0.00
	  1 ifconfig                 0.00     0.00
	  1 ip                       0.00     0.00
	  1 lsmod                    0.00     0.00
	  1 mktemp                   0.00     0.00
	  1 qdbus                    0.00     0.00
	  1 readlink                 0.00     0.00
	  1 realpath                 0.00     0.00
	  1 sed                      0.00     0.00
	  1 sort                     0.00     0.00
	  1 stty                     0.00     0.00
	  1 systemctl                0.00     0.00
	  1 template.sh              0.00     0.00
	  1 wc                       0.00     0.00
	  1 xrandr                   0.00     0.00
0 processes running
47 maximum processes
Computation blocks
      64692) srsran           cpu=2 start=5.62  finish=15.68
        64693) pdsch_processor  cpu=1 start=5.63  finish=15.68
          64694) thread_0         cpu=3 start=5.65  finish=15.68
          64695) thread_1         cpu=15 start=5.65  finish=15.68
          64696) thread_2         cpu=14 start=5.65  finish=15.68
          64697) thread_3         cpu=4 start=5.65  finish=15.68
          64698) thread_4         cpu=9 start=5.65  finish=15.68
          64699) thread_5         cpu=12 start=5.66  finish=15.68
          64700) thread_6         cpu=7 start=5.66  finish=15.68
          64701) thread_7         cpu=11 start=5.66  finish=15.68
          64702) thread_8         cpu=5 start=5.66  finish=15.68
          64703) thread_9         cpu=6 start=5.66  finish=15.68
          64704) thread_10        cpu=8 start=5.66  finish=15.68
          64705) thread_11        cpu=13 start=5.66  finish=15.68
          64706) thread_12        cpu=11 start=5.66  finish=15.68
          64707) thread_13        cpu=2 start=5.66  finish=15.68
          64708) thread_14        cpu=0 start=5.66  finish=15.68
          64709) thread_15        cpu=10 start=5.66  finish=15.68