
Google libwebp2 library with image encoding. There are five workloads that run differing amounts of time. Looks like the last one takes a majority of the time.

Topdown profile shows overall a high retirement rate
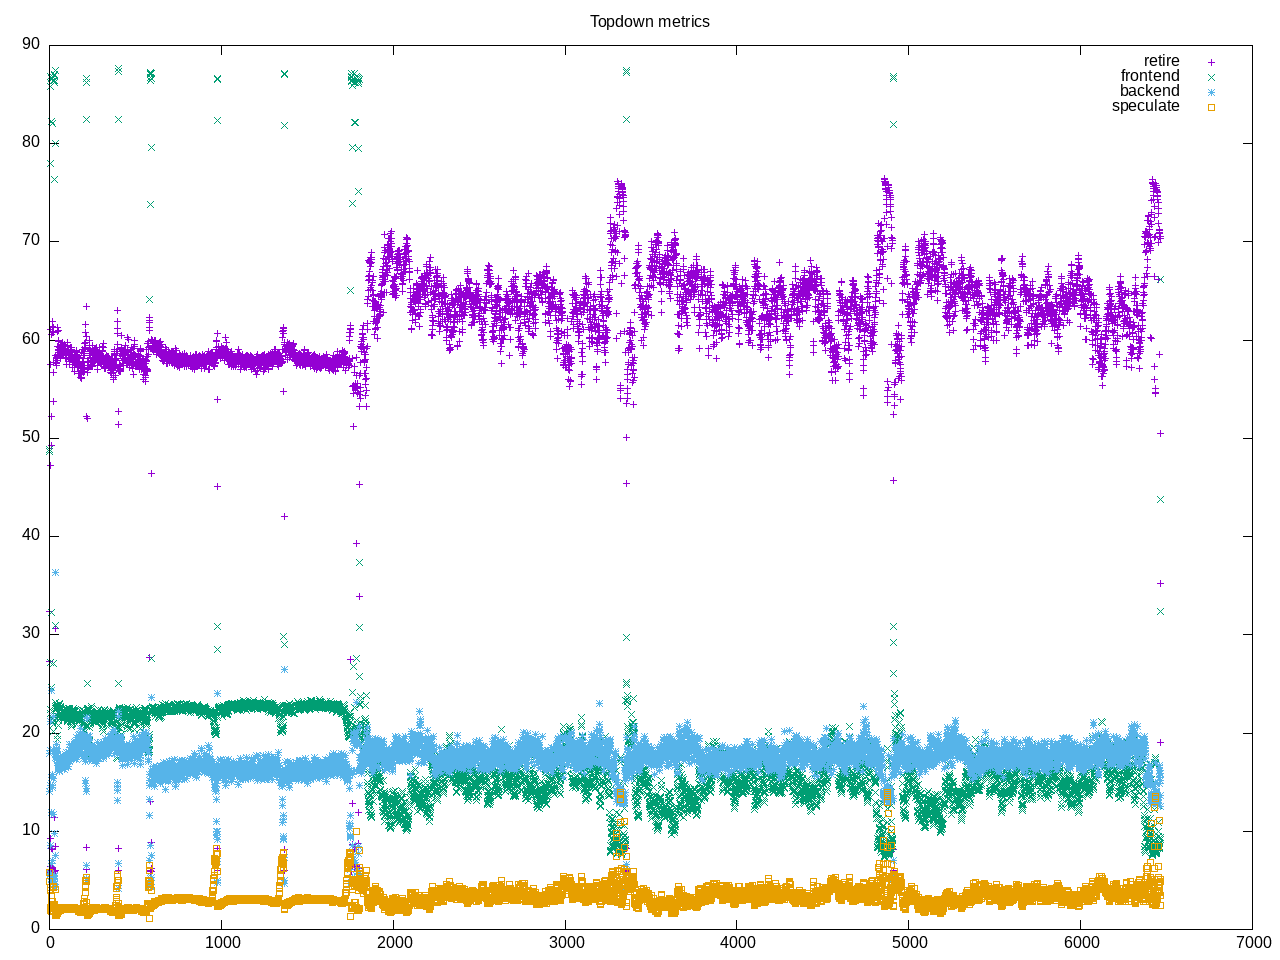
AMD metrics confirm the higher retirement rate. Some floating point code and lower amount of L2 access.
elapsed              6454.668
on_cpu               0.938          # 15.01 / 16 cores
utime                96826.664
stime                45.413
nvcsw                494978         # 29.55%
nivcsw               1179978        # 70.45%
inblock              8              # 0.00/sec
onblock              190864         # 29.57/sec
cpu-clock            96875999087966 # 96875.999 seconds
task-clock           96876761793744 # 96876.762 seconds
page faults          10494175       # 108.325/sec
context switches     1706972        # 17.620/sec
cpu migrations       160719         # 1.659/sec
major page faults    3              # 0.000/sec
minor page faults    10494172       # 108.325/sec
alignment faults     0              # 0.000/sec
emulation faults     0              # 0.000/sec
branches             126898490547422 # 158.007 branches per 1000 inst
branch misses        1318886240479  # 1.04% branch miss
conditional          77448549388599 # 96.435 conditional branches per 1000 inst
indirect             13673282628499 # 17.025 indirect branches per 1000 inst
cpu-cycles           384962570882363 # 3.72 GHz
instructions         803239029833114 # 2.09 IPC
slots                769854586083126 #
retiring             284609100009382 # 37.0% (62.1%) high
-- ucode             4043501393113  #     0.5%
-- fastpath          280565598616269 #    36.4%
frontend             78261693919570 # 10.2% (17.1%)
-- latency           42905861803014 #     5.6%
-- bandwidth         35355832116556 #     4.6%
backend              80176935537309 # 10.4% (17.5%) low
-- cpu               49494451462269 #     6.4%
-- memory            30682484075040 #     4.0%
speculation          15095623143789 #  2.0% ( 3.3%)
-- branch mispredict 15003422604144 #     1.9%
-- pipeline restart  92200539645    #     0.0%
smt-contention       311710573425872 # 40.5% ( 0.0%)
cpu-cycles           384784177103671 # 3.71 GHz
instructions         803248721506170 # 2.09 IPC
instructions         267743308628030 # 7.474 l2 access per 1000 inst
l2 hit from l1       1602663711417  # 7.55% l2 miss
l2 miss from l1      35570585376    #
l2 hit from l2 pf    282998514358   #
l3 hit from l2 pf    43222627984    #
l3 miss from l2 pf   72300954073    #
instructions         267647173786960 # 121.102 float per 1000 inst
float 512            79             # 0.000 AVX-512 per 1000 inst
float 256            616            # 0.000 AVX-256 per 1000 inst
float 128            32412525008255 # 121.102 AVX-128 per 1000 inst
float MMX            0              # 0.000 MMX per 1000 inst
float scalar         0              # 0.000 scalar per 1000 inst
instructions         803109168877818 #
opcache              127066718164852 # 158.218 opcache per 1000 inst
opcache miss         3493204387362  #  2.7% opcache miss rate
l1 dTLB miss         665818661116   # 0.829 L1 dTLB per 1000 inst
l2 dTLB miss         6124862374     # 0.008 L2 dTLB per 1000 inst
instructions         803111520402727 #
icache               4365248868945  # 5.435 icache per 1000 inst
icache miss          710717117556   # 16.3% icache miss rate
l1 iTLB miss         95935516176    # 0.119 L1 iTLB per 1000 inst
l2 iTLB miss         0              # 0.000 L2 iTLB per 1000 inst
tlb flush            142328         # 0.000 TLB flush per 1000 inst
Intel metrics
elapsed              8161.727
on_cpu               0.937          # 15.00 / 16 cores
utime                122359.757
stime                47.232
nvcsw                1448562        # 50.39%
nivcsw               1426173        # 49.61%
inblock              22528          # 2.76/sec
onblock              179512         # 21.99/sec
cpu-clock            122409623127842 # 122409.623 seconds
task-clock           122410292988041 # 122410.293 seconds
page faults          10143595       # 82.866/sec
context switches     2915091        # 23.814/sec
cpu migrations       124435         # 1.017/sec
major page faults    82             # 0.001/sec
minor page faults    10143513       # 82.865/sec
alignment faults     0              # 0.000/sec
emulation faults     0              # 0.000/sec
branches             127006812912740 # 158.044 branches per 1000 inst
branch misses        1410065467341  # 1.11% branch miss
conditional          127006812933188 # 158.044 conditional branches per 1000 inst
indirect             50858947018231 # 63.288 indirect branches per 1000 inst
slots                557076544137674 #
retiring             400021032719744 # 71.8% (71.8%) high
-- ucode             43305567539593 #     7.8%
-- fastpath          356715465180151 #    64.0%
frontend             80086580625828 # 14.4% (14.4%)
-- latency           33826533132000 #     6.1%
-- bandwidth         46260047493828 #     8.3%
backend              27264603206660 #  4.9% ( 4.9%) low
-- cpu               19162921555765 #     3.4%
-- memory            8101681650895  #     1.5%
speculation          59508409749058 # 10.7% (10.7%) high
-- branch mispredict 59089662975152 #    10.6%
-- pipeline restart  418746773906   #     0.1%
smt-contention       0              #  0.0% ( 0.0%)
cpu-cycles           346572446103804 # 2.67 GHz
instructions         760195516210084 # 2.19 IPC
l2 access            2119361444064  # 5.371 l2 access per 1000 inst
l2 miss              440106375672   # 20.77% l2 miss
cpu-cycles           179557431925404 # 11.4% memory latency
load stalls          20166657919693 #  8.7% l1 bound
l1 miss              4621141485201  #  1.9% l2 bound
l2 miss              1141520305635  #  0.2% l3 bound
l3 miss              849908241729   #  0.5% dram bound
store_stalls         259645621514   #  0.1% store bound
Process overview shows time spent in cwp2
512 processes
	234 cwp2                 896093.32   511.22
	 34 clinfo                  10.01     3.00
	 19 vulkaninfo               0.74     0.76
	  2 vulkani:disk$0           0.07     0.08
	  6 clang                    0.05     0.07
	  1 llvmpipe-0               0.04     0.04
	  1 llvmpipe-1               0.04     0.04
	  1 llvmpipe-10              0.04     0.04
	  1 llvmpipe-11              0.04     0.04
	  1 llvmpipe-12              0.04     0.04
	  1 llvmpipe-13              0.04     0.04
	  1 llvmpipe-14              0.04     0.04
	  1 llvmpipe-15              0.04     0.04
	  1 llvmpipe-2               0.04     0.04
	  1 llvmpipe-3               0.04     0.04
	  1 llvmpipe-4               0.04     0.04
	  1 llvmpipe-5               0.04     0.04
	  1 llvmpipe-6               0.04     0.04
	  1 llvmpipe-7               0.04     0.04
	  1 llvmpipe-8               0.04     0.04
	  1 llvmpipe-9               0.04     0.04
	  1 ps                       0.00     0.01
	 68 sh                       0.00     0.00
	 13 gcc                      0.00     0.00
	 13 rm                       0.00     0.00
	 13 webp2                    0.00     0.00
	 11 gsettings                0.00     0.00
	  8 systemd-detect-          0.00     0.00
	  7 stat                     0.00     0.00
	  6 llvm-link                0.00     0.00
	  4 glxinfo                  0.00     0.00
	  4 phoronix-test-s          0.00     0.00
	  3 gmain                    0.00     0.00
	  2 grep                     0.00     0.00
	  2 which                    0.00     0.00
	  1 cc                       0.00     0.00
	  1 date                     0.00     0.00
	  1 dconf worker             0.00     0.00
	  1 dirname                  0.00     0.00
	  1 ifconfig                 0.00     0.00
	  1 ip                       0.00     0.00
	  1 lscpu                    0.00     0.00
	  1 mktemp                   0.00     0.00
	  1 qdbus                    0.00     0.00
	  1 readlink                 0.00     0.00
	  1 realpath                 0.00     0.00
	  1 sed                      0.00     0.00
	  1 setterm                  0.00     0.00
	  1 sort                     0.00     0.00
	  1 stty                     0.00     0.00
	  1 systemctl                0.00     0.00
	  1 template.sh              0.00     0.00
	  1 wc                       0.00     0.00
28 processes running
47 maximum processes
Computation blocks
      13497) webp2            cpu=0 start=13.20 finish=16.73
        13498) cwp2             cpu=9 start=13.20 finish=16.71
          13499) cwp2             cpu=8 start=13.70 finish=16.67
          13500) cwp2             cpu=15 start=13.70 finish=16.67
          13501) cwp2             cpu=0 start=13.70 finish=16.67
          13502) cwp2             cpu=7 start=13.70 finish=16.67
          13503) cwp2             cpu=11 start=13.70 finish=16.67
          13504) cwp2             cpu=15 start=13.70 finish=16.67
          13505) cwp2             cpu=7 start=13.70 finish=16.67
          13506) cwp2             cpu=13 start=13.70 finish=16.67
          13507) cwp2             cpu=10 start=13.70 finish=16.67
          13508) cwp2             cpu=4 start=13.70 finish=16.67
          13509) cwp2             cpu=12 start=13.70 finish=16.67
          13510) cwp2             cpu=6 start=13.70 finish=16.67
          13511) cwp2             cpu=1 start=13.70 finish=16.67
          13512) cwp2             cpu=3 start=13.70 finish=16.69
          13513) cwp2             cpu=2 start=13.70 finish=16.69
          13514) cwp2             cpu=11 start=13.70 finish=16.69
          13515) cwp2             cpu=14 start=13.70 finish=16.70
        13517) rm               cpu=2 start=16.73 finish=16.73