
A set of C-language polyhedral benchmarks. There are three quick running tests.
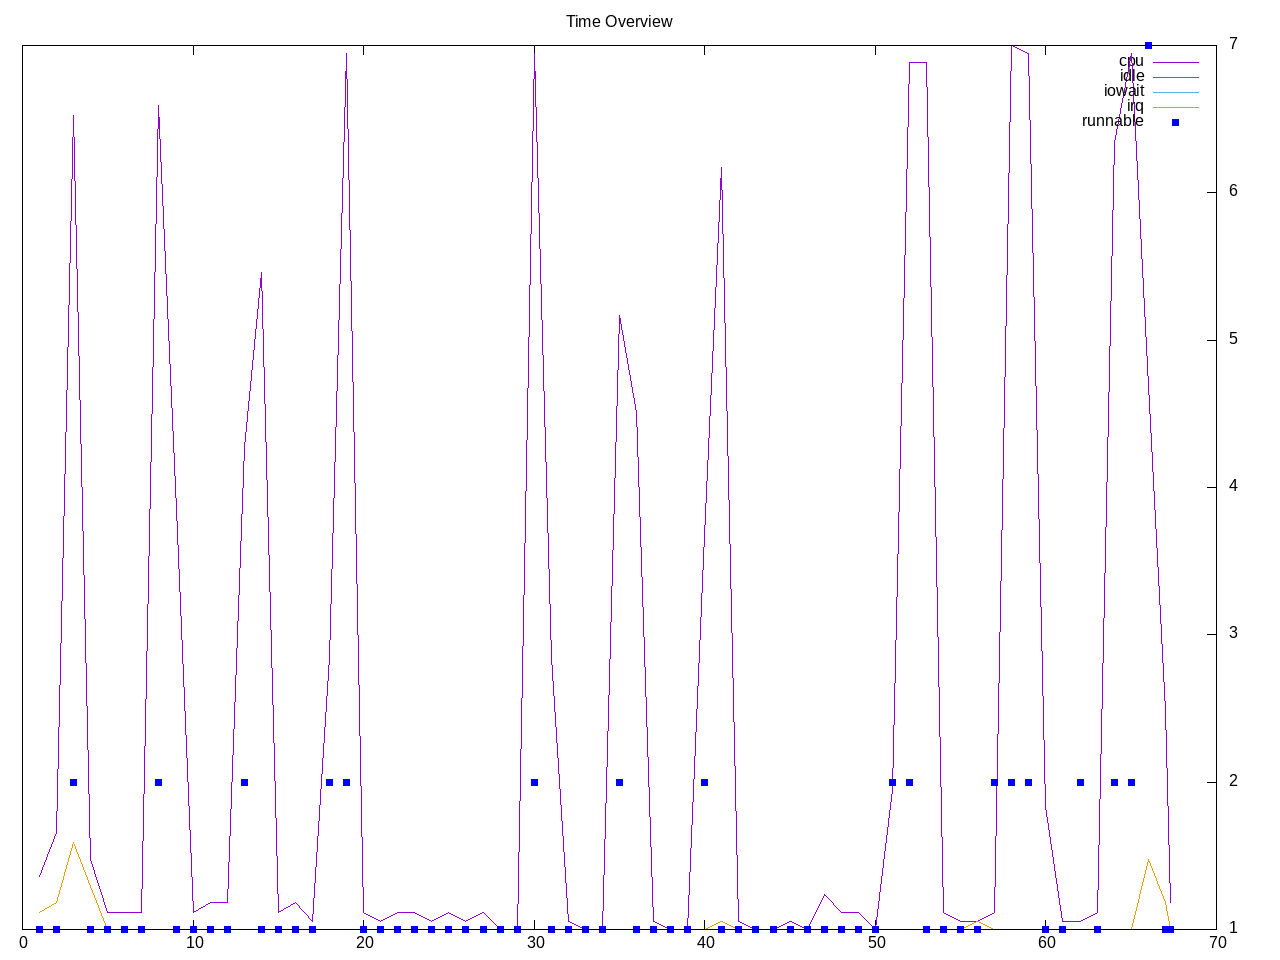
Topdown profile is similarly sparse.
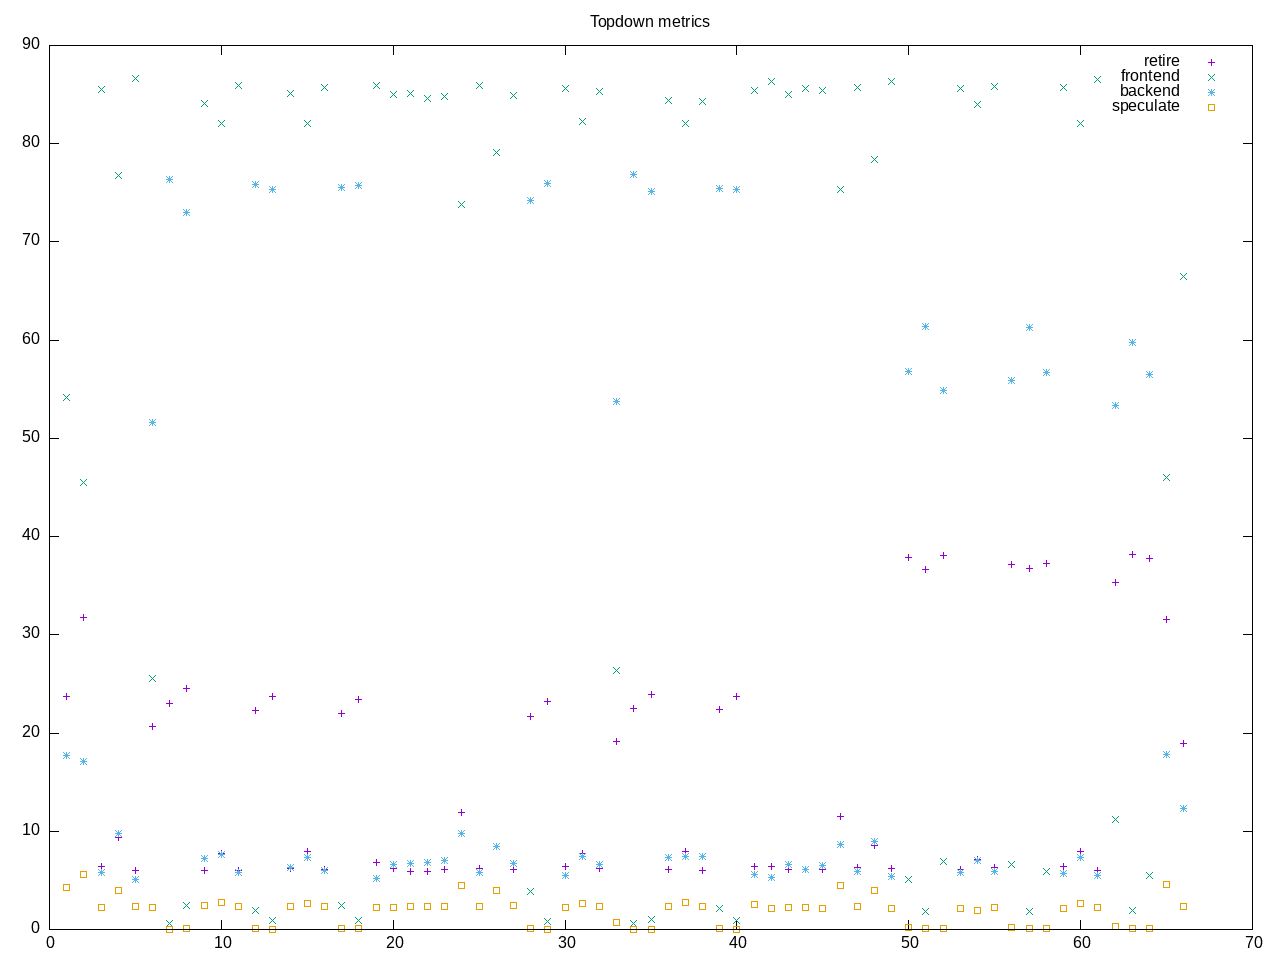
AMD metrics show less than 1/4 of core is used
elapsed              67.382
on_cpu               0.015          # 0.24 / 16 cores
utime                14.928
stime                1.044
nvcsw                2036           # 88.91%
nivcsw               254            # 11.09%
inblock              0              # 0.00/sec
onblock              12816          # 190.20/sec
cpu-clock            15999961726    # 16.000 seconds
task-clock           16003329029    # 16.003 seconds
page faults          299228         # 18697.860/sec
context switches     2446           # 152.843/sec
cpu migrations       262            # 16.372/sec
major page faults    2              # 0.125/sec
minor page faults    299226         # 18697.735/sec
alignment faults     0              # 0.000/sec
emulation faults     0              # 0.000/sec
branches             16223912644    # 137.618 branches per 1000 inst
branch misses        106135332      # 0.65% branch miss
conditional          15504802149    # 131.519 conditional branches per 1000 inst
indirect             46318603       # 0.393 indirect branches per 1000 inst
cpu-cycles           56802673451    # 0.05 GHz
instructions         116563864786   # 2.05 IPC
slots                115810833066   #
retiring             34742752204    # 30.0% (30.0%)
-- ucode             10738983       #     0.0%
-- fastpath          34732013221    #    30.0%
frontend             8382785080     #  7.2% ( 7.2%)
-- latency           5697719298     #     4.9%
-- bandwidth         2685065782     #     2.3%
backend              72008995376    # 62.2% (62.2%)
-- cpu               45273184687    #    39.1%
-- memory            26735810689    #    23.1%
speculation          645574399      #  0.6% ( 0.6%) low
-- branch mispredict 638080901      #     0.6%
-- pipeline restart  7493498        #     0.0%
smt-contention       30442664       #  0.0% ( 0.0%)
cpu-cycles           56803940933    # 0.05 GHz
instructions         116378467062   # 2.05 IPC
instructions         39369231008    # 276.827 l2 access per 1000 inst
l2 hit from l1       7276325564     # 5.84% l2 miss
l2 miss from l1      361027290      #
l2 hit from l2 pf    3346812187     #
l3 hit from l2 pf    266835347      #
l3 miss from l2 pf   8491441        #
instructions         39274623265    # 241.655 float per 1000 inst
float 512            55             # 0.000 AVX-512 per 1000 inst
float 256            538            # 0.000 AVX-256 per 1000 inst
float 128            9490912630     # 241.655 AVX-128 per 1000 inst
float MMX            0              # 0.000 MMX per 1000 inst
float scalar         0              # 0.000 scalar per 1000 inst
instructions         117774240339   #
opcache              4186166650     # 35.544 opcache per 1000 inst
opcache miss         717023170      # 17.1% opcache miss rate
l1 dTLB miss         18215253201    # 154.662 L1 dTLB per 1000 inst
l2 dTLB miss         105778786      # 0.898 L2 dTLB per 1000 inst
instructions         117784192075   #
icache               1513163017     # 12.847 icache per 1000 inst
icache miss          174490262      # 11.5% icache miss rate
l1 iTLB miss         8467310        # 0.072 L1 iTLB per 1000 inst
l2 iTLB miss         0              # 0.000 L2 iTLB per 1000 inst
tlb flush            17414          # 0.000 TLB flush per 1000 inst
Intel metrics are similarly quick, in this case showing backend bound nature in L2
elapsed              79.629
on_cpu               0.023          # 0.37 / 16 cores
utime                28.562
stime                0.560
nvcsw                1831           # 92.10%
nivcsw               157            # 7.90%
inblock              10216          # 128.30/sec
onblock              1576           # 19.79/sec
cpu-clock            29150212553    # 29.150 seconds
task-clock           29153359668    # 29.153 seconds
page faults          236174         # 8101.090/sec
context switches     2204           # 75.600/sec
cpu migrations       178            # 6.106/sec
major page faults    40             # 1.372/sec
minor page faults    236134         # 8099.718/sec
alignment faults     0              # 0.000/sec
emulation faults     0              # 0.000/sec
branches             14991982033    # 153.812 branches per 1000 inst
branch misses        22893515       # 0.15% branch miss
conditional          14991992401    # 153.813 conditional branches per 1000 inst
indirect             21024144       # 0.216 indirect branches per 1000 inst
slots                1796147433314  #
retiring             182199830495   # 10.1% (10.1%) low
-- ucode             21793493705    #     1.2%
-- fastpath          160406336790   #     8.9%
frontend             11742967638    #  0.7% ( 0.7%) low
-- latency           9138659764     #     0.5%
-- bandwidth         2604307874     #     0.1%
backend              1601029301507  # 89.1% (89.1%) high
-- cpu               452951150880   #    25.2%
-- memory            1148078150627  #    63.9%
speculation          3731819750     #  0.2% ( 0.2%) low
-- branch mispredict 2344944033     #     0.1%
-- pipeline restart  1386875717     #     0.1%
smt-contention       0              #  0.0% ( 0.0%)
cpu-cycles           259085483965   # 0.10 GHz
instructions         171145304834   # 0.66 IPC low
l2 access            53673106299    # 313.859 l2 access per 1000 inst
l2 miss              4743715242     # 8.84% l2 miss
cpu-cycles           261475873410   # 66.0% memory latency
load stalls          172553812136   #  0.0% l1 bound
l1 miss              173873149616   # 58.8% l2 bound
l2 miss              20114165538    #  4.8% l3 bound
l3 miss              7575873524     #  2.9% dram bound
store_stalls         114286947      #  0.0% store bound