
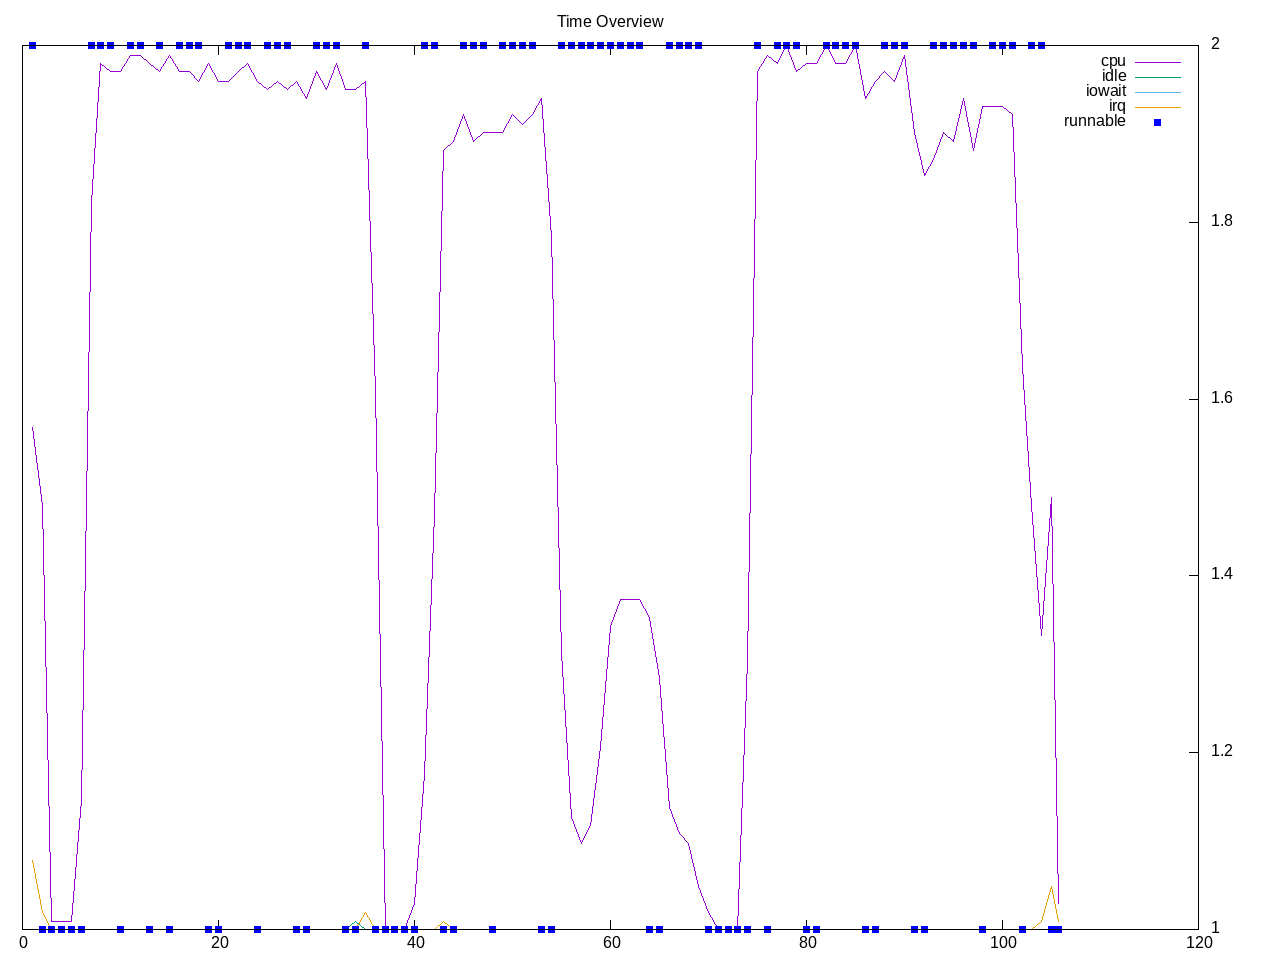
A cross-platform tool for measuring audio workloads. There is one workload which looks to be single threaded.
Topdown profile shows backend stalls with moderate retirement rate.
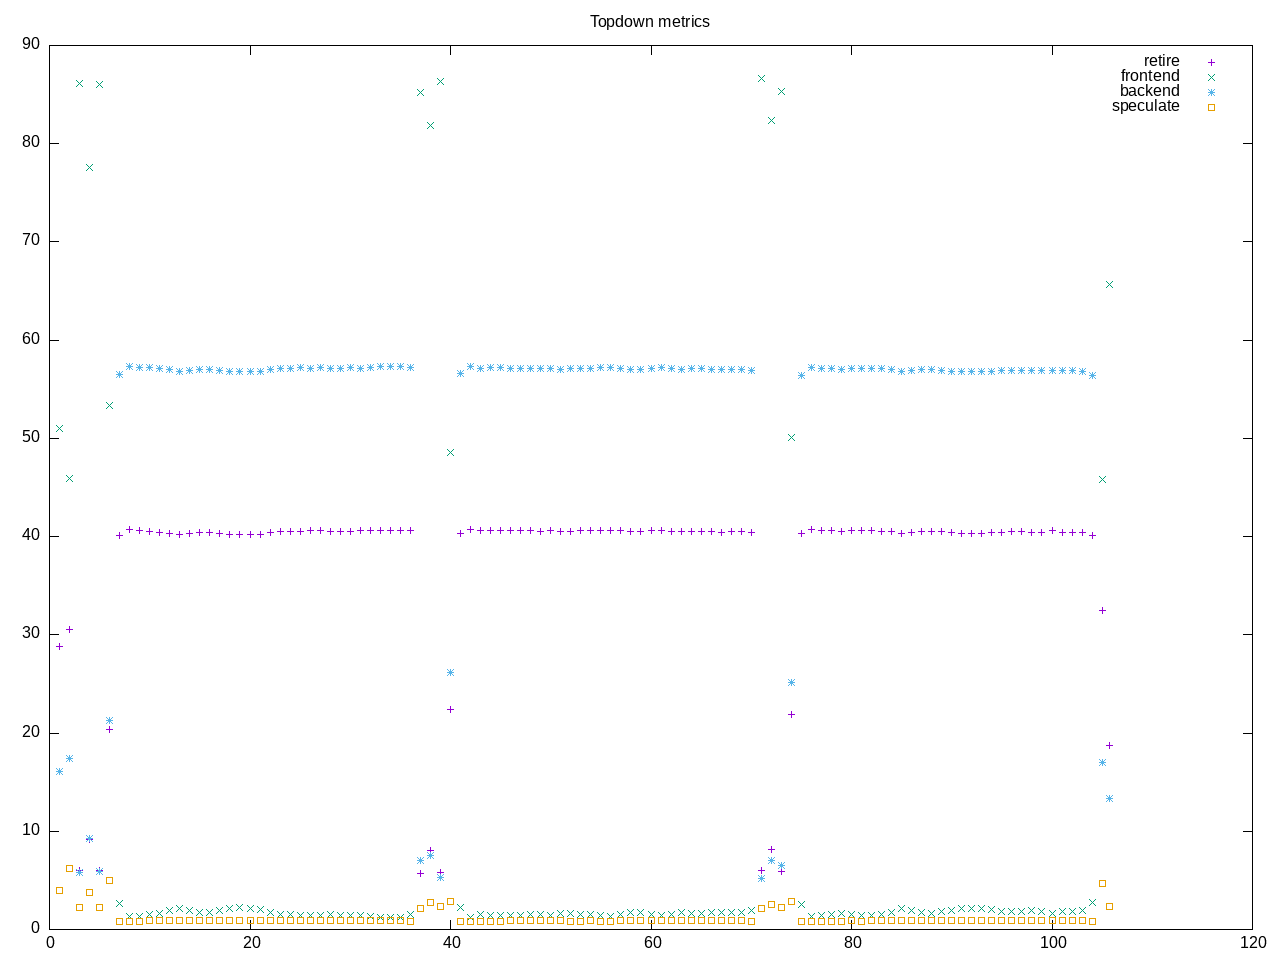
AMD metrics show this is floating point code with little L2 access. Backend stalls are predominately cpu.
elapsed              105.650
on_cpu               0.036          # 0.57 / 16 cores
utime                59.273
stime                0.775
nvcsw                39756          # 98.71%
nivcsw               520            # 1.29%
inblock              0              # 0.00/sec
onblock              12616          # 119.41/sec
cpu-clock            59468938031    # 59.469 seconds
task-clock           59564726441    # 59.565 seconds
page faults          148007         # 2484.810/sec
context switches     40634          # 682.182/sec
cpu migrations       266            # 4.466/sec
major page faults    2              # 0.034/sec
minor page faults    148005         # 2484.776/sec
alignment faults     0              # 0.000/sec
emulation faults     0              # 0.000/sec
branches             46871894861    # 94.897 branches per 1000 inst
branch misses        187526606      # 0.40% branch miss
conditional          41996871126    # 85.027 conditional branches per 1000 inst
indirect             587231450      # 1.189 indirect branches per 1000 inst
cpu-cycles           219250853248   # 0.13 GHz
instructions         490086343965   # 2.24 IPC
slots                452434780902   #
retiring             182227594048   # 40.3% (40.3%)
-- ucode             10336777       #     0.0%
-- fastpath          182217257271   #    40.3%
frontend             12201066081    #  2.7% ( 2.7%) low
-- latency           9700517124     #     2.1%
-- bandwidth         2500548957     #     0.6%
backend              253663365606   # 56.1% (56.1%)
-- cpu               205857012827   #    45.5%
-- memory            47806352779    #    10.6%
speculation          4294709493     #  0.9% ( 0.9%) low
-- branch mispredict 4276264787     #     0.9%
-- pipeline restart  18444706       #     0.0%
smt-contention       47790388       #  0.0% ( 0.0%)
cpu-cycles           220389252277   # 0.12 GHz
instructions         491261399409   # 2.23 IPC
instructions         166182218490   # 6.943 l2 access per 1000 inst
l2 hit from l1       1005763349     # 8.68% l2 miss
l2 miss from l1      36107522       #
l2 hit from l2 pf    84030790       #
l3 hit from l2 pf    6436841        #
l3 miss from l2 pf   57623846       #
instructions         165786840036   # 464.715 float per 1000 inst
float 512            56             # 0.000 AVX-512 per 1000 inst
float 256            588            # 0.000 AVX-256 per 1000 inst
float 128            77043622264    # 464.715 AVX-128 per 1000 inst
float MMX            0              # 0.000 MMX per 1000 inst
float scalar         0              # 0.000 scalar per 1000 inst
instructions         494497368571   #
opcache              58120077674    # 117.534 opcache per 1000 inst
opcache miss         779212981      #  1.3% opcache miss rate
l1 dTLB miss         71054834       # 0.144 L1 dTLB per 1000 inst
l2 dTLB miss         8664683        # 0.018 L2 dTLB per 1000 inst
instructions         494052603367   #
icache               1709122309     # 3.459 icache per 1000 inst
icache miss          280563902      # 16.4% icache miss rate
l1 iTLB miss         8377213        # 0.017 L1 iTLB per 1000 inst
l2 iTLB miss         0              # 0.000 L2 iTLB per 1000 inst
tlb flush            16750          # 0.000 TLB flush per 1000 inst
Intel metrics
elapsed              104.668
on_cpu               0.036          # 0.58 / 16 cores
utime                56.342
stime                4.307
nvcsw                48139          # 99.77%
nivcsw               113            # 0.23%
inblock              1560           # 14.90/sec
onblock              1336           # 12.76/sec
cpu-clock            59989924129    # 59.990 seconds
task-clock           60026167216    # 60.026 seconds
page faults          84456          # 1406.986/sec
context switches     48610          # 809.813/sec
cpu migrations       283            # 4.715/sec
major page faults    7              # 0.117/sec
minor page faults    84449          # 1406.870/sec
alignment faults     0              # 0.000/sec
emulation faults     0              # 0.000/sec
branches             45363872451    # 93.602 branches per 1000 inst
branch misses        107504576      # 0.24% branch miss
conditional          45363882499    # 93.602 conditional branches per 1000 inst
indirect             600244067      # 1.239 indirect branches per 1000 inst
slots                1343249001602  #
retiring             478430720105   # 35.6% (35.6%)
-- ucode             52612206079    #     3.9%
-- fastpath          425818514026   #    31.7%
frontend             121893034355   #  9.1% ( 9.1%)
-- latency           109851965797   #     8.2%
-- bandwidth         12041068558    #     0.9%
backend              685820239852   # 51.1% (51.1%)
-- cpu               556592250765   #    41.4%
-- memory            129227989087   #     9.6%
speculation          58889001730    #  4.4% ( 4.4%)
-- branch mispredict 58820241539    #     4.4%
-- pipeline restart  68760191       #     0.0%
smt-contention       0              #  0.0% ( 0.0%)
cpu-cycles           223946804452   # 0.13 GHz
instructions         484698306885   # 2.16 IPC
l2 access            3201126251     # 6.613 l2 access per 1000 inst
l2 miss              556105648      # 17.37% l2 miss
cpu-cycles           222652406059   # 10.1% memory latency
load stalls          22427575661    #  5.2% l1 bound
l1 miss              10820364309    #  4.6% l2 bound
l2 miss              646810658      #  0.2% l3 bound
l3 miss              172145664      #  0.1% dram bound
store_stalls         44575849       #  0.0% store bound
Process summary
360 processes
	  9 synthmark.app          177.88     0.39
	 68 clinfo                  17.79     5.66
	 38 vulkaninfo               0.95     1.53
	  6 glxinfo:gdrv0            0.15     0.06
	  6 glxinfo:gl0              0.15     0.06
	  4 vulkani:disk$0           0.10     0.17
	  6 clang                    0.08     0.04
	  2 glxinfo                  0.07     0.03
	  2 glxinfo:cs0              0.07     0.02
	  2 glxinfo:disk$0           0.07     0.02
	  2 glxinfo:sh0              0.07     0.02
	  2 glxinfo:shlo0            0.07     0.02
	  2 llvmpipe-0               0.05     0.09
	  2 llvmpipe-1               0.05     0.09
	  2 llvmpipe-10              0.05     0.09
	  2 llvmpipe-11              0.05     0.09
	  2 llvmpipe-12              0.05     0.09
	  2 llvmpipe-13              0.05     0.09
	  2 llvmpipe-14              0.05     0.09
	  2 llvmpipe-15              0.05     0.09
	  2 llvmpipe-2               0.05     0.09
	  2 llvmpipe-3               0.05     0.09
	  2 llvmpipe-4               0.05     0.09
	  2 llvmpipe-5               0.05     0.09
	  2 llvmpipe-6               0.05     0.09
	  2 llvmpipe-7               0.05     0.09
	  2 llvmpipe-8               0.05     0.09
	  2 llvmpipe-9               0.05     0.09
	  6 php                      0.04     0.09
	  3 rocminfo                 0.03     0.00
	  1 lspci                    0.00     0.02
	  1 ps                       0.00     0.01
	 82 sh                       0.00     0.00
	 13 gcc                      0.00     0.00
	 12 gsettings                0.00     0.00
	  8 stat                     0.00     0.00
	  8 systemd-detect-          0.00     0.00
	  6 llvm-link                0.00     0.00
	  5 phoronix-test-s          0.00     0.00
	  3 gmain                    0.00     0.00
	  3 synthmark                0.00     0.00
	  2 cc                       0.00     0.00
	  2 lscpu                    0.00     0.00
	  2 uname                    0.00     0.00
	  2 which                    0.00     0.00
	  2 xset                     0.00     0.00
	  1 date                     0.00     0.00
	  1 dconf worker             0.00     0.00
	  1 dirname                  0.00     0.00
	  1 dmesg                    0.00     0.00
	  1 dmidecode                0.00     0.00
	  1 grep                     0.00     0.00
	  1 ifconfig                 0.00     0.00
	  1 ip                       0.00     0.00
	  1 lsmod                    0.00     0.00
	  1 mktemp                   0.00     0.00
	  1 qdbus                    0.00     0.00
	  1 readlink                 0.00     0.00
	  1 realpath                 0.00     0.00
	  1 sed                      0.00     0.00
	  1 sort                     0.00     0.00
	  1 stty                     0.00     0.00
	  1 systemctl                0.00     0.00
	  1 template.sh              0.00     0.00
	  1 wc                       0.00     0.00
	  1 xrandr                   0.00     0.00
0 processes running
47 maximum processes
Computation block
      98316) synthmark        cpu=12 start=39.59 finish=69.64
        98317) synthmark.app    cpu=13 start=39.60 finish=69.64
          98318) synthmark.app    cpu=15 start=39.60 finish=69.60
            98319) synthmark.app    cpu=0 start=39.60 finish=69.60
      98320) synthmark        cpu=12 start=73.64 finish=103.69
        98321) synthmark.app    cpu=5 start=73.65 finish=103.69
          98322) synthmark.app    cpu=5 start=73.65 finish=103.65
            98323) synthmark.app    cpu=7 start=73.65 finish=103.65