
Classic compiler build, running approximately an hour and providing a good stress test. Compile workloads seem to have some of the highest frontend metrics (green) and many small quick processes. Branch prediction can also be higher (yellow) and there is some memory (blue).
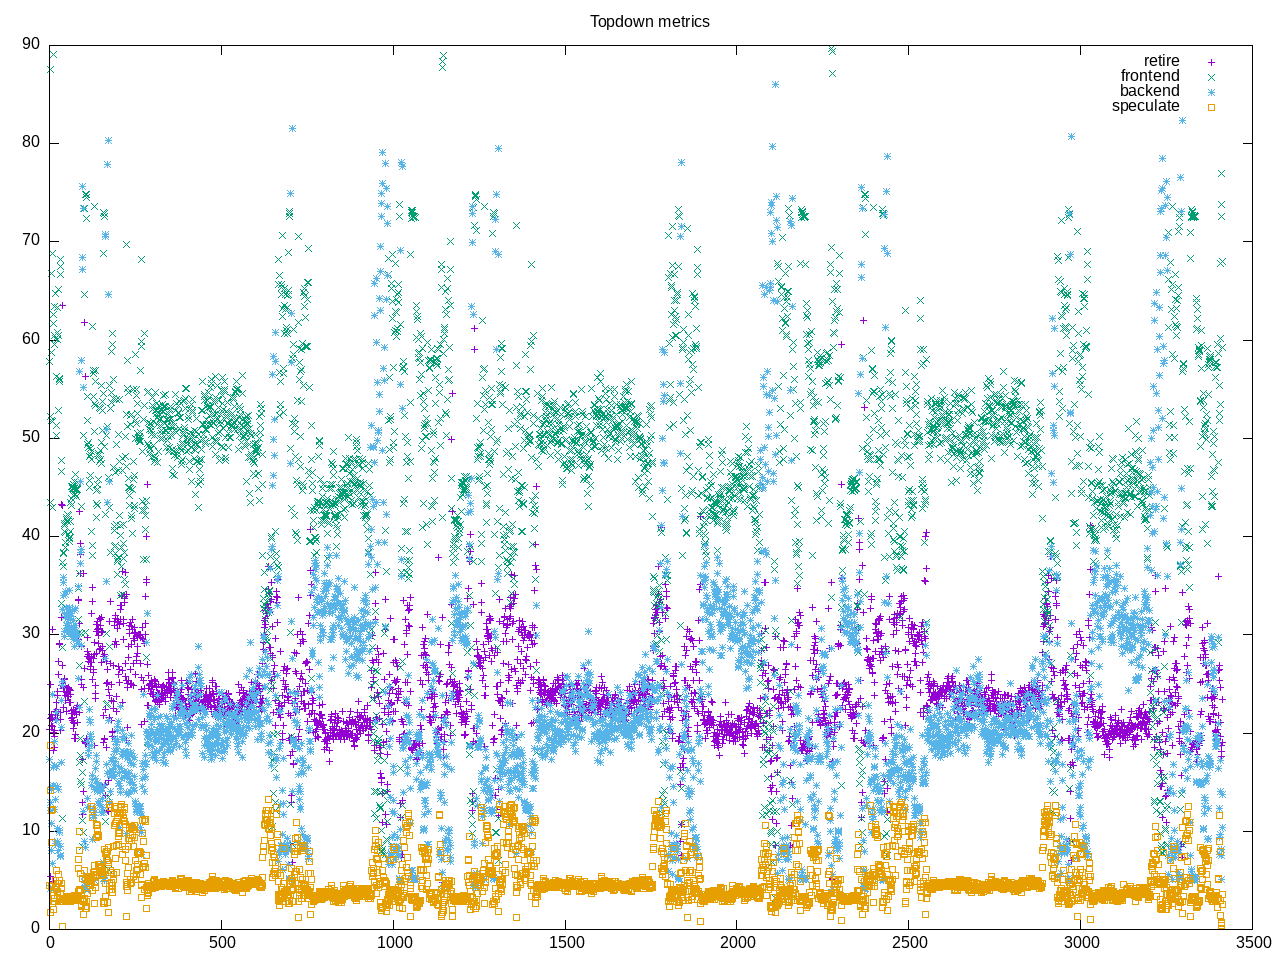
AMD metrics show a lot of branches and sometimes higher miss rate. The “on_cpu” amount also reflects waiting for disk and parts where the compilation is not as multi-threaded.
elapsed              3427.385
on_cpu               0.624          # 9.99 / 16 cores
utime                32190.169
stime                2045.712
nvcsw                1985244        # 48.41%
nivcsw               2115761        # 51.59%
inblock              516424         # 150.68/sec
onblock              98507112       # 28741.19/sec
cpu-clock            34213116381288 # 34213.116 seconds
task-clock           34214907130799 # 34214.907 seconds
page faults          513204835      # 14999.451/sec
context switches     3464477        # 101.256/sec
cpu migrations       239642         # 7.004/sec
major page faults    17576          # 0.514/sec
minor page faults    513187259      # 14998.938/sec
alignment faults     0              # 0.000/sec
emulation faults     0              # 0.000/sec
branches             30568358827057 # 192.709 branches per 1000 inst
branch misses        701201423712   # 2.29% branch miss
conditional          17638912593304 # 111.199 conditional branches per 1000 inst
indirect             487258108842   # 3.072 indirect branches per 1000 inst
cpu-cycles           138568869943175 # 2.53 GHz
instructions         156207628466024 # 1.13 IPC
slots                283067952990174 #
retiring             55133090858931 # 19.5% (23.1%)
-- ucode             32000982449    #     0.0%
-- fastpath          55101089876482 #    19.5%
frontend             115172179636077 # 40.7% (48.2%)
-- latency           86764652204442 #    30.7%
-- bandwidth         28407527431635 #    10.0%
backend              57849381391632 # 20.4% (24.2%)
-- cpu               6077068920462  #     2.1%
-- memory            51772312471170 #    18.3%
speculation          10655334197850 #  3.8% ( 4.5%)
-- branch mispredict 8804136631900  #     3.1%
-- pipeline restart  1851197565950  #     0.7%
smt-contention       44257340647327 # 15.6% ( 0.0%)
cpu-cycles           138652693363066 # 2.52 GHz
instructions         156238086746318 # 1.13 IPC
instructions         52819253385890 # 40.743 l2 access per 1000 inst
l2 hit from l1       1931591401779  # 16.62% l2 miss
l2 miss from l1      244520309408   #
l2 hit from l2 pf    107325558661   #
l3 hit from l2 pf    59042583282    #
l3 miss from l2 pf   54059169410    #
instructions         52796829647902 # 7.270 float per 1000 inst
float 512            179380         # 0.000 AVX-512 per 1000 inst
float 256            21703524       # 0.000 AVX-256 per 1000 inst
float 128            383802719307   # 7.269 AVX-128 per 1000 inst
float MMX            0              # 0.000 MMX per 1000 inst
float scalar         0              # 0.000 scalar per 1000 inst
Intel metrics including 10% of the time attributed to branch misprediction.
elapsed              3634.438
on_cpu               0.676          # 10.82 / 16 cores
utime                37835.081
stime                1472.287
nvcsw                1922325        # 49.28%
nivcsw               1978190        # 50.72%
inblock              614832         # 169.17/sec
onblock              98598064       # 27128.83/sec
cpu-clock            39269125917324 # 39269.126 seconds
task-clock           39271771617236 # 39271.772 seconds
page faults          512960631      # 13061.815/sec
context switches     3281468        # 83.558/sec
cpu migrations       389949         # 9.929/sec
major page faults    12097          # 0.308/sec
minor page faults    512948534      # 13061.507/sec
alignment faults     0              # 0.000/sec
emulation faults     0              # 0.000/sec
branches             30254370267193 # 191.071 branches per 1000 inst
branch misses        455639475516   # 1.51% branch miss
conditional          30254391920953 # 191.071 conditional branches per 1000 inst
indirect             8710920825064  # 55.014 indirect branches per 1000 inst
slots                220536156479210 #
retiring             90522893095036 # 41.0% (41.0%)
-- ucode             7820401372828  #     3.5%
-- fastpath          82702491722208 #    37.5%
frontend             81438050633294 # 36.9% (36.9%)
-- latency           38745936530923 #    17.6%
-- bandwidth         42692114102371 #    19.4%
backend              25344106231891 # 11.5% (11.5%)
-- cpu               11855996482089 #     5.4%
-- memory            13488109749802 #     6.1%
speculation          23721466183852 # 10.8% (10.8%)
-- branch mispredict 22607620934670 #    10.3%
-- pipeline restart  1113845249182  #     0.5%
smt-contention       0              #  0.0% ( 0.0%)
cpu-cycles           84130561222309 # 1.46 GHz
instructions         121342432799798 # 1.44 IPC
l2 access            3608782396433  # 39.796 l2 access per 1000 inst
l2 miss              782438848933   # 21.68% l2 miss
Over 600,000 processes provides a good stress test for the cpu tracing. The 500+ processes marked as running are ones where we somehow received the fork event but missed an exit event to close out the process. The largest fraction of overall time is spent in the compiler processes.
676238 processes
	14002 cc1plus              27709.21   796.22
	27073 cc1                   2320.38   152.84
	38430 as                     441.70    51.52
	  9 genattrtab             245.76     0.94
	8420 ld                     184.42    32.95
	  9 genautomata            136.13     3.53
	227581 bash                    37.29    62.66
	  9 genoutput               34.05     0.48
	 27 genpreds                22.00     0.35
	  9 genrecog                19.84     0.58
	144 msgmerge                17.94     0.16
	  9 genextract              11.62     0.16
	  9 gencodes                11.49     0.12
	908 make                    11.28     4.12
	  9 genemit                 11.23     0.27
	  9 genconfig               11.20     0.12
	  9 genopinit               10.97     0.16
	  9 genpeep                 10.91     0.17
	  9 genattr                 10.84     0.18
	  9 genflags                10.80     0.21
	  9 genattr-common          10.68     0.16
	  9 gentarget-def           10.68     0.14
	1111 f951                     7.18     0.70
	 15 pod2man                  7.08     0.02
	  9 genconditions            6.90     0.11
	468 fixincl                  5.12     0.19
	1122 mawk                     3.41     0.02
	  1 xz                       3.34     0.18
	 24 perl                     2.93     0.21
	 18 gengtype                 2.71     0.20
	 24 genchecksum              1.27     0.21
	 18 genmatch                 1.13     0.12
	71119 sed                      0.84     0.00
	 38 vulkaninfo               0.76     1.06
	579 ar                       0.69     6.85
	261 print                    0.65     0.06
	 33 cc1obj                   0.42     0.05
	  6 php                      0.28     1.25
	297 ranlib                   0.27     6.04
	46226 cat                      0.26     2.29
	 13 tar                      0.21     2.89
	  9 genenums                 0.12     0.00
	  9 genconstants             0.11     0.00
	57476 rm                       0.09     5.62
	  4 vulkani:disk$0           0.08     0.11
	  9 genmddeps                0.08     0.01
	  2 llvmpipe-0               0.04     0.06
	  2 llvmpipe-1               0.04     0.06
	  2 llvmpipe-10              0.04     0.06
	  2 llvmpipe-11              0.04     0.06
	  2 llvmpipe-12              0.04     0.06
	  2 llvmpipe-13              0.04     0.06
	  2 llvmpipe-14              0.04     0.06
	  2 llvmpipe-15              0.04     0.06
	  2 llvmpipe-2               0.04     0.06
	  2 llvmpipe-3               0.04     0.06
	  2 llvmpipe-4               0.04     0.06
	  2 llvmpipe-5               0.04     0.06
	  2 llvmpipe-6               0.04     0.06
	  2 llvmpipe-7               0.04     0.06
	  2 llvmpipe-8               0.04     0.06
	  2 llvmpipe-9               0.04     0.06
	  6 clang                    0.04     0.02
	7030 xg++                     0.00     0.23
	197 find                     0.00     0.20
	4574 mkdir                    0.00     0.09
	396 nm                       0.00     0.09
	3216 g++                      0.00     0.06
	  1 lspci                    0.00     0.03
	28728 xgcc                     0.00     0.02
	39074 basename                 0.00     0.00
	22391 mv                       0.00     0.00
	12805 grep                     0.00     0.00
	7569 collect2                 0.00     0.00
	6644 rmdir                    0.00     0.00
	5727 cp                       0.00     0.00
	5502 expr                     0.00     0.00
	5136 dirname                  0.00     0.00
	4566 strip                    0.00     0.00
	4459 gcc                      0.00     0.00
	3663 ln                       0.00     0.00
	3199 uname                    0.00     0.00
	2295 cmp                      0.00     0.00
	1626 chmod                    0.00     0.00
	1372 sort                     0.00     0.00
	1120 gfortran                 0.00     0.00
	1057 tr                       0.00     0.00
	1023 conftest                 0.00     0.00
	541 hostname                 0.00     0.00
	420 diff                     0.00     0.00
	408 ls                       0.00     0.00
	312 arch                     0.00     0.00
	291 awk                      0.00     0.00
	248 sh                       0.00     0.00
	231 install                  0.00     0.00
	207 touch                    0.00     0.00
	198 objdump                  0.00     0.00
	165 echo                     0.00     0.00
	160 mktemp                   0.00     0.00
	140 tmpmultilib3             0.00     0.00
	135 missing                  0.00     0.00
	 93 getconf                  0.00     0.00
	 84 file                     0.00     0.00
	 84 true                     0.00     0.00
	 84 uniq                     0.00     0.00
	 82 tmpmultilib4             0.00     0.00
	 72 sleep                    0.00     0.00
	 72 tmpmultilib              0.00     0.00
	 54 msgfmt                   0.00     0.00
	 48 configure                0.00     0.00
	 47 cc                       0.00     0.00
	 44 move-if-change           0.00     0.00
	 36 genhooks                 0.00     0.00
	 36 genmodes                 0.00     0.00
	 36 xgettext                 0.00     0.00
	 20 which                    0.00     0.00
	 18 bison                    0.00     0.00
	 18 gencfn-macros            0.00     0.00
	 18 ld.gold                  0.00     0.00
	 15 compare-debug            0.00     0.00
	 15 tmpmultilib2             0.00     0.00
	 10 date                     0.00     0.00
	  9 c++filt                  0.00     0.00
	  9 gencheck                 0.00     0.00
	  9 gencondmd                0.00     0.00
	  9 gengenrtl                0.00     0.00
	  9 genversion               0.00     0.00
	  9 git                      0.00     0.00
	  9 mkheader.sh              0.00     0.00
	  9 objcopy                  0.00     0.00
	  9 python3                  0.00     0.00
	  9 readelf                  0.00     0.00
	  9 stty                     0.00     0.00
	  9 tail                     0.00     0.00
	  8 stat                     0.00     0.00
	  8 systemd-detect-          0.00     0.00
	  7 gsettings                0.00     0.00
	  6 llvm-link                0.00     0.00
	  6 pwd                      0.00     0.00
	  5 glxinfo                  0.00     0.00
	  5 gmain                    0.00     0.00
	  5 phoronix-test-s          0.00     0.00
	  4 dconf worker             0.00     0.00
	  3 build-gcc 	  3 xargs                    0.00     0.00
	  2 clinfo                   0.00     0.00
	  2 lscpu                    0.00     0.00
	  2 setterm                  0.00     0.00
	  1 dmesg                    0.00     0.00
	  1 dmidecode                0.00     0.00
	  1 ifconfig                 0.00     0.00
	  1 ip                       0.00     0.00
	  1 lsmod                    0.00     0.00
	  1 ps                       0.00     0.00
	  1 qdbus                    0.00     0.00
	  1 readlink                 0.00     0.00
	  1 realpath                 0.00     0.00
	  1 systemctl                0.00     0.00
	  1 template.sh              0.00     0.00
	  1 wc                       0.00     0.00
573 processes running
640 maximum processes